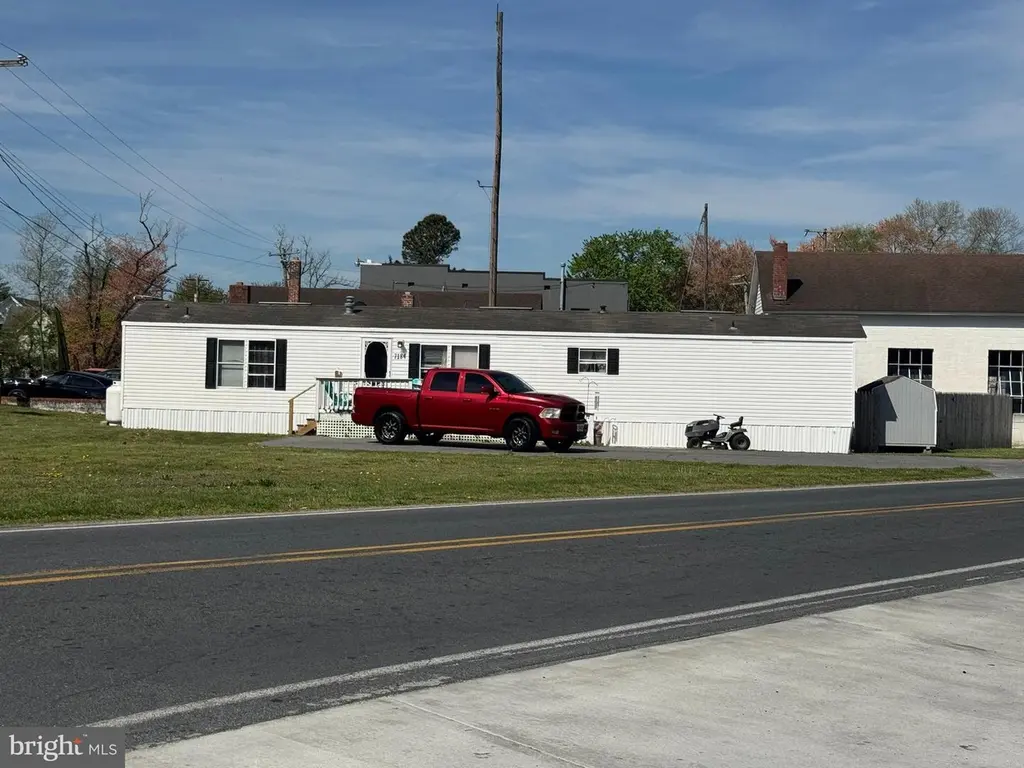
7184 Parsonsburg Rd · Parsonsburg, MD
Flood risk No data
- FEMA flood zone
- —
- Chance of flooding over 30 yrs
- —
- Est. flood insurance / yr
- —
Fire risk No data
- Est. fire insurance / yr
- —
Heat risk No data
- Hot days now (above threshold)
- —
- Hot days in 30 yrs
- —
Wind risk No data
- Chance of severe wind over 30 yrs
- —
Air-quality risk No data
- Unhealthy air days now
- —
- Unhealthy air days in 30 yrs
- —
Risk factors via First Street. Map © Google.
Why this score? — see what drove the C+ grade
The composite is a weighted blend of 9 inputs, each scored 0–100. Each bar is that input's sub-score; the figure is the points it added to the 100-point composite (weight × sub-score).
- Cash flow +24.2/30.0
- ARV discount +15.0/15.0
- DSCR +7.8/10.0
- 1% rule +5.2/10.0
- Livability +2.8/5.0
- Rent growth +2.5/5.0
- Condition / age +2.5/5.0
- Schools +1.9/10.0
- Appreciation +0.0/10.0
$135,000
🖨 Deal sheet 📄 Offer letter ✓ Due diligence
Listing remarks MLS
corner/ commercial lot with great visibility/ located on the corner of Parsonsburg & Old Ocean City Rd.
Key facts
- 1 acre lot
- Built 2012
- Listed 51 days
Property features AI
Exterior
- Parking: Driveway
- Utilities: Well water; On-site septic; Electric hot water
- Home design: Manufactured home; Fee simple ownership
- Construction: Aluminum siding
- Exterior features: Not located in a federal flood zone; Tidal water not present
Interior
- Bedrooms: 3 bedrooms on the main level
- Bathrooms: 2 full bathrooms (both on the main level)
- Heating & cooling: Heat pump(s) heating; Electric cooling
- Interior features: No basement; Living area per assessor
Neighborhood map
What this means for you Summary
Snapshot
- This is a 3-bed/1.0-bath manufactured listed at $135k.
Deal economics
- At list price, monthly cash flow is $270 ($3k/yr) — positive.
- The deal already cash-flows at list — no discount required.
- Meets the 1% rule at list price ($1k rent vs $135k).
- Recommended offer: $131k (3.0% below list) — sets the bar for market timing.
Location & tenants
- Location reads 55/100 on livability (#414 in MD) — a working-class tenant base; expect higher turnover. Strengths: housing A, cost of living B; Watch: schools F, crime F, amenities F.
- Wicomico County Public Schools (urban): math 16% / reading 26% proficiency, ranked #19 of 24 in MD (top 79%) — low school quality limits family demand, transient renter base, plan for 1-2y turnover.
- Market conditions: 24 active listings in the ZIP; 278 units permitted in Wicomico County in 2024 (44 in 5+ unit buildings).
Forward outlook
- Local home prices are declining (-3.0%/yr); year-one equity from $933 of loan paydown is wiped out by about $4k of value loss. Plan a longer hold.
- Wicomico County population projected at +14% by 2050 — modest demand growth; plan on rents tracking national, not racing it.
Negotiation context
- It's been on market 51 days — a 3% lower offer ($131k) is reasonable based on typical stale-listing flexibility.
- 5 sale attempts since 17y ago with the ask held roughly flat each time — persistent listings suggest the price (not the market) is what's stuck; bring a comps-based counter.
- Current owner paid $11k; list at $135k implies a 1127% gain — meaningful room to come down on a strong offer.
Questions for the listing agent
- It's been on market 51 days. Have you received any prior offers? Is the seller open to a 3% concession, seller financing, or rate buy-down credit?
- Is there a deadline driving the sale (1031 exchange, divorce, estate, relocation)? That informs how much negotiation room exists.
- Schools are F-rated, which usually means shorter tenancies and higher turnover. Who's the typical renter profile here, and what's been the actual vacancy rate?
- Crime grade is F in this area — have there been break-ins, vandalism, or insurance claims at this property in the last 3 years? What carrier currently insures it and at what premium?
- What's the average days-on-market for RENTAL listings here right now (not sales)? A rising rental-DOM trend means longer vacancies and softer asking-rent achievability than the comps imply.
- What's the recent tenant-quality profile in this submarket — average credit score on applications, eviction rate, late-payment / NSF rate, and stable-employment percentage? A property-management company in the area should have these aggregated.
- How much new for-sale + rental construction is in the pipeline within 1–3 miles? Heavy new supply typically softens prices + rents 12–24 months out; constrained supply supports both.
Investment metrics
- 1% rule
- 1.02% ✓
- Cap rate
- 8.70%
- Cash-on-cash
- 8.58%
- DSCR
- 1.38
- GRM
- 8.2
CMA / ARV
- ARV (median comp)
- $190,022
- List price
- $135,000
- Delta
- -28.96%
- Verdict
- UNDERPRICED
- Comps
- 7 within 1.0 mi
Projected returns pro-forma
-3.0% appreciation · 3.0% rent growth · sell at horizon
- IRR
- -3.3%
- Equity multiple
- 0.88×
- Total profit
- $-4,706
- Equity at exit
- $20,129
- IRR
- 6.3%
- Equity multiple
- 1.47×
- Total profit
- $17,864
- Equity at exit
- $11,672
Cash invested: $37,800 (down + closing). Projections, not guarantees.
Landlord ↔ Tenant lean methodology
- Overall (STATE)
- 27 Tenant-Leaning
- State Maryland
- 27 Tenant-Leaning · D+14
- County
- — inherits STATE
- City
- — inherits STATE
ZIP-level market 21849
- Home prices YoY
- -5.5%
- Active inventory
- 24
- Price-to-rent
- 8.2×
Monthly cashflow live
- Estimated rent
- $1,371 medium interval (Pro) →
- Mortgage (P&I)
- −$708
- Tax from tax record
- −$49 /mo · $585/yr
- Insurance
- −$56
- HOA
- −$0
- Vacancy / Maint / Mgmt
- −$288
- Net cashflow
- $270
Break-even live
UW: 25.0% down · 7.5% · 30yr · 1.5% tax · 5.0% vac · 8.0% maint · 8.0% mgmt
Financing live
Cash to close
- Down payment
- $33,750
- Closing costs
- $4,050
- Reserves months
- —
- Total cash needed
- —
Loan-product check · same deal, 3 products live
Conventional
25% down · 7.5% · 30yr
- Down + closing
- —
- Monthly P&I
- —
- Monthly cashflow
- —
- DSCR
- —
- Eligible?
- —
Personal DTI + credit; lowest rate.
DSCR
20% down · 8.5% · 30yr
- Down + closing
- —
- Monthly P&I
- —
- Monthly cashflow
- —
- DSCR
- —
- Eligible?
- —
No personal income docs; deal must DSCR.
Hard money
10% down · 12.0% · 12mo
- Down + closing
- —
- Monthly P&I
- —
- Monthly cashflow
- —
- DSCR
- —
- Eligible?
- —
Short-term bridge; refi at stabilization.
Listing history 24 events
-
2026-06-18days on market $135,000 Active 51 DOM
-
2026-06-17days on market $135,000 Active 50 DOM
-
2026-06-16days on market $135,000 Active 49 DOM
-
2026-06-15days on market $135,000 Active 48 DOM
-
2026-06-14days on market $135,000 Active 46 DOM
-
2026-06-13days on market $135,000 Active 45 DOM
-
2026-06-10days on market $135,000 Active 43 DOM
-
2026-06-09days on market $135,000 Active 42 DOM
-
2026-06-08days on market $135,000 Active 41 DOM
-
2026-06-07days on market $135,000 Active 40 DOM
-
2026-06-03days on market $135,000 Active 36 DOM
-
2026-06-02days on market $135,000 Active 35 DOM
-
2026-06-01days on market $135,000 Active 34 DOM
-
2026-05-31days on market $135,000 Active 33 DOM
-
2026-05-30days on market $135,000 Active 32 DOM
-
2026-04-28$135,000 Active 138-char remark
-
2011-09-19soldstatus $11,000 109-char remark
Show marketing remark (109 chars)
corner/ commercial lot with great visibility/ located on the corner of Parsonsburg & Old Ocean City Rd.
-
2010-10-01$36,000 109-char remark
Show marketing remark (109 chars)
corner/ commercial lot with great visibility/ located on the corner of Parsonsburg & Old Ocean City Rd.
-
2010-01-01historical Expired
-
2010-01-01historical
-
2009-12-31historical
-
2009-08-03Active
-
2009-08-03$54,900
-
2009-03-11$54,900
ⓘ Source: listings_history table (triggers on properties + properties_extension) + one-shot
backfill from property_details.listing_events for pre-trigger history.
Tax reassessment forecast MD · Partial reset (capped growth)
- Current annual tax
- $585 · $49/mo
- Projected year-2 tax
- $1,028 · $86/mo
- Expected delta
- +$443/yr (+$37/mo · 75.8%)
ⓘ Screening estimate from a state-policy table — verify with the county assessor before closing.
Nearby sold comps map
Loading sold comps map…
Walkable amenities ~0.75 mi
Loading nearby amenities…
Taxation est. · year 1
- Rental income
- $16,456
- − Mortgage interest
- −$7,562
- − Property taxes
- −$585
- − Insurance
- −$675
- − Repairs & maintenance
- −$1,316
- − Management
- −$1,316
- − Depreciation
- −$3,927
- Taxable income
- $1,074
- Est. tax owed @ 24.0%
- −$258
- After-tax cash flow
- $2,987/yr
For passive investors: Depreciation is non-cash, so a rental often shows a tax loss while cash-flowing — sheltering income. Rental losses are passive: they offset passive income freely, and up to $25,000/yr can offset ordinary (W-2) income if you actively participate and your MAGI is under $100k (phasing out to $0 by $150k); unused losses carry forward. On sale, claimed depreciation is recaptured at up to 25%, and gains may owe capital-gains tax (a 1031 exchange can defer both). Figures are a year-1 estimate at your 24.0% rate — not tax advice; consult a CPA.
Schools (NCES district)
- District
- Wicomico County Public Schools
- NCES district ID
- 2400690
- Math proficiency
- 16% ▼ -18.00%
- Reading proficiency
- 26% ▼ -13.00%
- Median HH income
- $51,745
- Composite
- 18.87/100
- National rank
- #8860
- State rank
- #19 of 24 in MD
Livability — Parsonsburg
- Score
- 55/100
- State rank
- #414
- US rank
- #23152
Category grades
Schools grade is shown separately in the Schools card above.
Census & demographics
- Census place
- Parsonsburg, MD
- Population (ZIP)
- 3,845
Population outlook (Wicomico County) Hauer SSP2
- Today (2025)
- 108,548 people
- By 2030
- 111,783 · +3.0%
- By 2040
- 118,139 · +8.8%
- By 2050
- 123,641 · +13.9%
- By 2075
- 139,784 · +28.8%
- By 2100
- 145,334 · +33.9%
Race, ethnicity, and origin ACS 2023
- Neighborhood character
- Predominantly White (86%)
- Race & ethnicity
- White 86% Black 8% Two or more races 5%
- Common ancestry
- Russian 7% Italian 4% Slovak 2%
- Foreign-born
- 1% · China
- Languages at home
- 99% English-only · Chinese 1%
Political lean MEDSL · Wicomico
- 2024 margin
- Lean R (+5.5) · D 46.1% · R 51.5% · Other 2.4%
- 2008→2024 swing
- +0.3pp no change · 2008: -5.8pp · 2024: -5.5pp
- All cycles
- 2024: R+5.5 2020: R+1.9 2016: R+11.6 2012: R+6.9 2008: R+5.8
Not yet ingested
- Civics
- —
Market trends
- HPI YoY
- ▼ -14.76%
- Current HPI
- 251.638
- Rent YoY
- —
- Metro
- —
- State GDP YoY
- ▲ 2.97%
- F500 in state
- 12
Industry mix (Fortune 500 HQ in MD)
| Industry | F500 HQs | Revenue |
|---|---|---|
| Aerospace / Defense | 1 | $71B |
|
||
| Utilities | 1 | $25B |
|
||
| Hotels | 1 | $24B |
|
||
| Consumer Goods | 1 | $7B |
|
||
| Real Estate | 1 | $6B |
|
||
| Chemicals | 1 | $2B |
|
||
Price history
+145.9% since first listed9 events — show timeline
- 2026-04-28 Listed $135,000 BRIGHT MLS
- 2011-09-19 Sold (MLS) $11,000 BRIGHT MLS
- 2010-10-01 Listed $36,000 BRIGHT MLS
- 2010-01-01 Delisted — MRIS
- 2010-01-01 Listing Removed — BRIGHT MLS
- 2009-12-31 Listing Removed — BRIGHT MLS
- 2009-08-03 Listed — MRIS
- 2009-08-03 Listed $54,900 BRIGHT MLS
- 2009-03-11 Listed $54,900 BRIGHT MLS
Property tax history
+2.1%/yrLatest (2025): $585 · -0.8% YoY. Source: county tax records.
Cash-flow waterfall
monthlySold comps — $/sqft
last 12 mo · ≤1 miLoading sold comps…