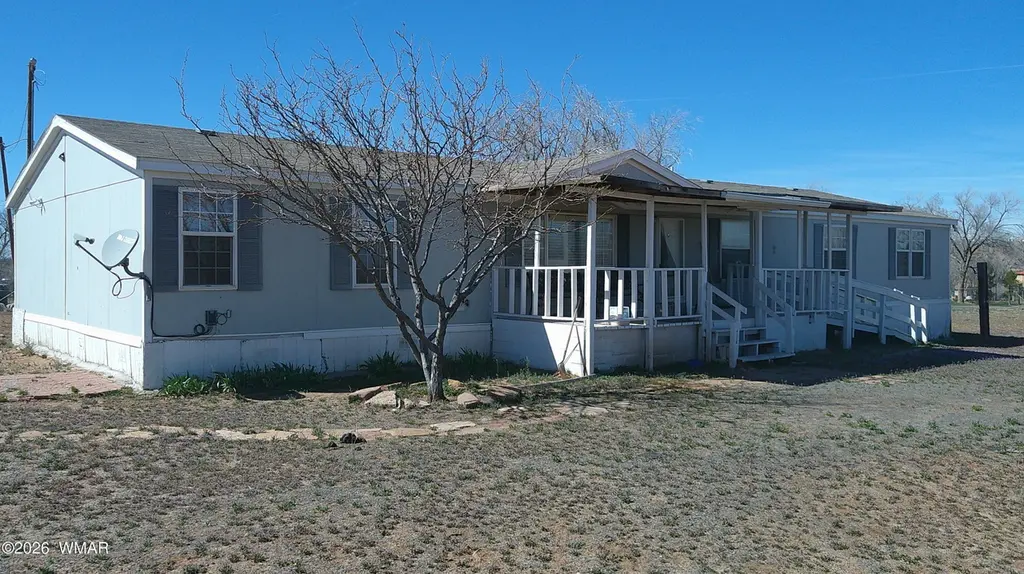
48 County Road 7242 · Sanders, AZ
Flood risk 1/10 · Minimal
- FEMA flood zone
- D
- Chance of flooding over 30 yrs
- 0.0%
- Est. flood insurance / yr
- $544 – $1,084
Fire risk 5/10 · Moderate
- Est. fire insurance / yr
- $610 – $1,132
Heat risk 4/10 · Minor
- Hot days now (above 93°F)
- 7 days/yr
- Hot days in 30 yrs
- 19 days/yr
Wind risk 1/10 · Minimal
- Chance of severe wind over 30 yrs
- —
Air-quality risk 1/10 · Minimal
- Unhealthy air days now
- 0 days/yr
- Unhealthy air days in 30 yrs
- 0 days/yr
Risk factors via First Street. Map © Google.
Why this score? — see what drove the F grade
The composite is a weighted blend of 9 inputs, each scored 0–100. Each bar is that input's sub-score; the figure is the points it added to the 100-point composite (weight × sub-score).
- ARV discount +7.5/15.0
- Cash flow +6.5/30.0
- Appreciation +5.0/10.0
- Livability +2.8/5.0
- Rent growth +2.5/5.0
- Condition / age +2.5/5.0
- 1% rule +1.6/10.0
- DSCR +0.7/10.0
- Schools +0.4/10.0
$165,000
🖨 Deal sheet (PDF) 📄 Offer letter ✓ Due diligence
Listing remarks
4 bed 2 bath home on 1.15ac lot in the heart of Sanders! This split floor plan home offers tons of space for a large family! Huge family room with fire place. Wide open kitchen/dining room with island, great for entertaining guests or big family dinners. Power, water, spetic and propane all set up and ready! Large Hogan style building with power and fireplace in it also offers extra storage. Tons of room to add on or build, park the RV or other vehicles. Easy access right off paved road and right off of the I-40 for easy travel! Great location! Investor or handyman special!
Key facts
- 1.15 acre lot
- Built 2001
- Listed 54 days
Property features AI
Finance
- Other: Approximately 1.15 acres; County road maintenance; Suitable for raising horses; Property adjoins private land; Directions: From Sanders, off of Main St. (Hwy 191), go east on Sun Ln approx. 0.45 mi; property on the right.
- HOA & community: No HOA; Located in Arizona Park Estates neighborhood
Exterior
- Parking: Street access (paved)
- Utilities: Septic tank; Bottled gas and propane available; propane tank owned; Individual electric meter; Metered water; Solid separation tank; Power available
- Home design: Manufactured / Mobile home; Double wide; One story; Property faces private area; Zoned AG-Gen
- Construction: Manufactured construction; Pitched shingle roof; Double wide mobile home
- Exterior features: Deck; Covered deck; Utility building; Paved street; Corners marked; Wire fence; Trees on property
Interior
- Kitchen: Built-in dishwasher; Electric range; Breakfast bar; Eat-in kitchen / kitchen-dining room combo; Living-dining room combo
- Bedrooms: Includes a potential bedroom
- Flooring: Carpet; Linoleum
- Bathrooms: Full bath with shower and tub / tub-shower combination
- Heating & cooling: Forced air heating; Central air conditioning; Electric water heater (over 30 gallons)
- Interior features: Fireplace; Great room; Potential bedroom
- Laundry & utility: Laundry in hallway; Utility room
Neighborhood map
What this means for you Summary
Snapshot
- This is a 4-bed/2.0-bath manufactured listed at $165k.
Deal economics
- At list price, monthly cash flow is $-282 ($-3k/yr) — negative.
- To cash-flow at today's rent, offer at most $124k (24.7% below list).
- To meet the 1% rule (rent ≥ 1% of price), the offer needs to be $109k (34.1% below list).
- Recommended offer: $109k (34.1% below list) — sets the bar for 1% rule.
Location & tenants
- Location reads 56/100 on livability (#244 in AZ) — a working-class tenant base; expect higher turnover. Strengths: cost of living A+; Watch: health & safety C-, housing D, crime F.
- Sanders Unified District (4156) (rural): math 3% / reading 9% proficiency, ranked #243 of 249 in AZ (top 98%) — low school quality limits family demand, transient renter base, plan for 1-2y turnover; 82% free/reduced lunch — lower-income household profile, screen leases tightly.
- Zoned schools: Sanders Elementary School (math 2% / reading 12%, grade F, #1,064 of 1,109 statewide, top 97%, 247 students, 83% FRL); Sanders Middle School (math 2% / reading 8%, grade F, #214 of 218 statewide, top 100%, 166 students, 87% FRL); Valley High School (math 5% / reading 5%, grade F, #364 of 381 statewide, top 100%, 203 students, 82% FRL) — zoned schools at 84% FRL track the district average.
- Market conditions: 28 active listings in the ZIP; 99 units permitted in Apache County in 2024 (0 in 5+ unit buildings).
Forward outlook
- In year one you build about $6k of equity ($1k loan paydown + $5k appreciation (3.0% local appreciation)).
- Apache County population projected at -12% by 2050 — secular population decline; favor cash flow + early exit over multi-decade hold.
- By year 6, paydown + projected appreciation supports a ~$32k cash-out refi (75% LTV) — recoverable capital for the next deal without selling this one.
Negotiation context
- It's been on market 55 days — a 3% lower offer ($160k) is reasonable based on typical stale-listing flexibility.
Risks & watch-outs
- Climate carrying-cost: moderate wildfire risk — expect insurance premiums to compound above CPI over the hold.
Questions for the listing agent
- What do current leases actually rent for vs. the listed asking? Can we see a recent rent roll and the last 12 months of T-12 income?
- It's been on market 55 days. Have you received any prior offers? Is the seller open to a 34% concession, seller financing, or rate buy-down credit?
- Is there a deadline driving the sale (1031 exchange, divorce, estate, relocation)? That informs how much negotiation room exists.
- Schools are F-rated, which usually means shorter tenancies and higher turnover. Who's the typical renter profile here, and what's been the actual vacancy rate?
- Crime grade is F in this area — have there been break-ins, vandalism, or insurance claims at this property in the last 3 years? What carrier currently insures it and at what premium?
- The area grade is low — what's the realistic commute time and amenity access for the typical tenant pool here? Any planned neighborhood developments (good or bad) we should know about?
- What's the average days-on-market for RENTAL listings here right now (not sales)? A rising rental-DOM trend means longer vacancies and softer asking-rent achievability than the comps imply.
- What's the recent tenant-quality profile in this submarket — average credit score on applications, eviction rate, late-payment / NSF rate, and stable-employment percentage? A property-management company in the area should have these aggregated.
- How much new for-sale + rental construction is in the pipeline within 1–3 miles? Heavy new supply typically softens prices + rents 12–24 months out; constrained supply supports both.
Investment metrics
- 1% rule
- 0.66% ✗
- Cap rate
- 4.24%
- Cash-on-cash
- -7.32%
- DSCR
- 0.67
- GRM
- 12.7
CMA / ARV
No comps found within radius.
Projected returns pro-forma
3.0% appreciation · 3.0% rent growth · sell at horizon
- IRR
- 0.7%
- Equity multiple
- 1.04×
- Total profit
- $1,952
- Equity at exit
- $74,191
- IRR
- 4.5%
- Equity multiple
- 1.70×
- Total profit
- $32,140
- Equity at exit
- $114,337
Cash invested: $46,200 (down + closing). Projections, not guarantees.
Landlord ↔ Tenant lean methodology
- Overall (STATE)
- 87 Strongly Landlord-Friendly
- State Arizona
- 87 Strongly Landlord-Friendly · R+3
- County
- — inherits STATE
- City
- — inherits STATE
ZIP-level market 86512
- Active inventory
- 28
- Price-to-rent
- 12.7×
Monthly cashflow live
- Estimated rent
- $1,087 medium interval (Pro) →
- Mortgage (P&I)
- −$865
- Tax est. 1.5%
- −$206 /mo · $2,475/yr
- Insurance
- −$69
- HOA
- −$0
- Vacancy / Maint / Mgmt
- −$228
- Net cashflow
- $-282
Break-even live
Sensitivity live
| Price | -10% $-168 | -5% $-225 | +0% $-282 | +5% $-339 | +10% $-396 |
|---|---|---|---|---|---|
| Rent | -10% $-368 | -5% $-325 | +0% $-282 | +5% $-239 | +10% $-196 |
| Rate | -1.0pp $-199 | -0.5pp $-240 | base $-282 | +0.5pp $-324 | +1.0pp $-368 |
UW: 25.0% down · 7.5% · 30yr · 1.5% tax · 5.0% vac · 8.0% maint · 8.0% mgmt
Financing live
Cash to close
- Down payment
- $41,250
- Closing costs
- $4,950
- Reserves months
- —
- Total cash needed
- —
Loan-product check · same deal, 3 products live
Conventional
25% down · 7.5% · 30yr
- Down + closing
- —
- Monthly P&I
- —
- Monthly cashflow
- —
- DSCR
- —
- Eligible?
- —
Personal DTI + credit; lowest rate.
DSCR
20% down · 8.5% · 30yr
- Down + closing
- —
- Monthly P&I
- —
- Monthly cashflow
- —
- DSCR
- —
- Eligible?
- —
No personal income docs; deal must DSCR.
Hard money
10% down · 12.0% · 12mo
- Down + closing
- —
- Monthly P&I
- —
- Monthly cashflow
- —
- DSCR
- —
- Eligible?
- —
Short-term bridge; refi at stabilization.
Listing history 19 events
-
2026-06-22days on market $165,000 Active 55 DOM
-
2026-06-21days on market $165,000 Active 54 DOM
-
2026-06-19days on market $165,000 Active 52 DOM
-
2026-06-18days on market $165,000 Active 51 DOM
-
2026-06-17days on market $165,000 Active 50 DOM
-
2026-06-16days on market $165,000 Active 49 DOM
-
2026-06-15days on market $165,000 Active 48 DOM
-
2026-06-14days on market $165,000 Active 46 DOM
-
2026-06-12days on market $165,000 Active 45 DOM
-
2026-06-09days on market $165,000 Active 42 DOM
-
2026-06-08days on market $165,000 Active 41 DOM
-
2026-06-07days on market $165,000 Active 40 DOM
-
2026-06-07days on market $165,000 Active 39 DOM
-
2026-06-04days on market $165,000 Active 36 DOM
-
2026-06-02days on market $165,000 Active 35 DOM
-
2026-06-01days on market $165,000 Active 34 DOM
-
2026-05-31days on market $165,000 Active 33 DOM
-
2026-05-31days on market $165,000 Active 32 DOM
-
2026-04-29$165,000 Active 580-char remark
ⓘ Source: listings_history table (triggers on properties + properties_extension) + one-shot
backfill from property_details.listing_events for pre-trigger history.
Climate risk First Street
- Flood 1/10 Low FEMA zone D · 0% chance over 30 yrs
- Wildfire 5/10 Major
- Heat 4/10 Moderate 7 d/yr ≥93°F today · 19 d/yr by 30 yrs out
- Wind 1/10 Low
- Air quality 1/10 Low 0 unhealthy d/yr today · 0 by 30 yrs out
Nearby sold comps map
Loading sold comps map…
Walkable amenities ~0.75 mi
Loading nearby amenities…
Taxation est. · year 1
- Rental income
- $13,042
- − Mortgage interest
- −$9,243
- − Property taxes
- −$2,475
- − Insurance
- −$825
- − Repairs & maintenance
- −$1,043
- − Management
- −$1,043
- − Depreciation
- −$4,800
- Taxable loss
- −$6,388
- Est. tax savings @ 24.0%
- +$1,533
- After-tax cash flow
- $-1,847/yr
For passive investors: Depreciation is non-cash, so a rental often shows a tax loss while cash-flowing — sheltering income. Rental losses are passive: they offset passive income freely, and up to $25,000/yr can offset ordinary (W-2) income if you actively participate and your MAGI is under $100k (phasing out to $0 by $150k); unused losses carry forward. On sale, claimed depreciation is recaptured at up to 25%, and gains may owe capital-gains tax (a 1031 exchange can defer both). Figures are a year-1 estimate at your 24.0% rate — not tax advice; consult a CPA.
Schools (NCES district)
- District
- Sanders Unified District (4156)
- NCES district ID
- 0406740
- Math proficiency
- 3% ▼ -10.00%
- Reading proficiency
- 9% ▼ -6.00%
- Median HH income
- $22,360
- Composite
- 3.65/100
- National rank
- #10070
- State rank
- #243 of 249 in AZ
Livability — Sanders
- Score
- 56/100
- State rank
- #244
- US rank
- #22668
Category grades
Schools grade is shown separately in the Schools card above.
Census & demographics
- Census place
- Sanders, AZ
- Population (ZIP)
- 2,391
Population outlook (Apache County) Hauer SSP2
- Today (2025)
- 70,338 people
- By 2030
- 69,279 · -1.5%
- By 2040
- 66,449 · -5.5%
- By 2050
- 61,904 · -12.0%
- By 2075
- 47,639 · -32.3%
- By 2100
- 30,279 · -57.0%
Race, ethnicity, and origin ACS 2023
- Neighborhood character
- Highly diverse neighborhood (Simpson 1.00)
- Race & ethnicity
- Native American 94% Two or more races 3% Hispanic / Latino 3% White 2%
- Foreign-born
- 0%
- Languages at home
- 36% English-only · Spanish 1%
Political lean MEDSL · Apache
- 2024 margin
- D (+19.0) · D 58.9% · R 40.0% · Other 1.1%
- 2008→2024 swing
- -9.2pp toward R · 2008: 28.2pp · 2024: 19.0pp
- All cycles
- 2024: D+19.0 2020: D+33.7 2016: D+36.9 2012: D+33.9 2008: D+28.2
Not yet ingested
- Civics
- —
Market trends
- HPI YoY
- —
- Current HPI
- —
- Rent YoY
- —
- Metro
- —
- State GDP YoY
- ▲ 4.54%
- F500 in state
- 20
Industry mix (Fortune 500 HQ in AZ)
| Industry | F500 HQs | Revenue |
|---|---|---|
| Technology | 2 | $13B |
|
||
| Mining / Metals | 1 | $23B |
|
||
| Environmental Services | 1 | $16B |
|
||
| Metals / Steel | 1 | $14B |
|
||
| Technology Distribution | 1 | $9B |
|
||
| Homebuilding | 1 | $8B |
|
||
Price history
1 event — show timeline
- 2026-04-29 Listed $165,000 WMMLS
Property tax history
-8.7%/yrLatest (2025): $197 · +8.0% YoY. Source: county tax records.
Cash-flow waterfall
monthlySold comps — $/sqft
last 12 mo · ≤1 miLoading sold comps…