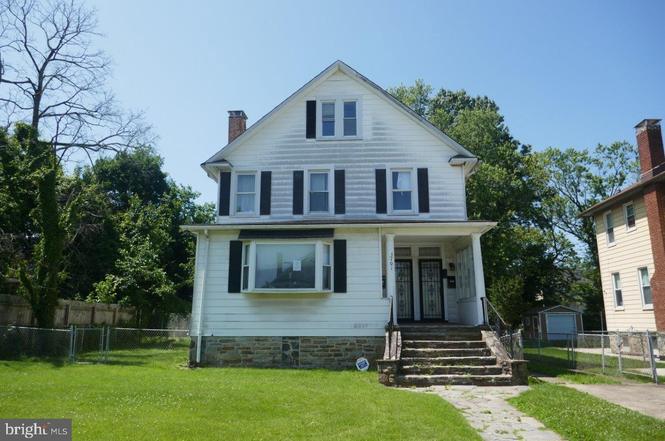
3701 Barrington Rd · Baltimore, MD
Flood risk 1/10 · Minimal
- FEMA flood zone
- X (unshaded)
- Chance of flooding over 30 yrs
- 0.0%
- Est. flood insurance / yr
- $473 – $860
Fire risk 1/10 · Minimal
- Est. fire insurance / yr
- $755 – $1,403
Heat risk 7/10 · Major
- Hot days now (above 104°F)
- 7 days/yr
- Hot days in 30 yrs
- 15 days/yr
Wind risk 5/10 · Moderate
- Chance of severe wind over 30 yrs
- 23.0%
Air-quality risk 3/10 · Minor
- Unhealthy air days now
- 3 days/yr
- Unhealthy air days in 30 yrs
- 4 days/yr
Risk factors via First Street. Map © Google.
Why this score? — see what drove the B- grade
The composite is a weighted blend of 9 inputs, each scored 0–100. Each bar is that input's sub-score; the figure is the points it added to the 100-point composite (weight × sub-score).
- Cash flow +30.0/30.0
- 1% rule +10.0/10.0
- DSCR +10.0/10.0
- ARV discount +7.5/15.0
- Livability +3.8/5.0
- Rent growth +3.1/5.0
- Condition / age +2.5/5.0
- Schools +1.0/10.0
- Appreciation +0.0/10.0
$187,150
🖨 Deal sheet 📄 Offer letter ✓ Due diligence
Listing remarks
What an opportunity to invest and an excellent income opportunity - live in one unit and rent the 2nd unit for income or investor rental dwelling. The main level features the first unit which consist of a living room, den, kitchen, 1 bedroom and 1 bath and basement access, which also has a half bath. This unit also offers a very large deck. Unit 2 consist of both the 2nd level and 3rd level and this unit features multiple bedrooms (4-5) and 2 full baths along with a very spacious balcony. Outside, the large yard invites relaxation and outdoor activities, while the detached garage provides convenient off-street parking and additional storage options. Located on a serene lot, this property co
Key facts
- Large deck
- Serene lot
- Spacious balcony
Tags
Neighborhood map
What this means for you Summary
Snapshot
- This is a 6-bed/3.5-bath single-family listed at $187k.
Deal economics
- At list price, monthly cash flow is $1k ($12k/yr) — positive.
- The deal already cash-flows at list — no discount required.
- Meets the 1% rule at list price ($3k rent vs $187k).
- Recommended offer: $176k (6.0% below list) — sets the bar for market timing.
- Cap rate 12.8% vs local median 6.0% in Baltimore — top-decile yield for the area; either an underpriced asset or a hidden risk that comps aren't pricing in. Stress-test before assuming the spread holds.
Location & tenants
- Location reads 76/100 on livability (#90 in MD, #3,396 nationally) — a middle-class / working-renter tenant base. Strengths: amenities A+, commute A+, housing A+; Watch: schools D, crime F.
- Baltimore City Public Schools (urban): math 7% / reading 16% proficiency, ranked #24 of 24 in MD (top 100%) — low school quality limits family demand, transient renter base, plan for 1-2y turnover; 79% free/reduced lunch — lower-income household profile, screen leases tightly.
- Market conditions: Rents rising (+2.4%/yr); 351 active listings in the ZIP; 2 comparable units currently listed for rent nearby; 1,273 units permitted in Baltimore city in 2024 (1,104 in 5+ unit buildings).
- At $2,915/mo this rent would consume 68% of the median local household income ($52k/yr) (locally 3644% of renters already pay >50% of income on rent) — very limited rent-growth headroom before tenants either downsize or default.
Forward outlook
- Local home prices are declining (-3.0%/yr); year-one equity from $1k of loan paydown is wiped out by about $6k of value loss. Plan a longer hold.
- Baltimore County population projected to shrink 4% by 2050 — rents likely to lag national; underwrite the cash flow, not the appreciation.
- At projected returns (-3.0% appreciation + 2.4% rent growth), your $52k cash investment doubles in ~6 years — after that, you're playing with house money.
Negotiation context
- It's been on market 78 days — a 6% lower offer ($176k) is reasonable based on typical stale-listing flexibility.
- 5 sale attempts since 19y ago; this cycle's ask has dropped $10k (5%) from the opening price — seller is motivated, your offer sets the floor, not the list.
Risks & watch-outs
- Watch-outs: built in 1921 — expect roof / HVAC / electrical / plumbing capex.
- Climate carrying-cost: moderate wind risk, 23% chance of damaging wind over 30y; extreme-heat days projected 7→15/yr by 2055 (HVAC capex compounding) — expect insurance premiums to compound above CPI over the hold.
Questions for the listing agent
- It's been on market 78 days. Have you received any prior offers? Is the seller open to a 6% concession, seller financing, or rate buy-down credit?
- Built in 1921 — when were the roof, HVAC, electrical panel, plumbing, and water heater last replaced?
- Why hasn't it sold? Are there any deal-killer items the seller is aware of (foundation, flood, title, zoning, code violations)?
- Is there a deadline driving the sale (1031 exchange, divorce, estate, relocation)? That informs how much negotiation room exists.
- Schools are D-rated, which usually means shorter tenancies and higher turnover. Who's the typical renter profile here, and what's been the actual vacancy rate?
- Crime grade is F in this area — have there been break-ins, vandalism, or insurance claims at this property in the last 3 years? What carrier currently insures it and at what premium?
- What's the average days-on-market for RENTAL listings here right now (not sales)? A rising rental-DOM trend means longer vacancies and softer asking-rent achievability than the comps imply.
- What's the recent tenant-quality profile in this submarket — average credit score on applications, eviction rate, late-payment / NSF rate, and stable-employment percentage? A property-management company in the area should have these aggregated.
- How much new for-sale + rental construction is in the pipeline within 1–3 miles? Heavy new supply typically softens prices + rents 12–24 months out; constrained supply supports both.
Investment metrics
- 1% rule
- 1.56% ✓
- Cap rate
- 12.83%
- Cash-on-cash
- 23.35%
- DSCR
- 2.04
- GRM
- 5.4
CMA / ARV
- ARV (on-the-fly)
- $407,924
- Comps found
- 12
Show comp detail 12 sales within ~0.75 mi
| Address | Dist | Beds/Ba | Sqft | Sold | Price | $/sf | Match |
|---|---|---|---|---|---|---|---|
| 3904 Belle Ave | 0.29mi | 6/4.0 | 2,802 (+0%) | 8mo | $155,000 | $55 | 78 |
| 3415 Springdale Ave | 0.51mi | 6/3.5 | 2,737 (-2%) | 2mo | $443,500 | $162 | 71 |
| 3910 Chatham Rd | 0.35mi | 6/5.0 | 2,800 (+0%) | 9mo | $490,000 | $175 | 70 |
| 3923 Fairview Ave | 0.58mi | 5/3.0 (-1) | 2,788 (-0%) | 1mo | $360,000 | $129 | 65 |
| 3703 Egerton Rd | 0.21mi | 5/4.5 (-1) | 3,051 (+9%) | 3mo | $479,900 | $157 | 63 |
| 3714 W Cold Spring Ln | 0.38mi | 5/3.0 (-1) | 2,566 (-8%) | 6mo | $318,000 | $124 | 57 |
| 3816 Sequoia Ave | 0.21mi | 5/2.5 (-1) | 2,382 (-15%) | 3mo | $169,900 | $71 | 54 |
| 2912 Allendale Rd | 0.65mi | 5/3.0 (-1) | 2,858 (+2%) | 7mo | $349,900 | $122 | 53 |
| 3911 Chatham Rd | 0.34mi | 5/2.5 (-1) | 2,407 (-14%) | 5mo | $370,000 | $154 | 47 |
| 4403 White Oak Ave | 0.52mi | 5/3.0 (-1) | 2,498 (-11%) | 7mo | $365,000 | $146 | 46 |
| 3514 Fairview Ave | 0.49mi | 5/4.5 (-1) | 3,143 (+12%) | 2mo | $515,000 | $164 | 45 |
| 4300 Springdale Ave | 0.73mi | 7/2.0 (+1) | 2,729 (-2%) | 7mo | $220,000 | $81 | 45 |
Match score weights: distance 35% · size 25% · config 20% · recency 20%. Top-matched comps best support the ARV.
Projected returns pro-forma
-3.0% appreciation · 2.41% rent growth · sell at horizon
- IRR
- 15.8%
- Equity multiple
- 1.63×
- Total profit
- $32,943
- Equity at exit
- $27,905
- IRR
- 24.0%
- Equity multiple
- 3.01×
- Total profit
- $105,499
- Equity at exit
- $16,181
Cash invested: $52,402 (down + closing). Projections, not guarantees.
Landlord ↔ Tenant lean methodology
- Overall (CITY)
- 12 Strongly Tenant-Friendly
- State Maryland
- 27 Tenant-Leaning · D+14
- County
- — inherits STATE
- City Baltimore
- 12 Strongly Tenant-Friendly · D+58
ZIP-level market 21215
- Rents YoY
- 2.4%
- Active inventory
- 351
- Price-to-rent
- 5.4×
Monthly cashflow live
- Estimated rent
- $2,915 medium interval (Pro) →
- Mortgage (P&I)
- −$981
- Tax from tax record
- −$224 /mo · $2,684/yr
- Insurance
- −$78
- HOA
- −$0
- Vacancy / Maint / Mgmt
- −$612
- Net cashflow
- $1,020
Break-even live
UW: 25.0% down · 7.5% · 30yr · 1.5% tax · 5.0% vac · 8.0% maint · 8.0% mgmt
Financing live
Cash to close
- Down payment
- $46,788
- Closing costs
- $5,614
- Reserves months
- —
- Total cash needed
- —
Loan-product check · same deal, 3 products live
Conventional
25% down · 7.5% · 30yr
- Down + closing
- —
- Monthly P&I
- —
- Monthly cashflow
- —
- DSCR
- —
- Eligible?
- —
Personal DTI + credit; lowest rate.
DSCR
20% down · 8.5% · 30yr
- Down + closing
- —
- Monthly P&I
- —
- Monthly cashflow
- —
- DSCR
- —
- Eligible?
- —
No personal income docs; deal must DSCR.
Hard money
10% down · 12.0% · 12mo
- Down + closing
- —
- Monthly P&I
- —
- Monthly cashflow
- —
- DSCR
- —
- Eligible?
- —
Short-term bridge; refi at stabilization.
Rent comps 2 comps
| Address | Beds | Baths | Sqft | Rent | $/sqft | DOM | Units | Dist |
|---|---|---|---|---|---|---|---|---|
| 4029 Fairview Ave Baltimore, MD | 5.0 | 4.5 | 2653 | $3,200 | $1.21 | 44d | 1 | 0.65mi |
| 2510 Roslyn Ave Baltimore, MD | 6.0 | 5.0 | 2663 | $4,200 | $1.58 | 44d | 1 | 0.89mi |
Listing history 16 events
-
2026-01-08status Pending
-
2025-11-18price $187,150
-
2025-11-08status Active
-
2025-10-13status Pending
-
2025-09-26$197,000 Active
-
2025-07-29historical
-
2025-07-07$197,000 Active
-
2024-03-11status Pending
-
2024-03-11historical
-
2024-01-19historical Active Under Contract
-
2024-01-15$187,990 Active
-
2007-06-21soldstatus $185,000
-
2007-05-21soldstatus $185,000
-
2007-05-10soldstatus $185,000
-
2007-03-28historical
-
2007-03-21$185,000
ⓘ Source: listings_history table (triggers on properties + properties_extension) + one-shot
backfill from property_details.listing_events for pre-trigger history.
Tax reassessment forecast MD · Partial reset (capped growth)
- Current annual tax
- $2,684 · $224/mo
- Projected year-2 tax
- $2,684 · $224/mo
- Expected delta
- $0/yr ($0/mo · 0.0%)
ⓘ Screening estimate from a state-policy table — verify with the county assessor before closing.
Climate risk First Street
- Flood 1/10 Low FEMA zone X (unshaded) · 0% chance over 30 yrs
- Wildfire 1/10 Low
- Heat 7/10 Severe 7 d/yr ≥104°F today · 15 d/yr by 30 yrs out
- Wind 5/10 Major 23% chance of damaging wind over 30 yrs
- Air quality 3/10 Moderate 3 unhealthy d/yr today · 4 by 30 yrs out
Nearby sold comps map
Loading sold comps map…
Walkable amenities ~0.75 mi
Loading nearby amenities…
Taxation est. · year 1
- Rental income
- $34,980
- − Mortgage interest
- −$10,483
- − Property taxes
- −$2,684
- − Insurance
- −$936
- − Repairs & maintenance
- −$2,798
- − Management
- −$2,798
- − Depreciation
- −$5,444
- Taxable income
- $9,836
- Est. tax owed @ 24.0%
- −$2,361
- After-tax cash flow
- $9,877/yr
For passive investors: Depreciation is non-cash, so a rental often shows a tax loss while cash-flowing — sheltering income. Rental losses are passive: they offset passive income freely, and up to $25,000/yr can offset ordinary (W-2) income if you actively participate and your MAGI is under $100k (phasing out to $0 by $150k); unused losses carry forward. On sale, claimed depreciation is recaptured at up to 25%, and gains may owe capital-gains tax (a 1031 exchange can defer both). Figures are a year-1 estimate at your 24.0% rate — not tax advice; consult a CPA.
Schools (NCES district)
- District
- Baltimore City Public Schools
- NCES district ID
- 2400090
- Math proficiency
- 7% ▼ -9.00%
- Reading proficiency
- 16% ▼ -5.00%
- Median HH income
- $42,108
- Composite
- 10.08/100
- National rank
- #9805
- State rank
- #24 of 24 in MD
Livability — Baltimore
- Score
- 76/100
- State rank
- #90
- US rank
- #3396
Category grades
Schools grade is shown separately in the Schools card above.
Census & demographics
- Census place
- Baltimore, MD
- County
- Baltimore City · 558,601 people
- City population
- 588,727
- Metro
- Baltimore-Columbia-Towson, MD
- Population (ZIP)
- 52,229
- Household income
- $51,587
- Rent vs Own
- Severe rent burden
- 3644.0
Population outlook (Baltimore County) Hauer SSP2
- Today (2025)
- 624,249 people
- By 2030
- 621,541 · -0.4%
- By 2040
- 609,756 · -2.3%
- By 2050
- 597,249 · -4.3%
- By 2075
- 552,236 · -11.5%
- By 2100
- 513,934 · -17.7%
Race, ethnicity, and origin ACS 2023
- Neighborhood character
- Predominantly Black (73%)
- Race & ethnicity
- Black 73% White 17% Hispanic / Latino 5% Two or more races 4% Asian 1%
- Common ancestry
- Scotch-Irish 2% Romanian 2% Italian 1%
- Foreign-born
- 9% · Canada, South Korea
- Languages at home
- 91% English-only · Spanish 4% French/Haitian/Cajun 1% Other Indo-European 1%
Political lean MEDSL · Baltimore
- 2024 margin
- Solid D (+73.0) · D 85.2% · R 12.2% · Other 2.6%
- 2008→2024 swing
- -2.5pp toward R · 2008: 75.5pp · 2024: 73.0pp
- All cycles
- 2024: D+73.0 2020: D+76.6 2016: D+74.6 2012: D+76.4 2008: D+75.5
Not yet ingested
- Civics
- —
Market trends
- HPI YoY
- ▼ -318.58%
- Current HPI
- 291.4926
- Rent YoY
- ▲ 2.41%
- Metro
- Baltimore-Columbia-Towson, MD
- State GDP YoY
- ▲ 2.97%
- F500 in state
- 12
Industry mix (Fortune 500 HQ in MD)
| Industry | F500 HQs | Revenue |
|---|---|---|
| Aerospace / Defense | 1 | $71B |
|
||
| Utilities | 1 | $25B |
|
||
| Hotels | 1 | $24B |
|
||
| Consumer Goods | 1 | $7B |
|
||
| Real Estate | 1 | $6B |
|
||
| Chemicals | 1 | $2B |
|
||
Price history
+1.2% since first listed16 events — show timeline
- 2026-01-08 Pending — BRIGHT MLS
- 2025-11-18 Price Changed $187,150 BRIGHT MLS
- 2025-11-08 Relisted — BRIGHT MLS
- 2025-10-13 Pending — BRIGHT MLS
- 2025-09-26 Listed $197,000 BRIGHT MLS
- 2025-07-29 Listing Removed — BRIGHT MLS
- 2025-07-07 Listed $197,000 BRIGHT MLS
- 2024-03-11 Pending — BRIGHT MLS
- 2024-03-11 Listing Removed — BRIGHT MLS
- 2024-01-19 Contingent — BRIGHT MLS
- 2024-01-15 Listed $187,990 BRIGHT MLS
- 2007-06-21 Sold (Public Records) $185,000 Public Records
- 2007-05-21 Sold (Public Records) $185,000 Public Records
- 2007-05-10 Sold (MLS) $185,000 MRIS
- 2007-03-28 Delisted — MRIS
- 2007-03-21 Listed $185,000 MRIS
Property tax history
-2.6%/yrLatest (2025): $2,684 · -47.2% YoY. Source: county tax records.
Cash-flow waterfall
monthlySold comps — $/sqft
last 12 mo · ≤1 miLoading sold comps…