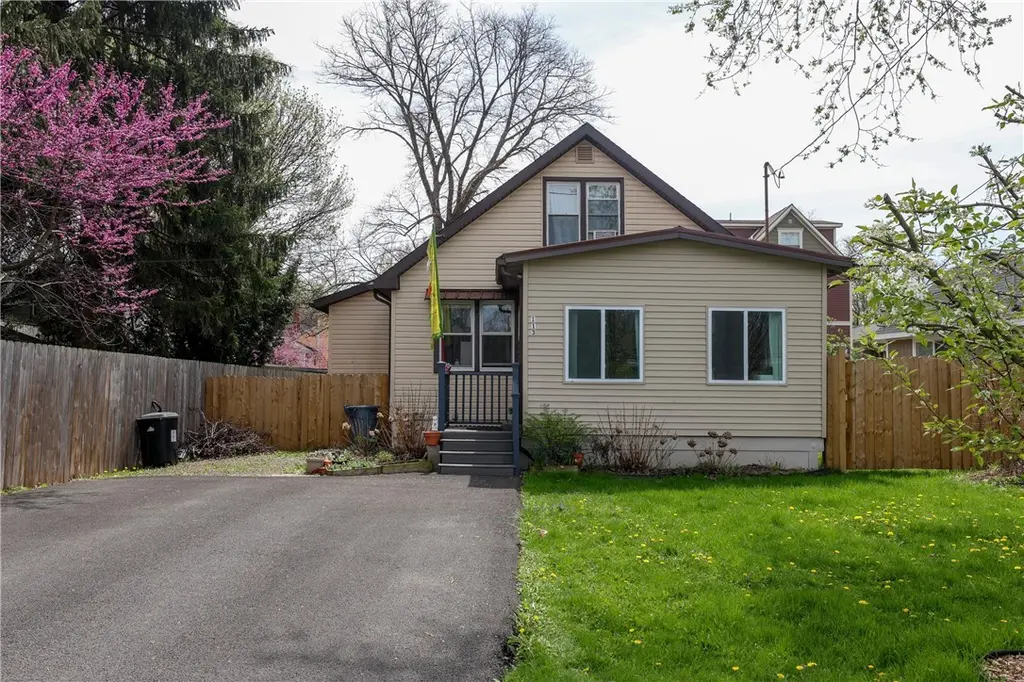
113 W York St · Ithaca, NY
Flood risk 9/10 · Severe
- FEMA flood zone
- X (shaded)
- Chance of flooding over 30 yrs
- 0.99%
- Est. flood insurance / yr
- $473 – $860
Fire risk 1/10 · Minimal
- Est. fire insurance / yr
- $691 – $1,283
Heat risk 3/10 · Minor
- Hot days now (above 94°F)
- 7 days/yr
- Hot days in 30 yrs
- 16 days/yr
Wind risk 1/10 · Minimal
- Chance of severe wind over 30 yrs
- 1.0%
Air-quality risk 2/10 · Minimal
- Unhealthy air days now
- 0 days/yr
- Unhealthy air days in 30 yrs
- 1 days/yr
Risk factors via First Street. Map © Google.
Why this score? — see what drove the B- grade
The composite is a weighted blend of 9 inputs, each scored 0–100. Each bar is that input's sub-score; the figure is the points it added to the 100-point composite (weight × sub-score).
- Cash flow +21.9/30.0
- ARV discount +15.0/15.0
- DSCR +7.0/10.0
- 1% rule +5.9/10.0
- Schools +5.4/10.0
- Livability +3.9/5.0
- Rent growth +3.8/5.0
- Condition / age +2.5/5.0
- Appreciation +0.0/10.0
$335,000
🖨 Deal sheet 📄 Offer letter ✓ Due diligence
Listing remarks MLS
Lovely quaint Cape Cod on the north end of Fall Creek. Short walk to IHS, restaurants/dining, Ithaca Falls, Science Center and Stewart Park. Convenient to bus routes, walk to commons and shopping. Private deck with functioning hot tub. Dry basement, block foundation, cement floor-unusual bonus in Fall Creek neighborhood.
Key facts
- Local restaurants
- Off-street parking
- Ithaca falls
Tags
Property features AI
Exterior
- Parking: No garage
- Utilities: Public water connected; Sewer connected
- Home design: Single-story; Existing structure; Resale property
- Construction: Poured foundation; Vinyl siding; Insulated attic/crawl hatchway(s)
- Exterior features: Blacktop driveway; Deck; Shed(s); Exterior storage
Interior
- Kitchen: Gas range; Gas oven; Refrigerator
- Bedrooms: One main-level bedroom
- Flooring: Carpet; Vinyl; Varied flooring
- Bathrooms: One full bathroom; One half bathroom; Two main-level bathrooms
- Heating & cooling: Gas heating; Baseboard heating; Hot water heating; Window air conditioning unit(s)
- Interior features: Ceiling fan(s); Bedroom on main level; Other interior features (see remarks)
- Laundry & utility: Washer; Dryer; Gas water heater
Neighborhood map
What this means for you Summary
Snapshot
- This is a 3-bed/1.5-bath single-family listed at $335k.
Deal economics
- At list price, monthly cash flow is $472 ($6k/yr) — positive.
- The deal already cash-flows at list — no discount required.
- Meets the 1% rule at list price ($4k rent vs $335k).
- Recommended offer: $325k (3.0% below list) — sets the bar for market timing.
- Cap rate 8.2% vs local median 5.3% in Ithaca — top-decile yield for the area; either an underpriced asset or a hidden risk that comps aren't pricing in. Stress-test before assuming the spread holds.
Location & tenants
- Location reads 77/100 on livability (#210 in NY, #3,240 nationally) — a middle-class / working-renter tenant base. Strengths: amenities A+, commute A+, health & safety A+; Watch: housing C-, employment D+, cost of living D.
- Ithaca City School District (urban): math 57% / reading 71% proficiency, ranked #195 of 590 in NY (top 33%) — acceptable for families but not a draw, mixed tenant base, ~2y average lease.
- Market conditions: Rents rising fast (+5.2%/yr); 327 active listings in the ZIP; 4 comparable units currently listed for rent nearby; rentals lingering (median 44d on market — plan ~5-8 weeks vacancy on turnover, expect pricing pressure); 100% of comp listings sitting > 30 days — soft ceiling on asking rent; 382 units permitted in Tompkins County in 2024 (208 in 5+ unit buildings).
- At $3,663/mo this rent would consume 62% of the median local household income ($71k/yr) (locally 5169% of renters already pay >50% of income on rent) — very limited rent-growth headroom before tenants either downsize or default.
Forward outlook
- Local home prices are declining (-3.0%/yr); year-one equity from $2k of loan paydown is wiped out by about $10k of value loss. Plan a longer hold.
- Tompkins County population projected at +17% by 2050 — long-run rental-demand tailwind backs the buy-and-hold thesis.
Negotiation context
- It's been on market 56 days — a 3% lower offer ($325k) is reasonable based on typical stale-listing flexibility.
- 2 sale attempts since 12y ago; this cycle's ask has dropped $20k (6%) from the opening price — seller is motivated, your offer sets the floor, not the list.
- Current owner paid $175k; list at $335k implies a 91% gain — meaningful room to come down on a strong offer.
Risks & watch-outs
- Watch-outs: flood insurance adds $56/mo; built in 1940 — expect roof / HVAC / electrical / plumbing capex.
- Climate carrying-cost: severe flood risk — expect insurance premiums to compound above CPI over the hold.
Questions for the listing agent
- It's been on market 56 days. Have you received any prior offers? Is the seller open to a 3% concession, seller financing, or rate buy-down credit?
- Built in 1940 — when were the roof, HVAC, electrical panel, plumbing, and water heater last replaced?
- What's the actual annual flood-insurance premium (NFIP or private), and is the property in a SFHA with mandatory coverage?
- Is there a deadline driving the sale (1031 exchange, divorce, estate, relocation)? That informs how much negotiation room exists.
- Schools are A-rated — typically a magnet for longer-tenancy family renters. What's the average tenant stay here, and is there a school-zone premium baked into asking?
- What's the average days-on-market for RENTAL listings here right now (not sales)? A rising rental-DOM trend means longer vacancies and softer asking-rent achievability than the comps imply.
- What's the recent tenant-quality profile in this submarket — average credit score on applications, eviction rate, late-payment / NSF rate, and stable-employment percentage? A property-management company in the area should have these aggregated.
- How much new for-sale + rental construction is in the pipeline within 1–3 miles? Heavy new supply typically softens prices + rents 12–24 months out; constrained supply supports both.
Investment metrics
- 1% rule
- 1.09% ✓
- Cap rate
- 8.18%
- Cash-on-cash
- 6.75%
- DSCR
- 1.30
- GRM
- 7.6
CMA / ARV
- ARV (median comp)
- $404,773
- List price
- $335,000
- Delta
- -17.24%
- Verdict
- UNDERPRICED
- Comps
- 20 within 1.0 mi
Show comp detail 12 sales within ~0.75 mi
| Address | Dist | Beds/Ba | Sqft | Sold | Price | $/sf | Match |
|---|---|---|---|---|---|---|---|
| 812 N Tioga St | 0.33mi | 3/1.5 | 1,467 (+8%) | 2mo | $465,000 | $317 | 69 |
| 205 E Falls St | 0.21mi | 4/1.5 (+1) | 1,501 (+11%) | 10mo | $407,000 | $271 | 58 |
| 115 Sears St St | 0.69mi | 2/1.5 (-1) | 1,379 (+2%) | 2mo | $160,000 | $116 | 58 |
| 117 Sears St St | 0.69mi | 2/1.5 (-1) | 1,379 (+2%) | 2mo | $160,000 | $116 | 58 |
| 836-838 N Aurora St | 0.33mi | 3/1.0 | 1,184 (-12%) | 11mo | $402,500 | $340 | 52 |
| 121 Thurston Ave | 0.62mi | 3/2.0 | 1,248 (-8%) | 6mo | $370,000 | $296 | 52 |
| 119 Sears St St | 0.68mi | 3/1.5 | 1,504 (+11%) | 2mo | $188,000 | $125 | 48 |
| 113 Sears St St | 0.70mi | 3/1.5 | 1,504 (+11%) | 2mo | $188,000 | $125 | 47 |
| 208 First St | 0.51mi | 3/2.0 | 1,488 (+10%) | 13mo | $397,000 | $267 | 46 |
| 311 Park Pl | 0.68mi | 3/2.0 | 1,248 (-8%) | 9mo | $380,000 | $304 | 46 |
| 616 Cascadilla St | 0.69mi | 3/1.0 | 1,461 (+8%) | 11mo | $345,000 | $236 | 43 |
| 107 Sears St St | 0.71mi | 3/2.0 | 1,525 (+13%) | 4mo | $240,000 | $157 | 40 |
Match score weights: distance 35% · size 25% · config 20% · recency 20%. Top-matched comps best support the ARV.
Projected returns pro-forma
-3.0% appreciation · 5.22% rent growth · sell at horizon
- IRR
- -4.4%
- Equity multiple
- 0.83×
- Total profit
- $-15,737
- Equity at exit
- $49,950
- IRR
- 7.8%
- Equity multiple
- 1.65×
- Total profit
- $61,410
- Equity at exit
- $28,965
Cash invested: $93,800 (down + closing). Projections, not guarantees.
Landlord ↔ Tenant lean methodology
- Overall (STATE)
- 15 Strongly Tenant-Friendly
- State New York
- 15 Strongly Tenant-Friendly · D+10
- County
- — inherits STATE
- City
- — inherits STATE
ZIP-level market 14850
- Rents YoY
- 5.2%
- Active inventory
- 327
- Price-to-rent
- 7.6×
Monthly cashflow live
- Estimated rent
- $3,663 medium interval (Pro) →
- Mortgage (P&I)
- −$1,757
- Tax from tax record
- −$470 /mo · $5,637/yr
- Insurance
- −$140
- Flood insurance flood zone
- −$56 /mo · $666/yr
- HOA
- −$0
- Vacancy / Maint / Mgmt
- −$769
- Net cashflow
- $472
Break-even live
UW: 25.0% down · 7.5% · 30yr · 1.5% tax · 5.0% vac · 8.0% maint · 8.0% mgmt
Financing live
Cash to close
- Down payment
- $83,750
- Closing costs
- $10,050
- Reserves months
- —
- Total cash needed
- —
Loan-product check · same deal, 3 products live
Conventional
25% down · 7.5% · 30yr
- Down + closing
- —
- Monthly P&I
- —
- Monthly cashflow
- —
- DSCR
- —
- Eligible?
- —
Personal DTI + credit; lowest rate.
DSCR
20% down · 8.5% · 30yr
- Down + closing
- —
- Monthly P&I
- —
- Monthly cashflow
- —
- DSCR
- —
- Eligible?
- —
No personal income docs; deal must DSCR.
Hard money
10% down · 12.0% · 12mo
- Down + closing
- —
- Monthly P&I
- —
- Monthly cashflow
- —
- DSCR
- —
- Eligible?
- —
Short-term bridge; refi at stabilization.
Rent comps 4 comps
| Address | Beds | Baths | Sqft | Rent | $/sqft | DOM | Units | Dist |
|---|---|---|---|---|---|---|---|---|
| 323 Taughannock Blvd Ithaca, NY | 2.0 | 1.0–2.5 | 1167 | $6,402 | $5.48 | 43d | 6 | 0.94mi |
| 430 W State St Ithaca, NY | 2.0 | 1.0–2.0 | 727 | $3,410 | $4.69 | 43d | 34 | 0.94mi |
| 127 College Ave Ithaca, NY | 3.0 | 1.0 | 958 | $2,885 | $3.01 | 43d | 1 | 1.27mi |
| 320 Hillview Pl Ithaca, NY | 2.0–3.0 | 1.0 | 800 | $2,100 | $2.62 | 43d | 4 | 1.28mi |
Listing history 21 events
-
2026-06-19days on market $335,000 Active 56 DOM
-
2026-06-18days on market $335,000 Active 55 DOM
-
2026-06-17days on market $335,000 Active 54 DOM
-
2026-06-16days on market $335,000 Active 53 DOM
-
2026-06-15days on market $335,000 Active 52 DOM
-
2026-06-14days on market $335,000 Active 50 DOM
-
2026-06-13days on market $335,000 Active 49 DOM
-
2026-06-10days on market $335,000 Active 47 DOM
-
2026-06-09days on market $335,000 Active 46 DOM
-
2026-06-08days on market $335,000 Active 45 DOM
-
2026-06-07days on market $335,000 Active 44 DOM
-
2026-06-05days on market $335,000 Active 41 DOM
-
2026-06-02days on market $335,000 Active 39 DOM
-
2026-06-01days on market $335,000 Active 38 DOM
-
2026-05-31days on market $335,000 Active 37 DOM
-
2026-05-30days on market $335,000 Active 36 DOM
-
2026-05-09price $335,000 435-char remark
-
2026-04-24$355,000 Active 435-char remark
-
2014-06-30soldstatus $175,000 322-char remark
Show marketing remark (322 chars)
Lovely quaint Cape Cod on the north end of Fall Creek. Short walk to IHS, restaurants/dining, Ithaca Falls, Science Center and Stewart Park. Convenient to bus routes, walk to commons and shopping. Private deck with functioning hot tub. Dry basement, block foundation, cement floor-unusual bonus in Fall Creek neighborhood.
-
2014-06-30soldstatus $175,000
Show marketing remark (322 chars)
Lovely quaint Cape Cod on the north end of Fall Creek. Short walk to IHS, restaurants/dining, Ithaca Falls, Science Center and Stewart Park. Convenient to bus routes, walk to commons and shopping. Private deck with functioning hot tub. Dry basement, block foundation, cement floor-unusual bonus in Fall Creek neighborhood.
-
2014-04-23$177,500 322-char remark
Show marketing remark (322 chars)
Lovely quaint Cape Cod on the north end of Fall Creek. Short walk to IHS, restaurants/dining, Ithaca Falls, Science Center and Stewart Park. Convenient to bus routes, walk to commons and shopping. Private deck with functioning hot tub. Dry basement, block foundation, cement floor-unusual bonus in Fall Creek neighborhood.
ⓘ Source: listings_history table (triggers on properties + properties_extension) + one-shot
backfill from property_details.listing_events for pre-trigger history.
Tax reassessment forecast NY · Partial reset (capped growth)
- Current annual tax
- $5,637 · $470/mo
- Projected year-2 tax
- $5,649 · $471/mo
- Expected delta
- +$12/yr (+$1/mo · 0.2%)
ⓘ Screening estimate from a state-policy table — verify with the county assessor before closing.
Climate risk First Street
- Flood 9/10 Extreme FEMA zone X (shaded) · 99% chance over 30 yrs
- Wildfire 1/10 Low
- Heat 3/10 Moderate 7 d/yr ≥94°F today · 16 d/yr by 30 yrs out
- Wind 1/10 Low 100% chance of damaging wind over 30 yrs
- Air quality 2/10 Low 0 unhealthy d/yr today · 1 by 30 yrs out
Nearby sold comps map
Loading sold comps map…
Walkable amenities ~0.75 mi
Loading nearby amenities…
Taxation est. · year 1
- Rental income
- $43,954
- − Mortgage interest
- −$18,765
- − Property taxes
- −$5,637
- − Insurance
- −$2,342
- − Repairs & maintenance
- −$3,516
- − Management
- −$3,516
- − Depreciation
- −$9,745
- Taxable income
- $433
- Est. tax owed @ 24.0%
- −$104
- After-tax cash flow
- $5,560/yr
For passive investors: Depreciation is non-cash, so a rental often shows a tax loss while cash-flowing — sheltering income. Rental losses are passive: they offset passive income freely, and up to $25,000/yr can offset ordinary (W-2) income if you actively participate and your MAGI is under $100k (phasing out to $0 by $150k); unused losses carry forward. On sale, claimed depreciation is recaptured at up to 25%, and gains may owe capital-gains tax (a 1031 exchange can defer both). Figures are a year-1 estimate at your 24.0% rate — not tax advice; consult a CPA.
Schools (NCES district)
- District
- Ithaca City School District
- NCES district ID
- 3615570
- Math proficiency
- 57% ▼ -5.00%
- Reading proficiency
- 71% ▲ 11.00%
- Median HH income
- $46,528
- Composite
- 54.01/100
- National rank
- #1397
- State rank
- #195 of 590 in NY
Livability — Ithaca
- Score
- 77/100
- State rank
- #210
- US rank
- #3240
Category grades
Schools grade is shown separately in the Schools card above.
Census & demographics
- Census place
- Ithaca, NY
- County
- Tompkins County · 68,610 people
- City population
- 68,610
- Metro
- Ithaca, NY
- Population (ZIP)
- 68,610
- Household income
- $71,445
- Rent vs Own
- Severe rent burden
- 5169.0
Population outlook (Tompkins County) Hauer SSP2
- Today (2025)
- 113,958 people
- By 2030
- 118,774 · +4.2%
- By 2040
- 125,927 · +10.5%
- By 2050
- 133,599 · +17.2%
- By 2075
- 156,759 · +37.6%
- By 2100
- 169,896 · +49.1%
Race, ethnicity, and origin ACS 2023
- Neighborhood character
- Predominantly White (68%)
- Race & ethnicity
- White 68% Asian 13% Hispanic / Latino 8% Two or more races 8% Black 4%
- Hispanic origin (detail)
- Mexican 2% Puerto Rican 2%
- Common ancestry
- Romanian 3% Italian 3% Scotch-Irish 2%
- Foreign-born
- 18% · China, Canada, South Korea
- Languages at home
- 79% English-only · Chinese 5% Spanish 4% Other Indo-European 4%
Political lean MEDSL · Tompkins
- 2024 margin
- Solid D (+50.6) · D 75.3% · R 24.7%
- 2008→2024 swing
- +8.6pp toward D · 2008: 42.1pp · 2024: 50.6pp
- All cycles
- 2024: D+50.6 2020: D+49.2 2016: D+42.1 2012: D+39.8 2008: D+42.1
Not yet ingested
- Civics
- —
Market trends
- HPI YoY
- ▼ -276.59%
- Current HPI
- 389.7215
- Rent YoY
- ▲ 5.22%
- Metro
- Ithaca, NY
- State GDP YoY
- ▲ 2.60%
- F500 in state
- 92
Industry mix (Fortune 500 HQ in NY)
| Industry | F500 HQs | Revenue |
|---|---|---|
| Financial Services | 10 | $950B |
|
||
| Consumer Goods | 9 | $162B |
|
||
| Insurance | 4 | $225B |
|
||
| Telecommunications | 2 | $144B |
|
||
| Pharmaceuticals | 2 | $112B |
|
||
| Media / Entertainment | 2 | $69B |
|
||
Price history
+88.7% since first listed5 events — show timeline
- 2026-05-09 Price Changed $335,000 UNYREIS
- 2026-04-24 Listed $355,000 UNYREIS
- 2014-06-30 Sold (Public Records) $175,000 Public Records
- 2014-06-30 Sold (MLS) $175,000 IBRMLS
- 2014-04-23 Listed $177,500 IBRMLS
Property tax history
-0.3%/yrLatest (2025): $5,637 · +3.2% YoY. Source: county tax records.
Cash-flow waterfall
monthlySold comps — $/sqft
last 12 mo · ≤1 miLoading sold comps…