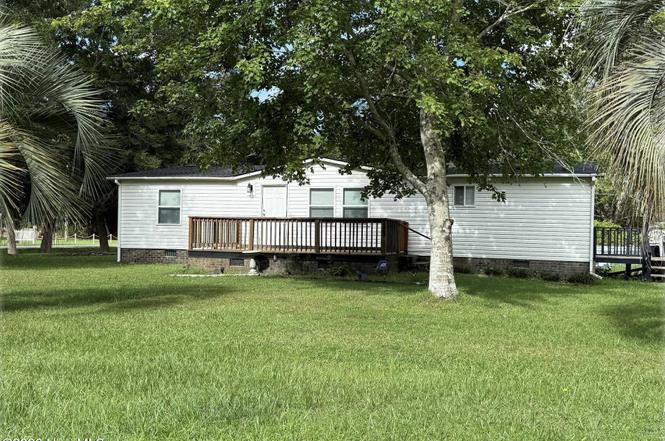
2447 Pinewood Dr SW · Holden Beach, NC
Flood risk 3/10 · Minor
- FEMA flood zone
- X (unshaded)
- Chance of flooding over 30 yrs
- 0.2%
- Est. flood insurance / yr
- $507 – $1,088
Fire risk 4/10 · Minor
- Est. fire insurance / yr
- $906 – $1,684
Heat risk 9/10 · Severe
- Hot days now (above 103°F)
- 7 days/yr
- Hot days in 30 yrs
- 19 days/yr
Wind risk 9/10 · Severe
- Chance of severe wind over 30 yrs
- 99.0%
Air-quality risk 2/10 · Minimal
- Unhealthy air days now
- 1 days/yr
- Unhealthy air days in 30 yrs
- 1 days/yr
Risk factors via First Street. Map © Google.
Why this score? — see what drove the C+ grade
The composite is a weighted blend of 9 inputs, each scored 0–100. Each bar is that input's sub-score; the figure is the points it added to the 100-point composite (weight × sub-score).
- Cash flow +24.0/30.0
- ARV discount +14.3/15.0
- DSCR +7.7/10.0
- 1% rule +5.0/10.0
- Schools +3.9/10.0
- Livability +3.2/5.0
- Rent growth +2.5/5.0
- Condition / age +2.5/5.0
- Appreciation +0.0/10.0
$175,000
🖨 Deal sheet 📄 Offer letter ✓ Due diligence
Listing remarks
Court approved sale. This 3 bedroom 2 bath home includes 3 lots. Some upgrades have been completed and with some minimal additional work you can have a home or get away just minutes from the beach. Spacious kitchen with solid surface counter tops and all major appliances are included. Seller is a court-appointed Commissioner and any sale is subject to the approval of the Brunswick County Clerk of Court following a 10 day upset bid period. Seller makes no warranties regarding condition of the property. Standard Commissioners Deed to be provided at settlement. This property is being sold AS IS. Report of sale has been filed with the Brunswick County Clerk of Courts on May 1, 2026. The propert
Key facts
- 3 lots
- Spacious kitchen
- 0.43 acre lot
Tags
Property features AI
Exterior
- Parking: Off-street parking; On-site parking; Unpaved parking
- Utilities: Public water and well available; Septic tank; Water available
- Home design: Manufactured home; One level; Residential property; Shingle roof; Brick/mortar foundation; Vinyl siding and frame construction; Has a view
- Construction: Built with vinyl siding and frame; Shingle roof; Brick/mortar foundation
- Exterior features: Deck; Porch; Screened porch; Above-ground pool; Shed(s); Corner lot; Paved road frontage on a private road
Interior
- Kitchen: Electric oven; Refrigerator; Microwave; Electric water heater
- Bedrooms: Master downstairs
- Flooring: Laminate; Vinyl
- Bathrooms: 2 full bathrooms
- Heating & cooling: Heat pump; Electric heating; Forced air; Central air conditioning
- Interior features: Master bedroom on the main level; Walk-in closet(s); Ceiling fan(s); Window coverings; Unfurnished
- Laundry & utility: Washer; Dryer; Washer hookup in hall
Neighborhood map
What this means for you Summary
Snapshot
- This is a 2-bed/2.0-bath manufactured listed at $175k.
Deal economics
- At list price, monthly cash flow is $344 ($4k/yr) — positive.
- The deal already cash-flows at list — no discount required.
- To meet the 1% rule (rent ≥ 1% of price), the offer needs to be $174k (0.4% below list).
- Recommended offer: $154k (12.0% below list) — sets the bar for market timing.
- Cap rate 8.7% vs local median 3.1% in Holden Beach — top-decile yield for the area; either an underpriced asset or a hidden risk that comps aren't pricing in. Stress-test before assuming the spread holds.
Location & tenants
- Location reads 65/100 on livability (#334 in NC) — a middle-class / working-renter tenant base. Strengths: employment A+, crime A, housing A; Watch: cost of living D, health & safety D, amenities F.
- Brunswick County Schools (rural): math 45% / reading 47% proficiency, ranked #82 of 178 in NC (top 46%) — families likely to look elsewhere, expect single-tenant / working-renter base with shorter leases.
- Zoned schools: Virginia Williamson Elem (math 50% / reading 49%, grade D, #417 of 1,410 statewide, top 32%, 502 students, 99% FRL); Cedar Grove Middle (math 30% / reading 36%, grade F, #305 of 475 statewide, top 65%, 434 students, 99% FRL); West Brunswick High (math 50% / reading 56%, grade C-, #281 of 535 statewide, top 53%, 1,526 students, 100% FRL) — zoned schools average 100% FRL vs 53% district-wide (46 pts higher); higher-poverty schools than district average — tighter screening recommended.
- Market conditions: 506 active listings in the ZIP; 6,112 units permitted in Brunswick County in 2024 (990 in 5+ unit buildings).
- This rent runs 35% of the median local income ($60k/yr) — at the standard rent-burdened threshold; future hikes will face affordability resistance.
Forward outlook
- Local home prices are declining (-3.0%/yr); year-one equity from $1k of loan paydown is wiped out by about $5k of value loss. Plan a longer hold.
- Brunswick County population projected at +36% by 2050 — long-run rental-demand tailwind backs the buy-and-hold thesis.
Negotiation context
- It's been on market 139 days — a 12% lower offer ($154k) is reasonable based on typical stale-listing flexibility.
- 2 sale attempts; this cycle's ask has dropped $10k (5%) from the opening price — seller is motivated, your offer sets the floor, not the list.
Risks & watch-outs
- Climate carrying-cost: severe wind risk, 99% chance of damaging wind over 30y; extreme-heat days projected 7→19/yr by 2055 (HVAC capex compounding) — expect insurance premiums to compound above CPI over the hold.
Questions for the listing agent
- It's been on market 139 days. Have you received any prior offers? Is the seller open to a 12% concession, seller financing, or rate buy-down credit?
- Why hasn't it sold? Are there any deal-killer items the seller is aware of (foundation, flood, title, zoning, code violations)?
- Is there a deadline driving the sale (1031 exchange, divorce, estate, relocation)? That informs how much negotiation room exists.
- What's the average days-on-market for RENTAL listings here right now (not sales)? A rising rental-DOM trend means longer vacancies and softer asking-rent achievability than the comps imply.
- What's the recent tenant-quality profile in this submarket — average credit score on applications, eviction rate, late-payment / NSF rate, and stable-employment percentage? A property-management company in the area should have these aggregated.
- How much new for-sale + rental construction is in the pipeline within 1–3 miles? Heavy new supply typically softens prices + rents 12–24 months out; constrained supply supports both.
Investment metrics
- 1% rule
- 1.00% ✗
- Cap rate
- 8.65%
- Cash-on-cash
- 8.43%
- DSCR
- 1.37
- GRM
- 8.4
CMA / ARV
- ARV (on-the-fly)
- $206,064
- Comps found
- 12
Show comp detail 12 sales within ~0.75 mi
| Address | Dist | Beds/Ba | Sqft | Sold | Price | $/sf | Match |
|---|---|---|---|---|---|---|---|
| 2550 White Sands Dr SW | 0.20mi | 3/2.0 (+1) | 1,428 (+10%) | 0mo | $236,000 | $165 | 68 |
| 2293 Kirby Rd SW | 0.39mi | 2/2.0 | 1,248 (-4%) | 10mo | $168,500 | $135 | 67 |
| 2529 White Sands Dr SW | 0.16mi | 3/2.0 (+1) | 1,165 (-10%) | 7mo | $239,000 | $205 | 64 |
| 2271 Bob White Rd SW | 0.39mi | 3/2.0 (+1) | 1,381 (+7%) | 3mo | $82,000 | $59 | 63 |
| 2257 Whippoorwill St SW | 0.49mi | 3/2.0 (+1) | 1,296 (0%) | 13mo | $215,000 | $166 | 61 |
| 2392 Circle Dr SW | 0.32mi | 3/2.0 (+1) | 1,475 (+14%) | 9mo | $234,600 | $159 | 49 |
| 2315 Circle Dr SW | 0.26mi | 3/2.0 (+1) | 1,474 (+14%) | 16mo | $235,000 | $159 | 47 |
| 2183 Helmsman Dr SW | 0.71mi | 3/2.0 (+1) | 1,344 (+4%) | 11mo | $210,000 | $156 | 46 |
| 2354 Lena Ln SW | 0.50mi | 3/2.0 (+1) | 1,433 (+11%) | 12mo | $235,000 | $164 | 44 |
| 2283 Setter Ct SW | 0.59mi | 3/2.0 (+1) | 1,188 (-8%) | 12mo | $87,000 | $73 | 43 |
| 2564 Nickle St SW | 0.61mi | 3/2.0 (+1) | 1,462 (+13%) | 10mo | $206,419 | $141 | 37 |
| 2356 Lena Ln SW | 0.49mi | 3/2.0 (+1) | 1,488 (+15%) | 14mo | $199,000 | $134 | 36 |
Match score weights: distance 35% · size 25% · config 20% · recency 20%. Top-matched comps best support the ARV.
Projected returns pro-forma
-3.0% appreciation · 3.0% rent growth · sell at horizon
- IRR
- -3.6%
- Equity multiple
- 0.87×
- Total profit
- $-6,526
- Equity at exit
- $26,093
- IRR
- 6.1%
- Equity multiple
- 1.45×
- Total profit
- $22,201
- Equity at exit
- $15,131
Cash invested: $49,000 (down + closing). Projections, not guarantees.
Landlord ↔ Tenant lean methodology
- Overall (STATE)
- 85 Strongly Landlord-Friendly
- State North Carolina
- 85 Strongly Landlord-Friendly · R+3
- County
- — inherits STATE
- City
- — inherits STATE
ZIP-level market 28462
- Active inventory
- 506
- Price-to-rent
- 8.4×
Monthly cashflow live
- Estimated rent
- $1,743 medium interval (Pro) →
- Mortgage (P&I)
- −$918
- Tax from tax record
- −$42 /mo · $505/yr
- Insurance
- −$73
- HOA
- −$0
- Vacancy / Maint / Mgmt
- −$366
- Net cashflow
- $344
Break-even live
UW: 25.0% down · 7.5% · 30yr · 1.5% tax · 5.0% vac · 8.0% maint · 8.0% mgmt
Financing live
Cash to close
- Down payment
- $43,750
- Closing costs
- $5,250
- Reserves months
- —
- Total cash needed
- —
Loan-product check · same deal, 3 products live
Conventional
25% down · 7.5% · 30yr
- Down + closing
- —
- Monthly P&I
- —
- Monthly cashflow
- —
- DSCR
- —
- Eligible?
- —
Personal DTI + credit; lowest rate.
DSCR
20% down · 8.5% · 30yr
- Down + closing
- —
- Monthly P&I
- —
- Monthly cashflow
- —
- DSCR
- —
- Eligible?
- —
No personal income docs; deal must DSCR.
Hard money
10% down · 12.0% · 12mo
- Down + closing
- —
- Monthly P&I
- —
- Monthly cashflow
- —
- DSCR
- —
- Eligible?
- —
Short-term bridge; refi at stabilization.
Listing history 16 events
-
2026-06-07statusdays on market $175,000 Pending 139 DOM
-
2026-06-05days on market $175,000 Active Under Contract 138 DOM
-
2026-06-03days on market $175,000 Active Under Contract 137 DOM
-
2026-06-02days on market $175,000 Active Under Contract 136 DOM
-
2026-06-01days on market $175,000 Active Under Contract 135 DOM
-
2026-05-31days on market $175,000 Active Under Contract 134 DOM
-
2026-05-30days on market $175,000 Active Under Contract 133 DOM
-
2026-04-08historical Active Under Contract
-
2026-03-19price $175,000
-
2026-01-17$185,000 Active
-
2025-12-31historical
-
2025-11-06price $185,000
-
2025-09-12price $189,000
-
2025-05-27price $199,900
-
2025-04-29price $207,000
-
2025-02-21$229,000 Active
ⓘ Source: listings_history table (triggers on properties + properties_extension) + one-shot
backfill from property_details.listing_events for pre-trigger history.
Tax reassessment forecast NC · Resets to sale price
- Current annual tax
- $505 · $42/mo
- Projected year-2 tax
- $1,435 · $120/mo
- Expected delta
- +$930/yr (+$78/mo · 184.3%)
ⓘ Screening estimate from a state-policy table — verify with the county assessor before closing.
Climate risk First Street
- Flood 3/10 Moderate FEMA zone X (unshaded) · 20% chance over 30 yrs
- Wildfire 4/10 Moderate
- Heat 9/10 Extreme 7 d/yr ≥103°F today · 19 d/yr by 30 yrs out
- Wind 9/10 Extreme 99% chance of damaging wind over 30 yrs
- Air quality 2/10 Low 1 unhealthy d/yr today · 1 by 30 yrs out
Nearby sold comps map
Loading sold comps map…
Walkable amenities ~0.75 mi
Loading nearby amenities…
Taxation est. · year 1
- Rental income
- $20,913
- − Mortgage interest
- −$9,803
- − Property taxes
- −$505
- − Insurance
- −$875
- − Repairs & maintenance
- −$1,673
- − Management
- −$1,673
- − Depreciation
- −$5,091
- Taxable income
- $1,293
- Est. tax owed @ 24.0%
- −$310
- After-tax cash flow
- $3,818/yr
For passive investors: Depreciation is non-cash, so a rental often shows a tax loss while cash-flowing — sheltering income. Rental losses are passive: they offset passive income freely, and up to $25,000/yr can offset ordinary (W-2) income if you actively participate and your MAGI is under $100k (phasing out to $0 by $150k); unused losses carry forward. On sale, claimed depreciation is recaptured at up to 25%, and gains may owe capital-gains tax (a 1031 exchange can defer both). Figures are a year-1 estimate at your 24.0% rate — not tax advice; consult a CPA.
Schools (NCES district)
- District
- Brunswick County Schools
- NCES district ID
- 3700420
- Math proficiency
- 45% ▲ 4.00%
- Reading proficiency
- 47% ▲ 4.00%
- Median HH income
- $47,494
- Composite
- 39.23/100
- National rank
- #4011
- State rank
- #82 of 178 in NC
Livability — Holden Beach
- Score
- 65/100
- State rank
- #334
- US rank
- #13586
Category grades
Schools grade is shown separately in the Schools card above.
Census & demographics
- County
- Brunswick County · 131,536 people
- Metro
- Myrtle Beach-Conway-North Myrtle Beach, SC-NC
- Population (ZIP)
- 12,340
- Household income
- $60,349
- Rent vs Own
- Severe rent burden
- 269.0
Population outlook (Brunswick County) Hauer SSP2
- Today (2025)
- 152,111 people
- By 2030
- 165,705 · +8.9%
- By 2040
- 188,494 · +23.9%
- By 2050
- 206,228 · +35.6%
- By 2075
- 237,876 · +56.4%
- By 2100
- 251,451 · +65.3%
Race, ethnicity, and origin ACS 2023
- Neighborhood character
- Predominantly White (87%)
- Race & ethnicity
- White 87% Black 7% Two or more races 5% Hispanic / Latino 2%
- Common ancestry
- Slovak 4% Lithuanian 4% Serbian 2%
- Foreign-born
- 1% · Canada
- Languages at home
- 99% English-only · Spanish 1%
Political lean MEDSL · Brunswick
- 2024 margin
- Strong R (+24.9) · D 37.2% · R 62.0%
- 2008→2024 swing
- -6.9pp toward R · 2008: -17.9pp · 2024: -24.9pp
- All cycles
- 2024: R+24.9 2020: R+25.0 2016: R+28.7 2012: R+22.2 2008: R+17.9
Not yet ingested
- Civics
- —
Market trends
- HPI YoY
- ▼ -259.44%
- Current HPI
- 144.2462
- Rent YoY
- —
- Metro
- Myrtle Beach-Conway-North Myrtle Beach, SC-NC
- State GDP YoY
- ▲ 3.28%
- F500 in state
- 26
Industry mix (Fortune 500 HQ in NC)
| Industry | F500 HQs | Revenue |
|---|---|---|
| Financial Services | 2 | $213B |
|
||
| Retail | 2 | $95B |
|
||
| Industrial Conglomerate | 1 | $38B |
|
||
| Metals / Steel | 1 | $35B |
|
||
| Utilities | 1 | $30B |
|
||
| Industrial Machinery | 1 | $19B |
|
||
Price history
-23.6% since first listed9 events — show timeline
- 2026-04-08 Contingent — Hive MLS
- 2026-03-19 Price Changed $175,000 Hive MLS
- 2026-01-17 Listed $185,000 Hive MLS
- 2025-12-31 Listing Removed — Hive MLS
- 2025-11-06 Price Changed $185,000 Hive MLS
- 2025-09-12 Price Changed $189,000 Hive MLS
- 2025-05-27 Price Changed $199,900 Hive MLS
- 2025-04-29 Price Changed $207,000 Hive MLS
- 2025-02-21 Listed $229,000 Hive MLS
Property tax history
+3.0%/yrLatest (2025): $505 · +0.0% YoY. Source: county tax records.
Cash-flow waterfall
monthlySold comps — $/sqft
last 12 mo · ≤1 miLoading sold comps…