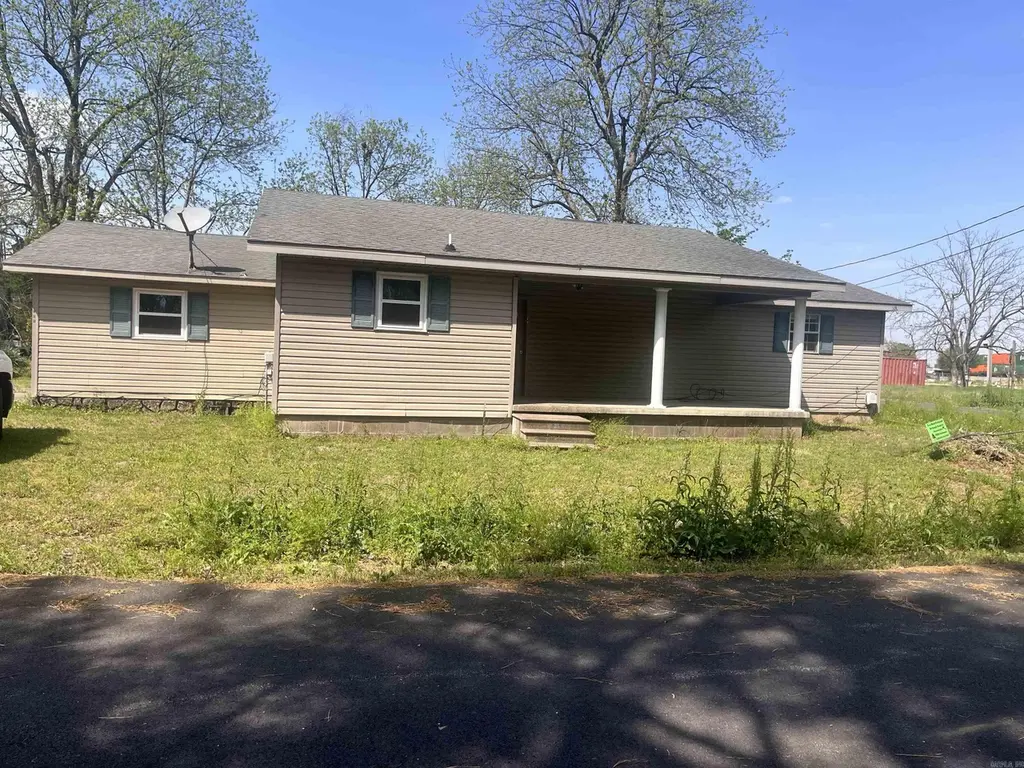
209 S 2nd St · Marmaduke, AR
Flood risk No data
- FEMA flood zone
- —
- Chance of flooding over 30 yrs
- —
- Est. flood insurance / yr
- —
Fire risk No data
- Est. fire insurance / yr
- —
Heat risk No data
- Hot days now (above threshold)
- —
- Hot days in 30 yrs
- —
Wind risk No data
- Chance of severe wind over 30 yrs
- —
Air-quality risk No data
- Unhealthy air days now
- —
- Unhealthy air days in 30 yrs
- —
Risk factors via First Street. Map © Google.
Why this score? — see what drove the C- grade
The composite is a weighted blend of 9 inputs, each scored 0–100. Each bar is that input's sub-score; the figure is the points it added to the 100-point composite (weight × sub-score).
- Cash flow +13.6/30.0
- ARV discount +10.8/15.0
- Appreciation +7.5/10.0
- DSCR +4.1/10.0
- Livability +3.8/5.0
- 1% rule +2.8/10.0
- Schools +2.8/10.0
- Rent growth +2.5/5.0
- Condition / age +2.5/5.0
$129,000
🖨 Deal sheet (PDF) 📄 Offer letter ✓ Due diligence
Listing remarks MLS
Investment property in Marmaduke. Needs some TLC could make a great rental or future home sits on a corner lot. Being sold as is no repairs.
Key facts
- 6,969 sq ft lot
- Built 2005
- Listed 53 days
Property features AI
Finance
- Financial info: Cash financing possible
Exterior
- Parking: Parking pads
- Utilities: Public sewer; Public water
- Home design: Metal/vinyl siding; Architectural shingle roof; Inside city limits
- Construction: Crawl space foundation
- Exterior features: Level, corner lot; Paved road access
Interior
- Kitchen: Refrigerator stays
- Flooring: Carpet; Vinyl
- Bathrooms: 2 full bathrooms
- Heating & cooling: Central electric heating; Central electric cooling
- Interior features: Carpet and vinyl flooring; Porch
Neighborhood map
What this means for you Summary
Snapshot
- This is a 3-bed/2.0-bath single-family listed at $129k.
Deal economics
- At list price, monthly cash flow is $7 ($87/yr) — positive.
- The deal already cash-flows at list — no discount required.
- To meet the 1% rule (rent ≥ 1% of price), the offer needs to be $100k (22.5% below list).
- Recommended offer: $100k (22.5% below list) — sets the bar for 1% rule.
Location & tenants
- Location reads 76/100 on livability (#13 in AR, #3,617 nationally) — a middle-class / working-renter tenant base. Strengths: cost of living A+, housing A+, health & safety A+; Watch: amenities D, schools F, commute F.
- Marmaduke School District (rural): math 32% / reading 34% proficiency, ranked #131 of 238 in AR (top 55%) — families likely to look elsewhere, expect single-tenant / working-renter base with shorter leases.
- Market conditions: 9 active listings in the ZIP; 1 comparable units currently listed for rent nearby; 265 units permitted in Greene County in 2024 (135 in 5+ unit buildings).
Forward outlook
- In year one you build about $7k of equity ($892 loan paydown + $6k appreciation (4.9% local appreciation)).
- Greene County population projected at +20% by 2050 — long-run rental-demand tailwind backs the buy-and-hold thesis.
- At projected returns (4.9% appreciation + 3.0% rent growth), your $36k cash investment doubles in ~5 years — after that, you're playing with house money.
- By year 5, paydown + projected appreciation supports a ~$32k cash-out refi (75% LTV) — recoverable capital for the next deal without selling this one.
Negotiation context
- It's been on market 54 days — a 3% lower offer ($125k) is reasonable based on typical stale-listing flexibility.
- 11 sale attempts since 4y ago with the ask held roughly flat each time — persistent listings suggest the price (not the market) is what's stuck; bring a comps-based counter.
- Current owner paid $18k; list at $129k implies a 617% gain — meaningful room to come down on a strong offer.
Questions for the listing agent
- It's been on market 54 days. Have you received any prior offers? Is the seller open to a 22% concession, seller financing, or rate buy-down credit?
- Is there a deadline driving the sale (1031 exchange, divorce, estate, relocation)? That informs how much negotiation room exists.
- Schools are F-rated, which usually means shorter tenancies and higher turnover. Who's the typical renter profile here, and what's been the actual vacancy rate?
- What's the average days-on-market for RENTAL listings here right now (not sales)? A rising rental-DOM trend means longer vacancies and softer asking-rent achievability than the comps imply.
- What's the recent tenant-quality profile in this submarket — average credit score on applications, eviction rate, late-payment / NSF rate, and stable-employment percentage? A property-management company in the area should have these aggregated.
- How much new for-sale + rental construction is in the pipeline within 1–3 miles? Heavy new supply typically softens prices + rents 12–24 months out; constrained supply supports both.
Investment metrics
- 1% rule
- 0.78% ✗
- Cap rate
- 6.36%
- Cash-on-cash
- 0.24%
- DSCR
- 1.01
- GRM
- 10.8
CMA / ARV
- ARV (median comp)
- $139,083
- List price
- $129,000
- Delta
- -7.25%
- Verdict
- FAIR
- Comps
- 20 within 1.0 mi
Show comp detail 5 sales within ~0.75 mi
| Address | Dist | Beds/Ba | Sqft | Sold | Price | $/sf | Match |
|---|---|---|---|---|---|---|---|
| 105 N Park St | 0.27mi | 3/2.0 | 1,582 (+1%) | 2mo | $200,000 | $126 | 84 |
| 707 N 4th St | 0.39mi | 3/2.0 | 1,535 (-2%) | 5mo | $170,000 | $111 | 74 |
| 505 N 5th St | 0.31mi | 3/2.0 | 1,590 (+1%) | 19mo | $149,900 | $94 | 68 |
| 402 W Williford St | 0.31mi | 3/2.0 | 1,463 (-7%) | 14mo | $190,575 | $130 | 62 |
| 161 Joy | 0.71mi | 3/2.0 | 1,457 (-7%) | 23mo | $210,000 | $144 | 35 |
Match score weights: distance 35% · size 25% · config 20% · recency 20%. Top-matched comps best support the ARV.
Projected returns pro-forma
4.94% appreciation · 3.0% rent growth · sell at horizon
- IRR
- 12.9%
- Equity multiple
- 1.82×
- Total profit
- $29,677
- Equity at exit
- $72,606
- IRR
- 13.8%
- Equity multiple
- 3.48×
- Total profit
- $89,462
- Equity at exit
- $124,900
Cash invested: $36,120 (down + closing). Projections, not guarantees.
Landlord ↔ Tenant lean methodology
- Overall (STATE)
- 92 Strongly Landlord-Friendly
- State Arkansas
- 92 Strongly Landlord-Friendly · R+14
- County
- — inherits STATE
- City
- — inherits STATE
ZIP-level market 72443
- Home prices YoY
- 2.0%
- Active inventory
- 9
- Price-to-rent
- 10.8×
Monthly cashflow live
- Estimated rent
- $1,000 medium interval (Pro) →
- Mortgage (P&I)
- −$676
- Tax from tax record
- −$52 /mo · $630/yr
- Insurance
- −$54
- HOA
- −$0
- Vacancy / Maint / Mgmt
- −$210
- Net cashflow
- $7
Break-even live
Sensitivity live
| Price | -10% $80 | -5% $44 | +0% $7 | +5% $-29 | +10% $-66 |
|---|---|---|---|---|---|
| Rent | -10% $-72 | -5% $-32 | +0% $7 | +5% $47 | +10% $86 |
| Rate | -1.0pp $72 | -0.5pp $40 | base $7 | +0.5pp $-26 | +1.0pp $-60 |
UW: 25.0% down · 7.5% · 30yr · 1.5% tax · 5.0% vac · 8.0% maint · 8.0% mgmt
Financing live
Cash to close
- Down payment
- $32,250
- Closing costs
- $3,870
- Reserves months
- —
- Total cash needed
- —
Loan-product check · same deal, 3 products live
Conventional
25% down · 7.5% · 30yr
- Down + closing
- —
- Monthly P&I
- —
- Monthly cashflow
- —
- DSCR
- —
- Eligible?
- —
Personal DTI + credit; lowest rate.
DSCR
20% down · 8.5% · 30yr
- Down + closing
- —
- Monthly P&I
- —
- Monthly cashflow
- —
- DSCR
- —
- Eligible?
- —
No personal income docs; deal must DSCR.
Hard money
10% down · 12.0% · 12mo
- Down + closing
- —
- Monthly P&I
- —
- Monthly cashflow
- —
- DSCR
- —
- Eligible?
- —
Short-term bridge; refi at stabilization.
Rent comps 1 comps
| Address | Beds | Baths | Sqft | Rent | $/sqft | DOM | Units | Dist |
|---|---|---|---|---|---|---|---|---|
| 109 W England Ave Marmaduke, AR | 2.0 | 1.5 | 1063 | $1,000 | $0.94 | 44d | 1 | 0.25mi |
Listing history 34 events
-
2026-06-19days on market $129,000 Active 54 DOM
-
2026-06-18days on market $129,000 Active 53 DOM
-
2026-06-17days on market $129,000 Active 52 DOM
-
2026-06-16days on market $129,000 Active 51 DOM
-
2026-06-15days on market $129,000 Active 50 DOM
-
2026-06-14days on market $129,000 Active 48 DOM
-
2026-06-12days on market $129,000 Active 47 DOM
-
2026-06-09days on market $129,000 Active 44 DOM
-
2026-06-08days on market $129,000 Active 43 DOM
-
2026-06-07days on market $129,000 Active 42 DOM
-
2026-06-05days on market $129,000 Active 39 DOM
-
2026-06-03days on market $129,000 Active 38 DOM
-
2026-06-02days on market $129,000 Active 37 DOM
-
2026-06-01days on market $129,000 Active 36 DOM
-
2026-05-31days on market $129,000 Active 35 DOM
-
2026-05-30days on market $129,000 Active 34 DOM
-
2026-04-24$129,000 New Listing 139-char remark
Show marketing remark (140 chars)
Investment property in Marmaduke. Needs some TLC could make a great rental or future home sits on a corner lot. Being sold as is no repairs.
-
2026-04-24$129,000 Active 140-char remark
Show marketing remark (140 chars)
Investment property in Marmaduke. Needs some TLC could make a great rental or future home sits on a corner lot. Being sold as is no repairs.
-
2025-09-12historical
-
2024-12-16$125,000 Active
-
2024-12-15$125,000 New Listing
-
2024-10-24historical
-
2024-07-22$100,000 New Listing
-
2024-07-19$100,000
-
2024-06-14historical
-
2024-02-21price $110,000
-
2024-02-20price $110,000
-
2023-12-13$150,000 New Listing
-
2023-12-13$150,000 Active
-
2023-05-05historical
-
2022-11-04$150,000 Active
-
2022-11-04$150,000 New Listing
-
2022-05-10$150,000
-
2004-10-05soldstatus $18,000
ⓘ Source: listings_history table (triggers on properties + properties_extension) + one-shot
backfill from property_details.listing_events for pre-trigger history.
Tax reassessment forecast AR · Resets to sale price
- Current annual tax
- $630 · $52/mo
- Projected year-2 tax
- $826 · $69/mo
- Expected delta
- +$196/yr (+$16/mo · 31.0%)
ⓘ Screening estimate from a state-policy table — verify with the county assessor before closing.
Nearby sold comps map
Loading sold comps map…
Walkable amenities ~0.75 mi
Loading nearby amenities…
Taxation est. · year 1
- Rental income
- $12,000
- − Mortgage interest
- −$7,226
- − Property taxes
- −$630
- − Insurance
- −$645
- − Repairs & maintenance
- −$960
- − Management
- −$960
- − Depreciation
- −$3,753
- Taxable loss
- −$2,174
- Est. tax savings @ 24.0%
- +$522
- After-tax cash flow
- $609/yr
For passive investors: Depreciation is non-cash, so a rental often shows a tax loss while cash-flowing — sheltering income. Rental losses are passive: they offset passive income freely, and up to $25,000/yr can offset ordinary (W-2) income if you actively participate and your MAGI is under $100k (phasing out to $0 by $150k); unused losses carry forward. On sale, claimed depreciation is recaptured at up to 25%, and gains may owe capital-gains tax (a 1031 exchange can defer both). Figures are a year-1 estimate at your 24.0% rate — not tax advice; consult a CPA.
Schools (NCES district)
- District
- Marmaduke School District
- NCES district ID
- 0500016
- Math proficiency
- 32% ▼ -2.00%
- Reading proficiency
- 34% ▼ -6.00%
- Median HH income
- $41,648
- Composite
- 27.89/100
- National rank
- #6869
- State rank
- #131 of 238 in AR
Livability — Marmaduke
- Score
- 76/100
- State rank
- #13
- US rank
- #3617
Category grades
Schools grade is shown separately in the Schools card above.
Census & demographics
- Census place
- Marmaduke, AR
- Population (ZIP)
- 2,573
Population outlook (Greene County) Hauer SSP2
- Today (2025)
- 48,533 people
- By 2030
- 50,640 · +4.3%
- By 2040
- 54,795 · +12.9%
- By 2050
- 58,486 · +20.5%
- By 2075
- 66,056 · +36.1%
- By 2100
- 67,684 · +39.5%
Race, ethnicity, and origin ACS 2023
- Neighborhood character
- Predominantly White (95%)
- Race & ethnicity
- White 95% Two or more races 4%
- Common ancestry
- Iranian 3% Italian 3% Lithuanian 2%
- Foreign-born
- 1% · Canada
- Languages at home
- 97% English-only · Spanish 2%
Political lean MEDSL · Greene
- 2024 margin
- Solid R (+61.2) · D 18.6% · R 79.8% · Other 1.7%
- 2008→2024 swing
- -31.5pp toward R · 2008: -29.7pp · 2024: -61.2pp
- All cycles
- 2024: R+61.2 2020: R+59.7 2016: R+53.0 2012: R+36.9 2008: R+29.7
Not yet ingested
- Civics
- —
Market trends
- HPI YoY
- ▲ 4.94%
- Current HPI
- 255.3535
- Rent YoY
- —
- Metro
- —
- State GDP YoY
- ▲ 3.80%
- F500 in state
- 10
Industry mix (Fortune 500 HQ in AR)
| Industry | F500 HQs | Revenue |
|---|---|---|
| Retail | 1 | $681B |
|
||
| Food / Agriculture | 1 | $53B |
|
||
| Retail / Energy | 1 | $22B |
|
||
| Transportation / Logistics | 1 | $12B |
|
||
| Energy | 1 | $4B |
|
||
Price history
+616.7% since first listed18 events — show timeline
- 2026-04-24 Listed $129,000 NEABOR MLS
- 2026-04-24 Listed $129,000 CARMLS
- 2025-09-12 Listing Removed — CARMLS
- 2024-12-16 Listed $125,000 NEABOR MLS
- 2024-12-15 Listed $125,000 CARMLS
- 2024-10-24 Listing Removed — CARMLS
- 2024-07-22 Listed $100,000 CARMLS
- 2024-07-19 Listed $100,000 NEABOR MLS
- 2024-06-14 Listing Removed — CARMLS
- 2024-02-21 Price Changed $110,000 CARMLS
- 2024-02-20 Price Changed $110,000 NEABOR MLS
- 2023-12-13 Listed $150,000 NEABOR MLS
- 2023-12-13 Listed $150,000 CARMLS
- 2023-05-05 Listing Removed — CARMLS
- 2022-11-04 Listed $150,000 CARMLS
- 2022-11-04 Listed $150,000 NEABOR MLS
- 2022-05-10 Listed $150,000 NEABOR MLS
- 2004-10-05 Sold (Public Records) $18,000 Public Records
Property tax history
+4.4%/yrLatest (2025): $630 · +9.1% YoY. Source: county tax records.
Cash-flow waterfall
monthlySold comps — $/sqft
last 12 mo · ≤1 miLoading sold comps…