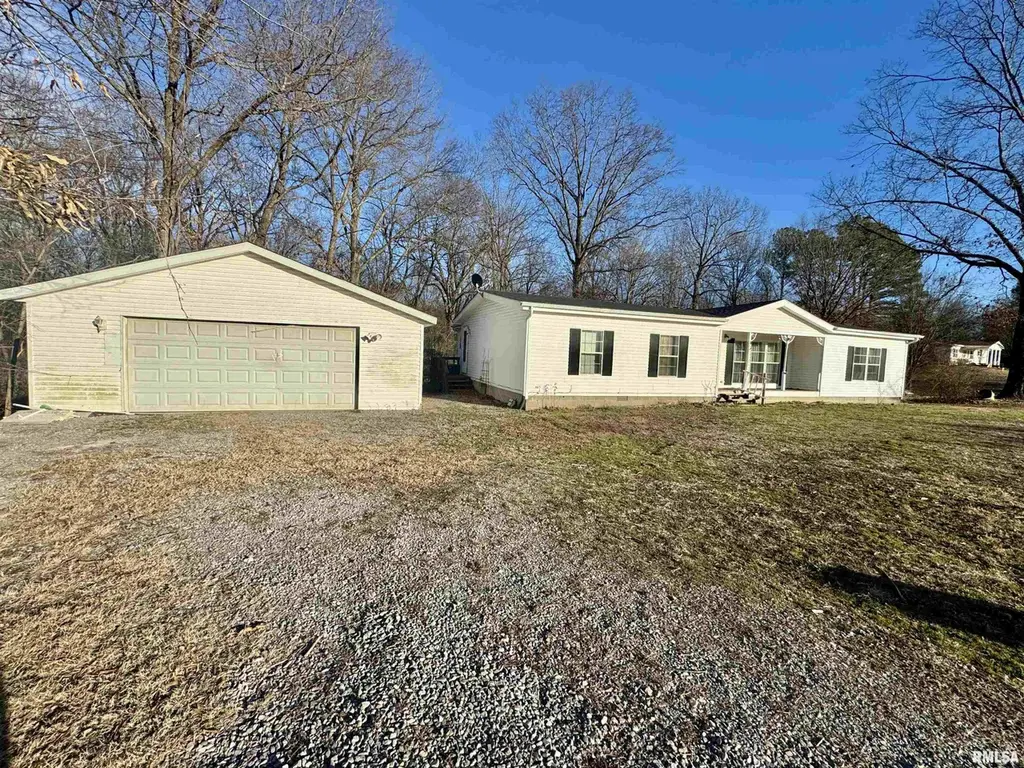
14568 Cambria Rd · Blairsville, IL
Flood risk 1/10 · Minimal
- FEMA flood zone
- X (unshaded)
- Chance of flooding over 30 yrs
- 0.0%
- Est. flood insurance / yr
- $507 – $1,088
Fire risk 3/10 · Minor
- Est. fire insurance / yr
- $804 – $1,492
Heat risk 4/10 · Minor
- Hot days now (above 107°F)
- 7 days/yr
- Hot days in 30 yrs
- 19 days/yr
Wind risk 2/10 · Minimal
- Chance of severe wind over 30 yrs
- 2.0%
Air-quality risk 2/10 · Minimal
- Unhealthy air days now
- 0 days/yr
- Unhealthy air days in 30 yrs
- 1 days/yr
Risk factors via First Street. Map © Google.
Why this score? — see what drove the B- grade
The composite is a weighted blend of 9 inputs, each scored 0–100. Each bar is that input's sub-score; the figure is the points it added to the 100-point composite (weight × sub-score).
- Cash flow +26.4/30.0
- ARV discount +15.0/15.0
- DSCR +9.0/10.0
- 1% rule +5.8/10.0
- Rent growth +2.5/5.0
- Livability +2.5/5.0
- Condition / age +2.5/5.0
- Schools +2.1/10.0
- Appreciation +0.0/10.0
$125,000
🖨 Deal sheet (PDF) 📄 Offer letter ✓ Due diligence
Listing remarks
Investor Special with Room to Grow! Located in Herrin school district this 3-bedroom, 2-bath home offers 1,789 square feet of living space on two spacious lots totaling approx. 3.71 acres, a rare opportunity for those looking to renovate, expand, or build. A new roof was put on the home in 2025! The primary bedroom features a large en-suite bath and walk-in closet, while the home also offers a big living room and a large eat-in kitchen, providing a solid layout ready for your vision. Outside, enjoy the flexibility of keeping both lots for added privacy and space or the potential of building on the 2nd parcel. A detached garage adds extra storage or workshop potential. With plenty of land an
Key facts
- Two spacious lots
- Large eat-in kitchen
- Big living room
Tags
Property features AI
Exterior
- Parking: Detached garage (1 car); Gravel parking
- Utilities: Public water; Septic system
- Home design: Single family residence; Built in 1996
- Construction: Manufactured home: Brillant ShadowBroo; Not new construction
- Exterior features: Wooded lot; Shingle roof
Interior
- Kitchen: Kitchen (main level)
- Bedrooms: 3 bedrooms (all on the main level)
- Flooring: Carpet in bedrooms and living areas; Other flooring in kitchen
- Bathrooms: 2 full bathrooms
- Heating & cooling: Heat pump heating; Central air conditioning
- Interior features: One fireplace; Crawl space basement
Neighborhood map
What this means for you Summary
Snapshot
- This is a 3-bed/2.0-bath single-family listed at $125k.
Deal economics
- At list price, monthly cash flow is $329 ($4k/yr) — positive.
- The deal already cash-flows at list — no discount required.
- Meets the 1% rule at list price ($1k rent vs $125k).
- Recommended offer: $121k (3.0% below list) — sets the bar for market timing.
Location & tenants
- Location reads: area grade B — affects rentability + tenant quality, not the cash-flow math above.
- Herrin CUSD 4 (suburban): math 22% / reading 27% proficiency, ranked #364 of 620 in IL (top 59%) — low school quality limits family demand, transient renter base, plan for 1-2y turnover.
- Zoned schools: Herrin C U S D 4 Elem School (math 21% / reading 25%, grade F, #929 of 2,056 statewide, top 45%, 679 students, 0% FRL); Herrin Middle School (math 24% / reading 28%, grade F, #318 of 665 statewide, top 48%, 507 students, 0% FRL); Herrin High School (math 22% / reading 32%, grade F, #218 of 693 statewide, top 35%, 686 students, 0% FRL) — zoned schools average 0% FRL vs 56% district-wide (56 pts lower); this property's tenant base skews higher-income than the district average.
- Market conditions: 110 active listings in the ZIP; 130 units permitted in Williamson County in 2024 (5 in 5+ unit buildings).
Forward outlook
- Local home prices are declining (-3.0%/yr); year-one equity from $864 of loan paydown is wiped out by about $4k of value loss. Plan a longer hold.
- At projected returns (-3.0% appreciation + 3.0% rent growth), your $35k cash investment doubles in ~10 years — after that, you're playing with house money.
Negotiation context
- It's been on market 45 days — a 3% lower offer ($121k) is reasonable based on typical stale-listing flexibility.
- 2 sale attempts with the ask held roughly flat each time — persistent listings suggest the price (not the market) is what's stuck; bring a comps-based counter.
Questions for the listing agent
- It's been on market 45 days. Have you received any prior offers? Is the seller open to a 3% concession, seller financing, or rate buy-down credit?
- Is there a deadline driving the sale (1031 exchange, divorce, estate, relocation)? That informs how much negotiation room exists.
- What's the average days-on-market for RENTAL listings here right now (not sales)? A rising rental-DOM trend means longer vacancies and softer asking-rent achievability than the comps imply.
- What's the recent tenant-quality profile in this submarket — average credit score on applications, eviction rate, late-payment / NSF rate, and stable-employment percentage? A property-management company in the area should have these aggregated.
- How much new for-sale + rental construction is in the pipeline within 1–3 miles? Heavy new supply typically softens prices + rents 12–24 months out; constrained supply supports both.
Investment metrics
- 1% rule
- 1.08% ✓
- Cap rate
- 9.45%
- Cash-on-cash
- 11.26%
- DSCR
- 1.50
- GRM
- 7.7
CMA / ARV
- ARV (on-the-fly)
- $206,770
- Comps found
- 4
Show comp detail 4 sales within ~0.75 mi
| Address | Dist | Beds/Ba | Sqft | Sold | Price | $/sf | Match |
|---|---|---|---|---|---|---|---|
| 14592 Cambria Rd | 0.03mi | 3/2.0 | 1,608 (-11%) | 20mo | $232,500 | $145 | 64 |
| 1839 Dr Springs Rd | 0.43mi | 3/2.0 | 1,568 (-13%) | 19mo | $115,000 | $73 | 43 |
| 15293 Wall St | 0.73mi | 3/2.0 | 1,612 (-10%) | 9mo | $185,000 | $115 | 41 |
| 15293 Wall St | 0.73mi | 3/2.0 | 1,612 (-10%) | 9mo | $185,000 | $115 | 41 |
Match score weights: distance 35% · size 25% · config 20% · recency 20%. Top-matched comps best support the ARV.
Projected returns pro-forma
-3.0% appreciation · 3.0% rent growth · sell at horizon
- IRR
- 0.5%
- Equity multiple
- 1.02×
- Total profit
- $614
- Equity at exit
- $18,638
- IRR
- 10.1%
- Equity multiple
- 1.78×
- Total profit
- $27,251
- Equity at exit
- $10,808
Cash invested: $35,000 (down + closing). Projections, not guarantees.
Landlord ↔ Tenant lean methodology
- Overall (STATE)
- 43 Moderately Tenant-Leaning
- State Illinois
- 43 Moderately Tenant-Leaning · D+7
- County
- — inherits STATE
- City
- — inherits STATE
ZIP-level market 62918
- Home prices YoY
- -13.8%
- Active inventory
- 110
- Price-to-rent
- 7.7×
Monthly cashflow live
- Estimated rent
- $1,351 medium interval (Pro) →
- Mortgage (P&I)
- −$656
- Tax from tax record
- −$31 /mo · $374/yr
- Insurance
- −$52
- HOA
- −$0
- Vacancy / Maint / Mgmt
- −$284
- Net cashflow
- $329
Break-even live
Sensitivity live
| Price | -10% $399 | -5% $364 | +0% $329 | +5% $293 | +10% $258 |
|---|---|---|---|---|---|
| Rent | -10% $222 | -5% $275 | +0% $329 | +5% $382 | +10% $435 |
| Rate | -1.0pp $392 | -0.5pp $360 | base $329 | +0.5pp $296 | +1.0pp $263 |
UW: 25.0% down · 7.5% · 30yr · 1.5% tax · 5.0% vac · 8.0% maint · 8.0% mgmt
Financing live
Cash to close
- Down payment
- $31,250
- Closing costs
- $3,750
- Reserves months
- —
- Total cash needed
- —
Loan-product check · same deal, 3 products live
Conventional
25% down · 7.5% · 30yr
- Down + closing
- —
- Monthly P&I
- —
- Monthly cashflow
- —
- DSCR
- —
- Eligible?
- —
Personal DTI + credit; lowest rate.
DSCR
20% down · 8.5% · 30yr
- Down + closing
- —
- Monthly P&I
- —
- Monthly cashflow
- —
- DSCR
- —
- Eligible?
- —
No personal income docs; deal must DSCR.
Hard money
10% down · 12.0% · 12mo
- Down + closing
- —
- Monthly P&I
- —
- Monthly cashflow
- —
- DSCR
- —
- Eligible?
- —
Short-term bridge; refi at stabilization.
Listing history 22 events
-
2026-06-21days on market $125,000 Under Contract 45 DOM
-
2026-06-19days on market $125,000 Under Contract 43 DOM
-
2026-06-18days on market $125,000 Under Contract 42 DOM
-
2026-06-17days on market $125,000 Under Contract 41 DOM
-
2026-06-16days on market $125,000 Under Contract 40 DOM
-
2026-06-15days on market $125,000 Under Contract 39 DOM
-
2026-06-14days on market $125,000 Under Contract 37 DOM
-
2026-06-13days on market $125,000 Under Contract 36 DOM
-
2026-06-10days on market $125,000 Under Contract 34 DOM
-
2026-06-09days on market $125,000 Under Contract 33 DOM
-
2026-06-08days on market $125,000 Under Contract 32 DOM
-
2026-06-07days on market $125,000 Under Contract 31 DOM
-
2026-06-03days on market $125,000 Under Contract 27 DOM
-
2026-06-02days on market $125,000 Under Contract 26 DOM
-
2026-06-01days on market $125,000 Under Contract 25 DOM
-
2026-05-31days on market $125,000 Under Contract 24 DOM
-
2026-05-30days on market $125,000 Under Contract 23 DOM
-
2026-05-11historical Under Contract
-
2026-05-07$125,000 Active
-
2026-04-21historical
-
2026-02-28historical Under Contract
-
2026-01-23Active
ⓘ Source: listings_history table (triggers on properties + properties_extension) + one-shot
backfill from property_details.listing_events for pre-trigger history.
Tax reassessment forecast IL · Partial reset (capped growth)
- Current annual tax
- $374 · $31/mo
- Projected year-2 tax
- $1,606 · $134/mo
- Expected delta
- +$1,232/yr (+$103/mo · 328.9%)
ⓘ Screening estimate from a state-policy table — verify with the county assessor before closing.
Climate risk First Street
- Flood 1/10 Low FEMA zone X (unshaded) · 0% chance over 30 yrs
- Wildfire 3/10 Moderate
- Heat 4/10 Moderate 7 d/yr ≥107°F today · 19 d/yr by 30 yrs out
- Wind 2/10 Low 2% chance of damaging wind over 30 yrs
- Air quality 2/10 Low 0 unhealthy d/yr today · 1 by 30 yrs out
Nearby sold comps map
Loading sold comps map…
Walkable amenities ~0.75 mi
Loading nearby amenities…
Taxation est. · year 1
- Rental income
- $16,213
- − Mortgage interest
- −$7,002
- − Property taxes
- −$374
- − Insurance
- −$625
- − Repairs & maintenance
- −$1,297
- − Management
- −$1,297
- − Depreciation
- −$3,636
- Taxable income
- $1,981
- Est. tax owed @ 24.0%
- −$475
- After-tax cash flow
- $3,467/yr
For passive investors: Depreciation is non-cash, so a rental often shows a tax loss while cash-flowing — sheltering income. Rental losses are passive: they offset passive income freely, and up to $25,000/yr can offset ordinary (W-2) income if you actively participate and your MAGI is under $100k (phasing out to $0 by $150k); unused losses carry forward. On sale, claimed depreciation is recaptured at up to 25%, and gains may owe capital-gains tax (a 1031 exchange can defer both). Figures are a year-1 estimate at your 24.0% rate — not tax advice; consult a CPA.
Schools (NCES district)
- District
- Herrin CUSD 4
- NCES district ID
- 1718810
- Math proficiency
- 22% ▼ -11.00%
- Reading proficiency
- 27% ▼ -17.00%
- Median HH income
- $38,824
- Composite
- 20.56/100
- National rank
- #8558
- State rank
- #364 of 620 in IL
Livability — Blairsville
No livability data for this city. (Only ~50 U.S. cities are tracked.)
Census & demographics
- Census place
- Blairsville, IL
- County
- Williamson County · 38,451 people
- Metro
- Carbondale-Marion, IL
- Population (ZIP)
- 10,658
- Household income
- $70,920
- Rent vs Own
- Severe rent burden
- 240.0
Population outlook (Williamson County) Hauer SSP2
- Today (2025)
- 69,553 people
- By 2030
- 70,090 · +0.8%
- By 2040
- 70,345 · +1.1%
- By 2050
- 69,394 · -0.2%
- By 2075
- 63,590 · -8.6%
- By 2100
- 51,154 · -26.5%
Race, ethnicity, and origin ACS 2023
- Neighborhood character
- Predominantly White (89%)
- Race & ethnicity
- White 89% Two or more races 4% Hispanic / Latino 3% Asian 3% Black 2%
- Common ancestry
- Slovak 4% Italian 2% Lithuanian 2%
- Foreign-born
- 2% · Canada, Vietnam
- Languages at home
- 96% English-only · Spanish 2% Other Indo-European 1% Vietnamese 1%
Political lean MEDSL · Williamson
- 2024 margin
- Solid R (+38.8) · D 30.0% · R 68.8% · Other 1.3%
- 2008→2024 swing
- -24.0pp toward R · 2008: -14.8pp · 2024: -38.8pp
- All cycles
- 2024: R+38.8 2020: R+37.3 2016: R+41.2 2012: R+25.0 2008: R+14.8
Not yet ingested
- Civics
- —
Market trends
- HPI YoY
- ▼ -25.58%
- Current HPI
- 159.1431
- Rent YoY
- —
- Metro
- Carbondale-Marion, IL
- State GDP YoY
- ▲ 1.59%
- F500 in state
- 60
Industry mix (Fortune 500 HQ in IL)
| Industry | F500 HQs | Revenue |
|---|---|---|
| Insurance | 4 | $201B |
|
||
| Consumer Goods | 4 | $87B |
|
||
| Industrial Machinery | 3 | $64B |
|
||
| Healthcare | 2 | $55B |
|
||
| Retail / Pharmacy | 1 | $148B |
|
||
| Agriculture / Food | 1 | $86B |
|
||
Price history
5 events — show timeline
- 2026-05-11 Contingent — RMLSA as Distributed by MLS Grid
- 2026-05-07 Listed $125,000 RMLSA as Distributed by MLS Grid
- 2026-04-21 Listing Removed — RMLSA as Distributed by MLS Grid
- 2026-02-28 Contingent — RMLSA as Distributed by MLS Grid
- 2026-01-23 Listed — RMLSA as Distributed by MLS Grid
Property tax history
+7.8%/yrLatest (2025): $374 · +8.1% YoY. Source: county tax records.
Cash-flow waterfall
monthlySold comps — $/sqft
last 12 mo · ≤1 miLoading sold comps…