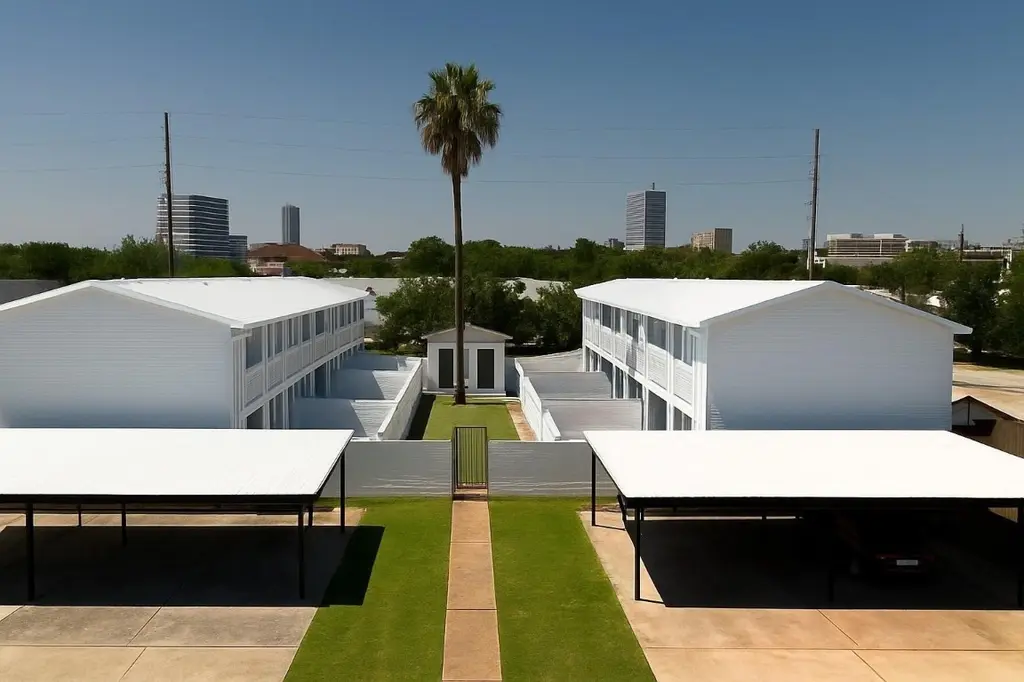
 8-Plex
5506 Beverlyhill St #8 · Houston, TX
Flood risk 6/10 · Moderate
- FEMA flood zone
- X (unshaded)
- Chance of flooding over 30 yrs
- 0.73%
- Est. flood insurance / yr
- $507 – $1,088
Fire risk 1/10 · Minimal
- Est. fire insurance / yr
- $1,222 – $2,270
Heat risk 9/10 · Severe
- Hot days now (above 109°F)
- 7 days/yr
- Hot days in 30 yrs
- 24 days/yr
Wind risk 9/10 · Severe
- Chance of severe wind over 30 yrs
- 99.0%
Air-quality risk 2/10 · Minimal
- Unhealthy air days now
- 2 days/yr
- Unhealthy air days in 30 yrs
- 2 days/yr
Risk factors via First Street. Map © Google.
Why this score? — see what drove the D grade
The composite is a weighted blend of 9 inputs, each scored 0–100. Each bar is that input's sub-score; the figure is the points it added to the 100-point composite (weight × sub-score).
- Cash flow +14.7/30.0
- ARV discount +7.5/15.0
- DSCR +4.5/10.0
- 1% rule +4.1/10.0
- Livability +3.7/5.0
- Schools +2.7/10.0
- Condition / age +2.5/5.0
- Rent growth +2.1/5.0
- Appreciation +0.0/10.0
$1,250,000
🖨 Deal sheet (PDF) 📄 Offer letter ✓ Due diligence
Multi-family units
County records classify this as Multi-Family (5+ Unit). Listing-text estimate: 8 units. confirmed
5+ unit building — per-unit beds/baths from public records are typically unavailable; the breakdown below (if shown) is an estimate from the listing text.
Listing remarks MLS
Beautiful 8-unit multifamily property in the heart of the Galleria area. Built in 1960, this well-maintained two-story complex offers spacious 2-bedroom townhome-style units, each featuring private patios or balconies, large living areas, and in-unit laundry connections in select units. Recent updates include a hard-wired camera system, full privacy fencing, and renovated parking structures. Each unit receives one covered space plus one tandem parking spot. Located just minutes from The Galleria, major shopping, dining, and transit routes, this property is ideal for investors seeking strong rental demand and long-term stability in one of Houston’s most desirable submarkets.
Key facts
- Covered space
- Full privacy fencing
- Multifamily property
Tags
Neighborhood map
What this means for you Summary
Snapshot
- This is a 8 × 2-bed/2-bath units multifamily listed at $1.25M.
Deal economics
- At list price, monthly cash flow is $316 ($4k/yr) — positive. Per door: $40/mo.
- The deal already cash-flows at list — no discount required.
- To meet the 1% rule (rent ≥ 1% of price), the offer needs to be $1.13M (9.3% below list).
- Recommended offer: $1.13M (9.3% below list) — sets the bar for 1% rule.
- Cap rate 6.6% vs local median 3.1% in Houston — top-decile yield for the area; either an underpriced asset or a hidden risk that comps aren't pricing in. Stress-test before assuming the spread holds.
Location & tenants
- Location reads 74/100 on livability (#184 in TX, #4,771 nationally) — a middle-class / working-renter tenant base. Strengths: amenities A+, cost of living A+, housing A+; Watch: crime F.
- Houston ISD (urban): math 27% / reading 35% proficiency, ranked #593 of 826 in TX (top 72%) — families likely to look elsewhere, expect single-tenant / working-renter base with shorter leases; 71% free/reduced lunch — lower-income household profile, screen leases tightly.
- Zoned schools: School At St George Place (math 34% / reading 46%, grade F, #1,514 of 4,322 statewide, top 36%, 782 students, 55% FRL); Tanglewood Middle (math 29% / reading 42%, grade F, #827 of 1,662 statewide, top 51%, 808 students, 62% FRL); Wisdom H S (math 17% / reading 16%, grade F, #1,497 of 1,632 statewide, top 92%, 2,260 students, 97% FRL) — zoned schools at 71% FRL track the district average.
- Market conditions: Rents soft (-1.7%/yr); 320 active listings in the ZIP; solid renter incomes; 29,883 units permitted in Harris County in 2024 (8,621 in 5+ unit buildings).
- At $11,341/mo this rent would consume 146% of the median local household income ($93k/yr) (locally 2132% of renters already pay >50% of income on rent) — very limited rent-growth headroom before tenants either downsize or default.
Forward outlook
- Local home prices are declining (-3.0%/yr); year-one equity from $9k of loan paydown is wiped out by about $38k of value loss. Plan a longer hold.
- Harris County population projected at +47% by 2050 — long-run rental-demand tailwind backs the buy-and-hold thesis.
Negotiation context
- It's been on market 42 days — a 3% lower offer ($1.21M) is reasonable based on typical stale-listing flexibility.
- 8 sale attempts since 10y ago with the ask held roughly flat each time — persistent listings suggest the price (not the market) is what's stuck; bring a comps-based counter.
Risks & watch-outs
- Climate carrying-cost: major flood risk; severe wind risk, 99% chance of damaging wind over 30y; extreme-heat days projected 7→24/yr by 2055 (HVAC capex compounding) — expect insurance premiums to compound above CPI over the hold.
Questions for the listing agent
- It's been on market 42 days. Have you received any prior offers? Is the seller open to a 9% concession, seller financing, or rate buy-down credit?
- Can we see the unit-by-unit rent roll, current vacancy, and any below-market leases? What's the average tenancy length?
- What capital expenditures (roof, boiler, parking lot, exteriors) have been made in the last 5 years, and what's planned in the next 2?
- Built in 1960 — when were the roof, HVAC, electrical panel, plumbing, and water heater last replaced?
- Is there a deadline driving the sale (1031 exchange, divorce, estate, relocation)? That informs how much negotiation room exists.
- Schools are D-rated, which usually means shorter tenancies and higher turnover. Who's the typical renter profile here, and what's been the actual vacancy rate?
- Crime grade is F in this area — have there been break-ins, vandalism, or insurance claims at this property in the last 3 years? What carrier currently insures it and at what premium?
- The area grade is low — what's the realistic commute time and amenity access for the typical tenant pool here? Any planned neighborhood developments (good or bad) we should know about?
- What's the average days-on-market for RENTAL listings here right now (not sales)? A rising rental-DOM trend means longer vacancies and softer asking-rent achievability than the comps imply.
- What's the recent tenant-quality profile in this submarket — average credit score on applications, eviction rate, late-payment / NSF rate, and stable-employment percentage? A property-management company in the area should have these aggregated.
- How much new apartment / multifamily construction is in the pipeline within 1–3 miles? Heavy new supply (>2% of stock underway) typically softens rents 12–24 months out; light construction supports rent growth.
Investment metrics
- 1% rule
- 0.91% ✗
- Cap rate
- 6.60%
- Cash-on-cash
- 1.08%
- DSCR
- 1.05
- GRM
- 9.2
CMA / ARV
- ARV (median comp)
- $1,250,000
- List price
- $1,250,000
- Delta
- —
- Verdict
- FAIR
- Comps
- 1 within 2.0 mi
Show comp detail 1 sale within ~0.75 mi
| Address | Dist | Beds/Ba | Sqft | Sold | Price | $/sf | Match |
|---|---|---|---|---|---|---|---|
| 5922 Fairdale Ln | 0.57mi | 8/5.0 | 4,942 (+10%) | 8mo | $799,000 | $162 | 50 |
Match score weights: distance 35% · size 25% · config 20% · recency 20%. Top-matched comps best support the ARV.
Projected returns pro-forma
-3.0% appreciation · 0.0% rent growth · sell at horizon
- IRR
- -18.0%
- Equity multiple
- 0.38×
- Total profit
- $-215,485
- Equity at exit
- $186,379
- IRR
- -17.4%
- Equity multiple
- 0.17×
- Total profit
- $-289,456
- Equity at exit
- $108,077
Cash invested: $350,000 (down + closing). Projections, not guarantees.
Landlord ↔ Tenant lean methodology
- Overall (STATE)
- 87 Strongly Landlord-Friendly
- State Texas
- 87 Strongly Landlord-Friendly · R+5
- County
- — inherits STATE
- City
- — inherits STATE
ZIP-level market 77056
- Rents YoY
- -1.7%
- Active inventory
- 320
- Price-to-rent
- 73.5×
Monthly cashflow live
- Estimated rent
- $11,341 high interval (Pro) →
- Mortgage (P&I)
- −$6,555
- Tax from tax record
- −$1,567 /mo · $18,808/yr
- Insurance
- −$521
- HOA
- −$0
- Vacancy / Maint / Mgmt
- −$2,382
- Net cashflow
- $316
Break-even live
Sensitivity live
| Price | -10% $1,024 | -5% $670 | +0% $316 | +5% $-38 | +10% $-392 |
|---|---|---|---|---|---|
| Rent | -10% $-580 | -5% $-132 | +0% $316 | +5% $764 | +10% $1,212 |
| Rate | -1.0pp $946 | -0.5pp $634 | base $316 | +0.5pp $-8 | +1.0pp $-337 |
8-unit breakdown (identical units grouped — click to expand)
| Units | Beds | Baths | Est. rent |
|---|---|---|---|
| 8× units | 2 | 2 | $11,344 |
| #1 | 2 | 2 | $1,418 |
| #2 | 2 | 2 | $1,418 |
| #3 | 2 | 2 | $1,418 |
| #4 | 2 | 2 | $1,418 |
| #5 | 2 | 2 | $1,418 |
| #6 | 2 | 2 | $1,418 |
| #7 | 2 | 2 | $1,418 |
| #8 | 2 | 2 | $1,418 |
| Total (8 units) | $11,341 | ||
UW: 25.0% down · 7.5% · 30yr · 1.5% tax · 5.0% vac · 8.0% maint · 8.0% mgmt
Financing live
Cash to close
- Down payment
- $312,500
- Closing costs
- $37,500
- Reserves months
- —
- Total cash needed
- —
Loan-product check · same deal, 3 products live
Conventional
25% down · 7.5% · 30yr
- Down + closing
- —
- Monthly P&I
- —
- Monthly cashflow
- —
- DSCR
- —
- Eligible?
- —
Personal DTI + credit; lowest rate.
DSCR
20% down · 8.5% · 30yr
- Down + closing
- —
- Monthly P&I
- —
- Monthly cashflow
- —
- DSCR
- —
- Eligible?
- —
No personal income docs; deal must DSCR.
Hard money
10% down · 12.0% · 12mo
- Down + closing
- —
- Monthly P&I
- —
- Monthly cashflow
- —
- DSCR
- —
- Eligible?
- —
Short-term bridge; refi at stabilization.
Listing history 33 events
-
2026-05-05status Pending 688-char remark
Show marketing remark (688 chars)
Beautiful 8-unit multifamily property in the heart of the Galleria area. Built in 1960, this well-maintained two-story complex offers spacious 2-bedroom townhome-style units, each featuring private patios or balconies, large living areas, and in-unit laundry connections in select units. Recent updates include a hard-wired camera system, full privacy fencing, and renovated parking structures. Each unit receives one covered space plus one tandem parking spot. Located just minutes from The Galleria, major shopping, dining, and transit routes, this property is ideal for investors seeking strong rental demand and long-term stability in one of Houston’s most desirable submarkets.
-
2026-05-04historical $1,500
-
2026-03-24$1,250,000 Active 688-char remark
Show marketing remark (688 chars)
Beautiful 8-unit multifamily property in the heart of the Galleria area. Built in 1960, this well-maintained two-story complex offers spacious 2-bedroom townhome-style units, each featuring private patios or balconies, large living areas, and in-unit laundry connections in select units. Recent updates include a hard-wired camera system, full privacy fencing, and renovated parking structures. Each unit receives one covered space plus one tandem parking spot. Located just minutes from The Galleria, major shopping, dining, and transit routes, this property is ideal for investors seeking strong rental demand and long-term stability in one of Houston’s most desirable submarkets.
-
2026-03-24historical
Show marketing remark (688 chars)
Beautiful 8-unit multifamily property in the heart of the Galleria area. Built in 1960, this well-maintained two-story complex offers spacious 2-bedroom townhome-style units, each featuring private patios or balconies, large living areas, and in-unit laundry connections in select units. Recent updates include a hard-wired camera system, full privacy fencing, and renovated parking structures. Each unit receives one covered space plus one tandem parking spot. Located just minutes from The Galleria, major shopping, dining, and transit routes, this property is ideal for investors seeking strong rental demand and long-term stability in one of Houston’s most desirable submarkets.
-
2026-03-18$1,500
-
2026-02-15$1,325,000 Active
-
2026-01-01historical
-
2025-11-16$1,550,000 Active
-
2025-07-09soldstatus
-
2025-07-09soldstatus
-
2025-01-11historical $1,700
-
2024-12-13price $1,700
-
2024-12-11$2,000
-
2023-06-05soldstatus
-
2023-06-02soldstatus Sold
-
2023-05-16status Pending
-
2023-03-27$1,550,000 Active
-
2017-07-13soldstatus
-
2017-07-10soldstatus Sold
-
2017-06-04status Pending
-
2017-03-27status Option Pending
-
2017-03-22historical
-
2017-03-01status Active
-
2017-02-18status Option Pending
-
2017-02-16price $1,095,000
-
2017-02-14price $1,049,000
-
2017-02-11price $1,045,000
-
2017-02-08price $1,095,000
-
2016-11-15price $1,150,000
-
2016-11-13$1,100,000 Active
-
2013-09-11soldstatus
-
2005-08-23soldstatus
-
1997-08-18soldstatus
ⓘ Source: listings_history table (triggers on properties + properties_extension) + one-shot
backfill from property_details.listing_events for pre-trigger history.
Tax reassessment forecast TX · Resets to sale price
- Current annual tax
- $18,808 · $1,567/mo
- Projected year-2 tax
- $22,875 · $1,906/mo
- Expected delta
- +$4,067/yr (+$339/mo · 21.6%)
ⓘ Screening estimate from a state-policy table — verify with the county assessor before closing.
Climate risk First Street
- Flood 6/10 Major FEMA zone X (unshaded) · 73% chance over 30 yrs
- Wildfire 1/10 Low
- Heat 9/10 Extreme 7 d/yr ≥109°F today · 24 d/yr by 30 yrs out
- Wind 9/10 Extreme 99% chance of damaging wind over 30 yrs
- Air quality 2/10 Low 2 unhealthy d/yr today · 2 by 30 yrs out
Nearby sold comps map
Loading sold comps map…
Walkable amenities ~0.75 mi
Loading nearby amenities…
Taxation est. · year 1
- Rental income
- $136,092
- − Mortgage interest
- −$70,019
- − Property taxes
- −$18,808
- − Insurance
- −$6,250
- − Repairs & maintenance
- −$10,887
- − Management
- −$10,887
- − Depreciation
- −$36,364
- Taxable loss
- −$17,124
- Est. tax savings @ 24.0%
- +$4,110
- After-tax cash flow
- $7,903/yr
For passive investors: Depreciation is non-cash, so a rental often shows a tax loss while cash-flowing — sheltering income. Rental losses are passive: they offset passive income freely, and up to $25,000/yr can offset ordinary (W-2) income if you actively participate and your MAGI is under $100k (phasing out to $0 by $150k); unused losses carry forward. On sale, claimed depreciation is recaptured at up to 25%, and gains may owe capital-gains tax (a 1031 exchange can defer both). Figures are a year-1 estimate at your 24.0% rate — not tax advice; consult a CPA.
Schools (NCES district)
- District
- Houston ISD
- NCES district ID
- 4823640
- Math proficiency
- 27% ▼ -18.00%
- Reading proficiency
- 35% ▼ -6.00%
- Median HH income
- $46,054
- Composite
- 26.63/100
- National rank
- #7173
- State rank
- #593 of 826 in TX
Livability — Houston
- Score
- 74/100
- State rank
- #184
- US rank
- #4771
Category grades
Schools grade is shown separately in the Schools card above.
Census & demographics
- Census place
- Houston, TX
- County
- Harris County · 4,702,590 people
- City population
- 3,226,434
- Metro
- Houston-The Woodlands-Sugar Land, TX
- Population (ZIP)
- 22,877
- Household income
- $93,499
- Rent vs Own
- Severe rent burden
- 2132.0
Population outlook (Harris County) Hauer SSP2
- Today (2025)
- 5,571,493 people
- By 2030
- 6,089,821 · +9.3%
- By 2040
- 7,142,806 · +28.2%
- By 2050
- 8,185,864 · +46.9%
- By 2075
- 10,574,329 · +89.8%
- By 2100
- 12,109,958 · +117.4%
Race, ethnicity, and origin ACS 2023
- Neighborhood character
- Diverse neighborhood (Simpson 0.64)
- Race & ethnicity
- White 54% Hispanic / Latino 22% Asian 14% Two or more races 13% Black 8%
- Hispanic origin (detail)
- Mexican 11% Puerto Rican 1% Salvadoran 1%
- Common ancestry
- Lithuanian 3% Slovak 2% Italian 2%
- Foreign-born
- 29% · Canada, Jamaica, China
- Languages at home
- 60% English-only · Spanish 20% Other Indo-European 7% Other Asian/Pacific 2%
Political lean MEDSL · Harris
- 2024 margin
- Lean D (+5.5) · D 52.0% · R 46.4% · Other 1.6%
- 2008→2024 swing
- +3.9pp toward D · 2008: 1.6pp · 2024: 5.5pp
- All cycles
- 2024: D+5.5 2020: D+13.3 2016: D+12.4 2012: D+0.1 2008: D+1.6
Not yet ingested
- Civics
- —
Market trends
- HPI YoY
- ▼ -127.46%
- Current HPI
- 175.1726
- Rent YoY
- ▼ -1.70%
- Metro
- Houston-The Woodlands-Sugar Land, TX
- State GDP YoY
- ▲ 3.95%
- F500 in state
- 110
Industry mix (Fortune 500 HQ in TX)
| Industry | F500 HQs | Revenue |
|---|---|---|
| Energy | 16 | $1,198B |
|
||
| Technology | 5 | $198B |
|
||
| Engineering / Construction | 4 | $72B |
|
||
| Energy Services | 3 | $60B |
|
||
| Utilities | 3 | $41B |
|
||
| Healthcare | 2 | $330B |
|
||
Price history
-99.9% since first listed33 events — show timeline
- 2026-05-05 Pending — HARMLS
- 2026-05-04 Rental Removed $1,500 HARMLS
- 2026-03-24 Listing Removed — HARMLS
- 2026-03-24 Listed $1,250,000 HARMLS
- 2026-03-18 Listed for Rent $1,500 HARMLS
- 2026-02-15 Listed $1,325,000 HARMLS
- 2026-01-01 Listing Removed — HARMLS
- 2025-11-16 Listed $1,550,000 HARMLS
- 2025-07-09 Sold (Public Records) — Public Records
- 2025-07-09 Sold (Public Records) — Public Records
- 2025-01-11 Rental Removed $1,700 HARMLS
- 2024-12-13 Price Changed $1,700 HARMLS
- 2024-12-11 Listed for Rent $2,000 HARMLS
- 2023-06-05 Sold (Public Records) — Public Records
- 2023-06-02 Sold (MLS) — HARMLS
- 2023-05-16 Pending — HARMLS
- 2023-03-27 Listed $1,550,000 HARMLS
- 2017-07-13 Sold (Public Records) — Public Records
- 2017-07-10 Sold (MLS) — HARMLS
- 2017-06-04 Pending — HARMLS
- 2017-03-27 Pending — HARMLS
- 2017-03-22 Listing Removed — HARMLS
- 2017-03-01 Relisted — HARMLS
- 2017-02-18 Pending — HARMLS
- 2017-02-16 Price Changed $1,095,000 HARMLS
- 2017-02-14 Price Changed $1,049,000 HARMLS
- 2017-02-11 Price Changed $1,045,000 HARMLS
- 2017-02-08 Price Changed $1,095,000 HARMLS
- 2016-11-15 Price Changed $1,150,000 HARMLS
- 2016-11-13 Listed $1,100,000 HARMLS
- 2013-09-11 Sold (Public Records) — Public Records
- 2005-08-23 Sold (Public Records) — Public Records
- 1997-08-18 Sold (Public Records) — Public Records
Property tax history
+7.3%/yrLatest (2025): $18,808 · -39.7% YoY. Source: county tax records.
Cash-flow waterfall
monthlySold comps — $/sqft
last 12 mo · ≤1 miLoading sold comps…