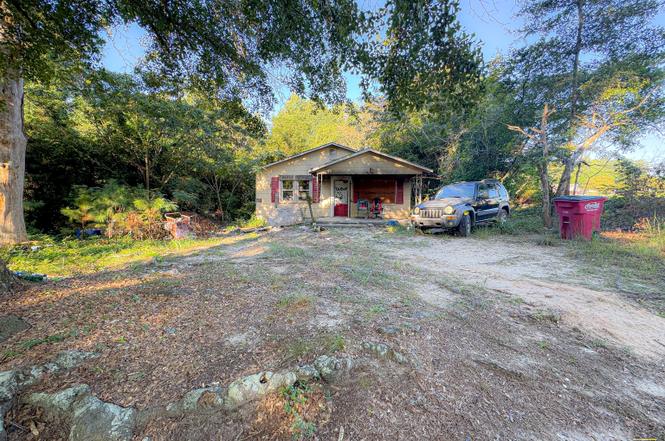
4527 Wilson Rd · Macon-Bibb County, GA
Flood risk 5/10 · Moderate
- FEMA flood zone
- X (unshaded)
- Chance of flooding over 30 yrs
- 0.66%
- Est. flood insurance / yr
- $507 – $1,088
Fire risk 4/10 · Minor
- Est. fire insurance / yr
- $963 – $1,789
Heat risk 7/10 · Major
- Hot days now (above 108°F)
- 7 days/yr
- Hot days in 30 yrs
- 17 days/yr
Wind risk 6/10 · Moderate
- Chance of severe wind over 30 yrs
- 72.0%
Air-quality risk 3/10 · Minor
- Unhealthy air days now
- 3 days/yr
- Unhealthy air days in 30 yrs
- 4 days/yr
Risk factors via First Street. Map © Google.
Why this score? — see what drove the B- grade
The composite is a weighted blend of 9 inputs, each scored 0–100. Each bar is that input's sub-score; the figure is the points it added to the 100-point composite (weight × sub-score).
- Cash flow +30.0/30.0
- 1% rule +10.0/10.0
- DSCR +10.0/10.0
- ARV discount +7.5/15.0
- Rent growth +3.8/5.0
- Livability +2.5/5.0
- Condition / age +2.5/5.0
- Schools +1.2/10.0
- Appreciation +0.0/10.0
$29,000
🖨 Deal sheet 📄 Offer letter ✓ Due diligence
Listing remarks
* Ask about Seller Financing! * Discover your next opportunity at this 2-bedroom, 1-bathroom house that's ready for your personal touch. This property sits on a generous lot that gives you plenty of space to breathe and dream up your perfect outdoor oasis. Whether you're looking to create your forever home or add a smart rental property to your portfolio, this house offers the flexibility to make it happen. The renovation possibilities are endless, and with owner financing available, your path to ownership just got a whole lot smoother. Location-wise, you're in a sweet spot. You'll be close to Middle Georgia State University's Macon Campus, making this an attractive option for those lookin
Key facts
- Generous lot
- Quality construction
- Solid foundation
Tags
Neighborhood map
What this means for you Summary
Snapshot
- This is a 2-bed/1.0-bath single-family listed at $29k.
Deal economics
- At list price, monthly cash flow is $589 ($7k/yr) — positive.
- The deal already cash-flows at list — no discount required.
- Meets the 1% rule at list price ($1k rent vs $29k).
- Cap rate 30.7% vs local median 5.4% in Macon-Bibb County — top-decile yield for the area; either an underpriced asset or a hidden risk that comps aren't pricing in. Stress-test before assuming the spread holds.
Location & tenants
- Location reads: area grade B — affects rentability + tenant quality, not the cash-flow math above.
- Bibb County (urban): math 11% / reading 18% proficiency, ranked #161 of 174 in GA (top 92%) — low school quality limits family demand, transient renter base, plan for 1-2y turnover; 75% free/reduced lunch — lower-income household profile, screen leases tightly.
- Zoned schools: Veterans Elementary School (math 3% / reading 9%, grade F, #1,154 of 1,228 statewide, top 94%, 697 students, 100% FRL); Weaver Middle School (math 5% / reading 12%, grade F, #439 of 470 statewide, top 94%, 909 students, 100% FRL); Westside High School (math 2% / reading 2%, grade F, #421 of 424 statewide, top 100%, 1,025 students, 100% FRL) — zoned schools average 100% FRL vs 75% district-wide (25 pts higher); higher-poverty schools than district average — tighter screening recommended.
- Market conditions: Rents rising fast (+5.0%/yr); 207 active listings in the ZIP; 12 comparable units currently listed for rent nearby; rentals at typical pace (median 21d on market — plan ~3-4 weeks tenant-placement turnaround); 42% of comp listings sitting > 30 days — soft ceiling on asking rent; lower-income renter base — watch delinquency; 154 units permitted in Bibb County in 2024 (0 in 5+ unit buildings).
- This rent runs 42% of the median local income ($30k/yr) — at the standard rent-burdened threshold; future hikes will face affordability resistance.
Forward outlook
- Local home prices are declining (-3.0%/yr); year-one equity from $200 of loan paydown is wiped out by about $870 of value loss. Plan a longer hold.
- Bibb County population projected at -12% by 2050 — secular population decline; favor cash flow + early exit over multi-decade hold.
- At projected returns (-3.0% appreciation + 5.0% rent growth), your $8k cash investment doubles in ~2 years — after that, you're playing with house money.
Negotiation context
- Only 13 days on market — expect competitive offers; lowballing is unlikely to land.
Risks & watch-outs
- Watch-outs: property tax is 2.8% of price; built in 1953 — expect roof / HVAC / electrical / plumbing capex.
- Climate carrying-cost: moderate flood risk; major wind risk, 72% chance of damaging wind over 30y; extreme-heat days projected 7→17/yr by 2055 (HVAC capex compounding) — expect insurance premiums to compound above CPI over the hold.
Questions for the listing agent
- Built in 1953 — when were the roof, HVAC, electrical panel, plumbing, and water heater last replaced?
- Property tax is high relative to price — has the assessment been appealed recently, and will the sale trigger a re-assessment?
- Is there a deadline driving the sale (1031 exchange, divorce, estate, relocation)? That informs how much negotiation room exists.
- What's the average days-on-market for RENTAL listings here right now (not sales)? A rising rental-DOM trend means longer vacancies and softer asking-rent achievability than the comps imply.
- What's the recent tenant-quality profile in this submarket — average credit score on applications, eviction rate, late-payment / NSF rate, and stable-employment percentage? A property-management company in the area should have these aggregated.
- How much new for-sale + rental construction is in the pipeline within 1–3 miles? Heavy new supply typically softens prices + rents 12–24 months out; constrained supply supports both.
Investment metrics
- 1% rule
- 3.58% ✓
- Cap rate
- 30.66%
- Cash-on-cash
- 87.03%
- DSCR
- 4.87
- GRM
- 2.3
CMA / ARV
- ARV (on-the-fly)
- $159,296
- Comps found
- 12
Show comp detail 12 sales within ~0.75 mi
| Address | Dist | Beds/Ba | Sqft | Sold | Price | $/sf | Match |
|---|---|---|---|---|---|---|---|
| 4564 Brookhaven Rd | 0.11mi | 3/1.0 (+1) | 1,250 (+3%) | 8mo | $72,500 | $58 | 79 |
| 4559 Massey Rd | 0.17mi | 3/2.0 (+1) | 1,192 (-2%) | 6mo | $135,000 | $113 | 75 |
| 4622 Wilson Rd | 0.12mi | 3/2.0 (+1) | 1,092 (-10%) | 5mo | $149,500 | $137 | 64 |
| 4450 Massey Rd | 0.19mi | 3/2.0 (+1) | 1,305 (+7%) | 11mo | $175,000 | $134 | 61 |
| 4450 Massey Rd | 0.19mi | 3/2.0 (+1) | 1,305 (+7%) | 11mo | $175,000 | $134 | 61 |
| 4801 Wilson Rd | 0.41mi | 3/2.0 (+1) | 1,276 (+5%) | 10mo | $179,900 | $141 | 55 |
| 4453 Pharr Ave | 0.56mi | 3/2.0 (+1) | 1,141 (-6%) | 1mo | $150,000 | $131 | 54 |
| 4461 Euell Ave | 0.65mi | 3/1.0 (+1) | 1,164 (-4%) | 5mo | $73,000 | $63 | 53 |
| 4819 Massey Rd | 0.46mi | 3/2.0 (+1) | 1,104 (-9%) | 11mo | $80,000 | $72 | 44 |
| 4782 Two Oak Dr | 0.71mi | 3/2.0 (+1) | 1,296 (+7%) | 10mo | $149,000 | $115 | 39 |
| 4447 Pharr Ave | 0.55mi | 3/3.0 (+1) | 1,350 (+11%) | 10mo | $145,000 | $107 | 35 |
| 4263 Vallie Dr | 0.68mi | 3/1.5 (+1) | 1,040 (-14%) | 12mo | $145,000 | $139 | 27 |
Match score weights: distance 35% · size 25% · config 20% · recency 20%. Top-matched comps best support the ARV.
Projected returns pro-forma
-3.0% appreciation · 5.03% rent growth · sell at horizon
- IRR
- 90.0%
- Equity multiple
- 5.31×
- Total profit
- $35,011
- Equity at exit
- $4,324
- IRR
- 93.4%
- Equity multiple
- 11.86×
- Total profit
- $88,193
- Equity at exit
- $2,507
Cash invested: $8,120 (down + closing). Projections, not guarantees.
Landlord ↔ Tenant lean methodology
- Overall (STATE)
- 90 Strongly Landlord-Friendly
- State Georgia
- 90 Strongly Landlord-Friendly · R+3
- County
- — inherits STATE
- City
- — inherits STATE
ZIP-level market 31206
- Rents YoY
- 5.0%
- Active inventory
- 207
- Price-to-rent
- 2.3×
Monthly cashflow live
- Estimated rent
- $1,039 high interval (Pro) →
- Mortgage (P&I)
- −$152
- Tax from tax record
- −$68 /mo · $817/yr
- Insurance
- −$12
- HOA
- −$0
- Vacancy / Maint / Mgmt
- −$218
- Net cashflow
- $589
Break-even live
UW: 25.0% down · 7.5% · 30yr · 1.5% tax · 5.0% vac · 8.0% maint · 8.0% mgmt
Financing live
Cash to close
- Down payment
- $7,250
- Closing costs
- $870
- Reserves months
- —
- Total cash needed
- —
Loan-product check · same deal, 3 products live
Conventional
25% down · 7.5% · 30yr
- Down + closing
- —
- Monthly P&I
- —
- Monthly cashflow
- —
- DSCR
- —
- Eligible?
- —
Personal DTI + credit; lowest rate.
DSCR
20% down · 8.5% · 30yr
- Down + closing
- —
- Monthly P&I
- —
- Monthly cashflow
- —
- DSCR
- —
- Eligible?
- —
No personal income docs; deal must DSCR.
Hard money
10% down · 12.0% · 12mo
- Down + closing
- —
- Monthly P&I
- —
- Monthly cashflow
- —
- DSCR
- —
- Eligible?
- —
Short-term bridge; refi at stabilization.
Rent comps 12 comps
| Address | Beds | Baths | Sqft | Rent | $/sqft | DOM | Units | Dist |
|---|---|---|---|---|---|---|---|---|
| 159 Steven Dr Macon, GA | 2.0–4.0 | 2.0 | 1185 | $869 | $0.73 | 43d | 1 | 0.27mi |
| 4836 Mamie Carter Dr Macon, GA | 2.0 | 1.5 | 1000 | $1,200 | $1.20 | 13d | 1 | 0.93mi |
| 4158 Log Cabin Dr Macon, GA | 3.0 | 1.5 | 1380 | $1,375 | $1.00 | 21d | 1 | 0.94mi |
| 4151 Log Cabin Dr Macon, GA | 1.0–2.0 | 1.0–2.0 | 836 | $1,434 | $1.72 | 43d | 1 | 0.95mi |
| 4704 High Oak Dr Macon, GA | 3.0 | 2.0 | 1200 | $1,300 | $1.08 | 13d | 1 | 0.97mi |
| 1000 Crystal Lake Cir Macon, GA | 3.0 | 2.0 | 1312 | $1,063 | $0.81 | 43d | 1 | 1.11mi |
| 4406 Chambers Rd Unit B-06 Macon, GA | 2.0 | 1.0 | 925 | $899 | $0.97 | 43d | 1 | 1.15mi |
| 4406 Chambers Rd Apt E16 Macon, GA | 2.0 | 1.0 | 925 | $899 | $0.97 | 21d | 1 | 1.15mi |
| 1655 N Atwood Dr Unit 5 Macon, GA | 1.0 | 1.0 | 750 | $850 | $1.13 | 21d | 1 | 1.31mi |
| 4053 Log Cabin Dr Unit B3 Macon, GA | 2.0 | 1.0 | 950 | $749 | $0.79 | 21d | 1 | 1.46mi |
| 4995 Bloomfield Rd Macon, GA | 2.0 | 1.5 | 900 | $997 | $1.11 | 21d | 1 | 1.50mi |
| 1208 Fourth Ave W Macon, GA | 3.0 | 1.0 | 960 | $825 | $0.86 | 43d | 1 | 1.50mi |
Listing history 4 events
-
2025-09-25status Under Contract
-
2025-09-11$29,000 New
-
2006-01-03soldstatus $38,500
-
2003-04-14soldstatus $58,000
ⓘ Source: listings_history table (triggers on properties + properties_extension) + one-shot
backfill from property_details.listing_events for pre-trigger history.
Tax reassessment forecast GA · Resets to sale price
- Current annual tax
- $817 · $68/mo
- Projected year-2 tax
- $817 · $68/mo
- Expected delta
- $0/yr ($0/mo · 0.0%)
ⓘ Screening estimate from a state-policy table — verify with the county assessor before closing.
Climate risk First Street
- Flood 5/10 Major FEMA zone X (unshaded) · 66% chance over 30 yrs
- Wildfire 4/10 Moderate
- Heat 7/10 Severe 7 d/yr ≥108°F today · 17 d/yr by 30 yrs out
- Wind 6/10 Major 72% chance of damaging wind over 30 yrs
- Air quality 3/10 Moderate 3 unhealthy d/yr today · 4 by 30 yrs out
Nearby sold comps map
Loading sold comps map…
Walkable amenities ~0.75 mi
Loading nearby amenities…
Taxation est. · year 1
- Rental income
- $12,473
- − Mortgage interest
- −$1,624
- − Property taxes
- −$817
- − Insurance
- −$145
- − Repairs & maintenance
- −$998
- − Management
- −$998
- − Depreciation
- −$844
- Taxable income
- $7,048
- Est. tax owed @ 24.0%
- −$1,691
- After-tax cash flow
- $5,376/yr
For passive investors: Depreciation is non-cash, so a rental often shows a tax loss while cash-flowing — sheltering income. Rental losses are passive: they offset passive income freely, and up to $25,000/yr can offset ordinary (W-2) income if you actively participate and your MAGI is under $100k (phasing out to $0 by $150k); unused losses carry forward. On sale, claimed depreciation is recaptured at up to 25%, and gains may owe capital-gains tax (a 1031 exchange can defer both). Figures are a year-1 estimate at your 24.0% rate — not tax advice; consult a CPA.
Schools (NCES district)
- District
- Bibb County
- NCES district ID
- 1300420
- Math proficiency
- 11% ▼ -14.00%
- Reading proficiency
- 18% ▼ -11.00%
- Median HH income
- $37,426
- Composite
- 12.13/100
- National rank
- #9654
- State rank
- #161 of 174 in GA
Livability — Macon-Bibb County
No livability data for this city. (Only ~50 U.S. cities are tracked.)
Census & demographics
- Census place
- Macon-Bibb County, GA
- County
- Bibb County · 164,332 people
- City population
- 143,186
- Metro
- Macon-Bibb County, GA
- Population (ZIP)
- 24,310
- Household income
- $30,042
- Rent vs Own
- Severe rent burden
- 1335.0
Population outlook (Bibb County) Hauer SSP2
- Today (2025)
- 148,772 people
- By 2030
- 145,904 · -1.9%
- By 2040
- 139,404 · -6.3%
- By 2050
- 131,603 · -11.5%
- By 2075
- 111,050 · -25.4%
- By 2100
- 83,346 · -44.0%
Race, ethnicity, and origin ACS 2023
- Neighborhood character
- Predominantly Black (76%)
- Race & ethnicity
- Black 76% White 12% Hispanic / Latino 8% Two or more races 4%
- Hispanic origin (detail)
- Mexican 5% Puerto Rican 1%
- Common ancestry
- Lithuanian 1% Italian 1%
- Foreign-born
- 4% · Canada
- Languages at home
- 91% English-only · Spanish 8%
Political lean MEDSL · Bibb
- 2024 margin
- Strong D (+22.4) · D 61.0% · R 38.5%
- 2008→2024 swing
- +4.4pp toward D · 2008: 18.0pp · 2024: 22.4pp
- All cycles
- 2024: D+22.4 2020: D+23.8 2016: D+20.2 2012: D+20.0 2008: D+18.0
Not yet ingested
- Civics
- —
Market trends
- HPI YoY
- ▼ -80.17%
- Current HPI
- 148.6765
- Rent YoY
- ▲ 5.03%
- Metro
- Macon-Bibb County, GA
- State GDP YoY
- ▲ 2.66%
- F500 in state
- 28
Industry mix (Fortune 500 HQ in GA)
| Industry | F500 HQs | Revenue |
|---|---|---|
| Paper / Packaging | 2 | $29B |
|
||
| Retail | 1 | $160B |
|
||
| Transportation / Logistics | 1 | $91B |
|
||
| Airlines | 1 | $62B |
|
||
| Consumer Goods | 1 | $47B |
|
||
| Utilities | 1 | $25B |
|
||
Price history
-50.0% since first listed4 events — show timeline
- 2025-09-25 Pending — GAMLS
- 2025-09-11 Listed $29,000 GAMLS
- 2006-01-03 Sold (Public Records) $38,500 Public Records
- 2003-04-14 Sold (Public Records) $58,000 Public Records
Property tax history
+11.9%/yrLatest (2025): $817 · -8.1% YoY. Source: county tax records.
Cash-flow waterfall
monthlySold comps — $/sqft
last 12 mo · ≤1 miLoading sold comps…