 Duplex
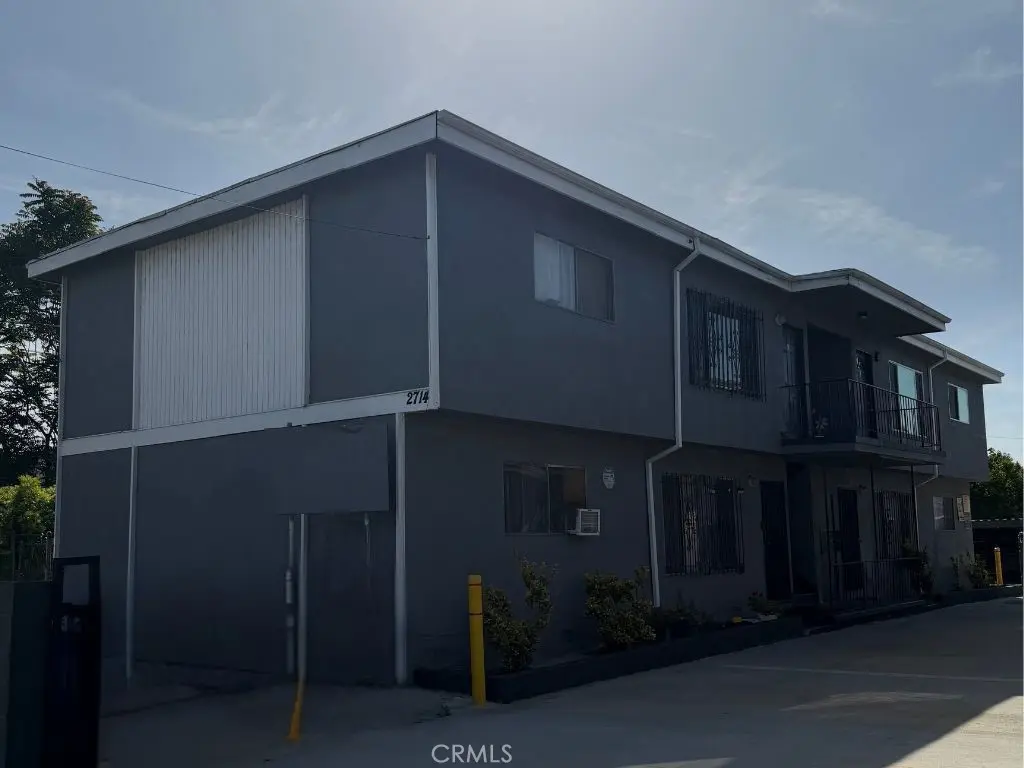
2714 Queen · Los Angeles, CA
Flood risk 1/10 · Minimal
- FEMA flood zone
- X (unshaded)
- Chance of flooding over 30 yrs
- 0.0%
- Est. flood insurance / yr
- $507 – $1,088
Fire risk 1/10 · Minimal
- Est. fire insurance / yr
- $659 – $1,223
Heat risk 6/10 · Moderate
- Hot days now (above 94°F)
- 7 days/yr
- Hot days in 30 yrs
- 22 days/yr
Wind risk 1/10 · Minimal
- Chance of severe wind over 30 yrs
- —
Air-quality risk 6/10 · Moderate
- Unhealthy air days now
- 11 days/yr
- Unhealthy air days in 30 yrs
- 12 days/yr
Risk factors via First Street. Map © Google.
Why this score? — see what drove the D- grade
The composite is a weighted blend of 9 inputs, each scored 0–100. Each bar is that input's sub-score; the figure is the points it added to the 100-point composite (weight × sub-score).
- Cash flow +14.6/30.0
- DSCR +4.4/10.0
- ARV discount +4.3/15.0
- Schools +3.6/10.0
- Livability +3.4/5.0
- 1% rule +3.0/10.0
- Rent growth +2.8/5.0
- Condition / age +2.5/5.0
- Appreciation +0.0/10.0
$1,395,000
🖨 Deal sheet 📄 Offer letter ✓ Due diligence
Multi-family units
County records classify this as Multi-Family (2-4 Unit). Listing-text estimate: 2 units. confirmed
Listing remarks
Four-unit multifamily property located in the Elysian Valley neighborhood of Los Angeles near the LA River corridor. The building features four 2-bedroom, 1-bath units with practical and efficient layouts. Two units have been fully renovated with updated interiors reflecting a contemporary design style. Renovations include modern kitchen cabinetry, quartz countertops, subway tile backsplash, stainless steel appliances, updated plumbing fixtures, and coordinated hardware. Bathrooms have been refreshed with updated vanities, modern tile work, and clean finishes. Wide-plank flooring and recessed lighting contribute to a cohesive interior presentation. The remaining units maintain functional fl
Key facts
- La river corridor
- Quartz countertops
- Multifamily property
Tags
Property features AI
Finance
- Other: Average 2-bedroom area listed as 850 (unit area); Average unit area and other per-unit area fields noted but not fully detailed
- Financial info: Total actual rent reported: $90,887; Pest control expense listed (~$600); Licenses expense listed (~$427); All 4 units currently leased; Vacancy allowance reported as 0
- HOA & community: Rent controlled
Exterior
- Parking: 4 total parking spaces; Each unit has 1 garage space (detached/attached type not specified)
- Utilities: Public sewer; District/Public water; Natural gas connected; Electricity connected; Cable connected
- Home design: Multi-unit property with 4 units in one building; 2 stories; No ADU
- Construction: Total building area approximately 3,400; Year built source: Assessor
- Exterior features: No pool; Neighborhood amenities include biking, dog park, sidewalks, and a park
Interior
- Bedrooms: Total of 8 bedrooms across the building (4 units)
- Bathrooms: Total of 4 full bathrooms across the building (4 units)
- Interior features: Front exterior entry; Two-story building; Attached property; One common wall
- Laundry & utility: No on-site laundry listed; Four separate gas meters; Four separate electric meters
Neighborhood map
What this means for you Summary
Snapshot
- This is a 2 × 4-bed/?-bath units multifamily listed at $1.40M.
Deal economics
- At list price, monthly cash flow is $328 ($4k/yr) — positive. Per door: $164/mo.
- The deal already cash-flows at list — no discount required.
- To meet the 1% rule (rent ≥ 1% of price), the offer needs to be $1.12M (19.6% below list).
- Recommended offer: $1.12M (19.6% below list) — sets the bar for 1% rule.
- Cap rate 6.6% vs local median 2.1% in Los Angeles — top-decile yield for the area; either an underpriced asset or a hidden risk that comps aren't pricing in. Stress-test before assuming the spread holds.
Location & tenants
- Location reads 68/100 on livability (#273 in CA) — a middle-class / working-renter tenant base. Strengths: amenities A+, commute A+, employment B; Watch: health & safety C-, schools D+, crime F.
- Los Angeles Unified (urban): math 29% / reading 54% proficiency, ranked #223 of 517 in CA (top 43%) — families likely to look elsewhere, expect single-tenant / working-renter base with shorter leases; 67% free/reduced lunch — lower-income household profile, screen leases tightly.
- Market conditions: Rents rising (+1.0%/yr); 102 active listings in the ZIP; high-income renter base; 19,697 units permitted in Los Angeles County in 2024 (9,426 in 5+ unit buildings).
- At $11,221/mo this rent would consume 118% of the median local household income ($114k/yr) (locally 1726% of renters already pay >50% of income on rent) — very limited rent-growth headroom before tenants either downsize or default.
Forward outlook
- Local home prices are declining (-3.0%/yr); year-one equity from $10k of loan paydown is wiped out by about $42k of value loss. Plan a longer hold.
- Los Angeles County population projected at +9% by 2050 — modest demand growth; plan on rents tracking national, not racing it.
Negotiation context
- It's been on market 33 days — a 3% lower offer ($1.35M) is reasonable based on typical stale-listing flexibility.
- 4 sale attempts since 21y ago with the ask held roughly flat each time — persistent listings suggest the price (not the market) is what's stuck; bring a comps-based counter.
- Current owner paid $458k; list at $1.40M implies a 205% gain — meaningful room to come down on a strong offer.
Risks & watch-outs
- Climate carrying-cost: extreme-heat days projected 7→22/yr by 2055 (HVAC capex compounding) — expect insurance premiums to compound above CPI over the hold.
Questions for the listing agent
- It's been on market 33 days. Have you received any prior offers? Is the seller open to a 20% concession, seller financing, or rate buy-down credit?
- Can we see the unit-by-unit rent roll, current vacancy, and any below-market leases? What's the average tenancy length?
- What capital expenditures (roof, boiler, parking lot, exteriors) have been made in the last 5 years, and what's planned in the next 2?
- Built in 1964 — when were the roof, HVAC, electrical panel, plumbing, and water heater last replaced?
- Is there a deadline driving the sale (1031 exchange, divorce, estate, relocation)? That informs how much negotiation room exists.
- Schools are D-rated, which usually means shorter tenancies and higher turnover. Who's the typical renter profile here, and what's been the actual vacancy rate?
- Crime grade is F in this area — have there been break-ins, vandalism, or insurance claims at this property in the last 3 years? What carrier currently insures it and at what premium?
- The area grade is low — what's the realistic commute time and amenity access for the typical tenant pool here? Any planned neighborhood developments (good or bad) we should know about?
- What's the average days-on-market for RENTAL listings here right now (not sales)? A rising rental-DOM trend means longer vacancies and softer asking-rent achievability than the comps imply.
- What's the recent tenant-quality profile in this submarket — average credit score on applications, eviction rate, late-payment / NSF rate, and stable-employment percentage? A property-management company in the area should have these aggregated.
- How much new apartment / multifamily construction is in the pipeline within 1–3 miles? Heavy new supply (>2% of stock underway) typically softens rents 12–24 months out; light construction supports rent growth.
Investment metrics
- 1% rule
- 0.80% ✗
- Cap rate
- 6.57%
- Cash-on-cash
- 1.01%
- DSCR
- 1.04
- GRM
- 10.4
CMA / ARV
- ARV (on-the-fly)
- $1,301,984
- Comps found
- 3
Show comp detail 3 sales within ~0.75 mi
| Address | Dist | Beds/Ba | Sqft | Sold | Price | $/sf | Match |
|---|---|---|---|---|---|---|---|
| 2368 Allesandro St | 0.53mi | 8/4.0 | 3,840 (+8%) | 18mo | $945,000 | $246 | 46 |
| 2106 Valentine St | 0.71mi | 7/4.0 (-1) | 3,258 (-8%) | 13mo | $1,525,000 | $468 | 38 |
| 2916 Marsh St | 0.51mi | 7/4.0 (-1) | 3,088 (-13%) | 24mo | $1,135,000 | $368 | 30 |
Match score weights: distance 35% · size 25% · config 20% · recency 20%. Top-matched comps best support the ARV.
Projected returns pro-forma
-3.0% appreciation · 1.02% rent growth · sell at horizon
- IRR
- -16.7%
- Equity multiple
- 0.42×
- Total profit
- $-227,619
- Equity at exit
- $207,999
- IRR
- -12.2%
- Equity multiple
- 0.33×
- Total profit
- $-259,861
- Equity at exit
- $120,614
Cash invested: $390,600 (down + closing). Projections, not guarantees.
Landlord ↔ Tenant lean methodology
- Overall (CITY)
- 0 Strongly Tenant-Friendly
- State California
- 18 Strongly Tenant-Friendly · D+13
- County
- — inherits STATE
- City Los Angeles
- 0 Strongly Tenant-Friendly · D+22
ZIP-level market 90039
- Rents YoY
- 1.0%
- Active inventory
- 102
- Price-to-rent
- 20.7×
Monthly cashflow live
- Estimated rent
- $11,221 high interval (Pro) →
- Mortgage (P&I)
- −$7,316
- Tax from tax record
- −$640 /mo · $7,683/yr
- Insurance
- −$581
- HOA
- −$0
- Vacancy / Maint / Mgmt
- −$2,356
- Net cashflow
- $328
Break-even live
2-unit breakdown (identical units grouped — click to expand)
| Units | Beds | Baths | Est. rent |
|---|---|---|---|
| 2× units | 4 | — | $11,220 |
| #1 | 4 | — | $5,610 |
| #2 | 4 | — | $5,610 |
| Total (2 units) | $11,221 | ||
UW: 25.0% down · 7.5% · 30yr · 1.5% tax · 5.0% vac · 8.0% maint · 8.0% mgmt
Financing live
Cash to close
- Down payment
- $348,750
- Closing costs
- $41,850
- Reserves months
- —
- Total cash needed
- —
Loan-product check · same deal, 3 products live
Conventional
25% down · 7.5% · 30yr
- Down + closing
- —
- Monthly P&I
- —
- Monthly cashflow
- —
- DSCR
- —
- Eligible?
- —
Personal DTI + credit; lowest rate.
DSCR
20% down · 8.5% · 30yr
- Down + closing
- —
- Monthly P&I
- —
- Monthly cashflow
- —
- DSCR
- —
- Eligible?
- —
No personal income docs; deal must DSCR.
Hard money
10% down · 12.0% · 12mo
- Down + closing
- —
- Monthly P&I
- —
- Monthly cashflow
- —
- DSCR
- —
- Eligible?
- —
Short-term bridge; refi at stabilization.
Listing history 24 events
-
2026-06-18days on market $1,395,000 Active 33 DOM
-
2026-06-17days on market $1,395,000 Active 32 DOM
-
2026-06-16days on market $1,395,000 Active 31 DOM
-
2026-06-15days on market $1,395,000 Active 30 DOM
-
2026-06-13days on market $1,395,000 Active 28 DOM
-
2026-06-09days on market $1,395,000 Active 24 DOM
-
2026-06-08days on market $1,395,000 Active 23 DOM
-
2026-06-07days on market $1,395,000 Active 22 DOM
-
2026-06-04days on market $1,395,000 Active 19 DOM
-
2026-06-03days on market $1,395,000 Active 18 DOM
-
2026-06-02days on market $1,395,000 Active 17 DOM
-
2026-06-01days on market $1,395,000 Active 16 DOM
-
2026-05-31days on market $1,395,000 Active 15 DOM
-
2026-05-16$1,395,000 Active
-
2026-03-31historical
-
2026-02-16price $1,425,000
-
2025-11-03$1,500,000 Active
-
2022-08-25price $2,249
-
2022-07-14historical
-
2022-03-16$1,350,000 Active
-
2010-08-30soldstatus $458,000
-
2007-03-02soldstatus $700,000
-
2005-10-08historical
-
2005-07-08
ⓘ Source: listings_history table (triggers on properties + properties_extension) + one-shot
backfill from property_details.listing_events for pre-trigger history.
Tax reassessment forecast CA · Resets to sale price
- Current annual tax
- $7,683 · $640/mo
- Projected year-2 tax
- $10,602 · $884/mo
- Expected delta
- +$2,919/yr (+$243/mo · 38.0%)
ⓘ Screening estimate from a state-policy table — verify with the county assessor before closing.
Climate risk First Street
- Flood 1/10 Low FEMA zone X (unshaded) · 0% chance over 30 yrs
- Wildfire 1/10 Low
- Heat 6/10 Major 7 d/yr ≥94°F today · 22 d/yr by 30 yrs out
- Wind 1/10 Low
- Air quality 6/10 Major 11 unhealthy d/yr today · 12 by 30 yrs out
Nearby sold comps map
Loading sold comps map…
Walkable amenities ~0.75 mi
Loading nearby amenities…
Taxation est. · year 1
- Rental income
- $134,652
- − Mortgage interest
- −$78,142
- − Property taxes
- −$7,683
- − Insurance
- −$6,975
- − Repairs & maintenance
- −$10,772
- − Management
- −$10,772
- − Depreciation
- −$40,582
- Taxable loss
- −$20,274
- Est. tax savings @ 24.0%
- +$4,866
- After-tax cash flow
- $8,796/yr
For passive investors: Depreciation is non-cash, so a rental often shows a tax loss while cash-flowing — sheltering income. Rental losses are passive: they offset passive income freely, and up to $25,000/yr can offset ordinary (W-2) income if you actively participate and your MAGI is under $100k (phasing out to $0 by $150k); unused losses carry forward. On sale, claimed depreciation is recaptured at up to 25%, and gains may owe capital-gains tax (a 1031 exchange can defer both). Figures are a year-1 estimate at your 24.0% rate — not tax advice; consult a CPA.
Schools (NCES district)
- District
- Los Angeles Unified
- NCES district ID
- 0622710
- Math proficiency
- 29% ▼ -4.00%
- Reading proficiency
- 54% ▲ 10.00%
- Median HH income
- $50,403
- Composite
- 35.67/100
- National rank
- #4875
- State rank
- #223 of 517 in CA
Livability — Los Angeles
- Score
- 68/100
- State rank
- #273
- US rank
- #9237
Category grades
Schools grade is shown separately in the Schools card above.
Census & demographics
- Census place
- Los Angeles, CA
- County
- Los Angeles County · 9,444,647 people
- City population
- 3,838,149
- Metro
- Los Angeles-Long Beach-Anaheim, CA
- Population (ZIP)
- 28,884
- Household income
- $113,818
- Rent vs Own
- Severe rent burden
- 1726.0
Population outlook (Los Angeles County) Hauer SSP2
- Today (2025)
- 10,940,515 people
- By 2030
- 11,256,481 · +2.9%
- By 2040
- 11,729,929 · +7.2%
- By 2050
- 11,948,407 · +9.2%
- By 2075
- 11,818,114 · +8.0%
- By 2100
- 10,842,928 · -0.9%
Race, ethnicity, and origin ACS 2023
- Neighborhood character
- Diverse neighborhood (Simpson 0.69)
- Race & ethnicity
- White 42% Hispanic / Latino 31% Asian 19% Two or more races 14% Black 2%
- Hispanic origin (detail)
- Mexican 17%
- Common ancestry
- Romanian 2% Italian 2% Scotch-Irish 2%
- Foreign-born
- 30% · Canada, China, South Korea
- Languages at home
- 59% English-only · Spanish 25% Tagalog/Filipino 8% Other Indo-European 2%
Political lean MEDSL · Los Angeles
- 2024 margin
- Solid D (+32.9) · D 64.8% · R 31.9% · Other 3.3%
- 2008→2024 swing
- -7.4pp toward R · 2008: 40.4pp · 2024: 32.9pp
- All cycles
- 2024: D+32.9 2020: D+44.2 2016: D+48.0 2012: D+40.0 2008: D+40.4
Not yet ingested
- Civics
- —
Market trends
- HPI YoY
- ▼ -987.09%
- Current HPI
- 469.7964
- Rent YoY
- ▲ 1.02%
- Metro
- Los Angeles-Long Beach-Anaheim, CA
- State GDP YoY
- ▲ 3.21%
- F500 in state
- 116
Industry mix (Fortune 500 HQ in CA)
| Industry | F500 HQs | Revenue |
|---|---|---|
| Technology | 27 | $1,492B |
|
||
| Financial Services | 3 | $174B |
|
||
| Retail | 3 | $44B |
|
||
| Insurance | 3 | $26B |
|
||
| Media / Entertainment | 2 | $115B |
|
||
| Pharmaceuticals / Biotech | 2 | $62B |
|
||
Price history
+99.3% since first listed11 events — show timeline
- 2026-05-16 Listed $1,395,000 CRMLS
- 2026-03-31 Listing Removed — CRMLS
- 2026-02-16 Price Changed $1,425,000 CRMLS
- 2025-11-03 Listed $1,500,000 CRMLS
- 2022-08-25 Price Changed $2,249 RENT.
- 2022-07-14 Listing Removed — CRMLS
- 2022-03-16 Listed $1,350,000 CRMLS
- 2010-08-30 Sold (Public Records) $458,000 Public Records
- 2007-03-02 Sold (Public Records) $700,000 Public Records
- 2005-10-08 Delisted — TheMLS
- 2005-07-08 Listed — TheMLS
Property tax history
-0.8%/yrLatest (2025): $7,683 · +1.6% YoY. Source: county tax records.
Cash-flow waterfall
monthlySold comps — $/sqft
last 12 mo · ≤1 miLoading sold comps…