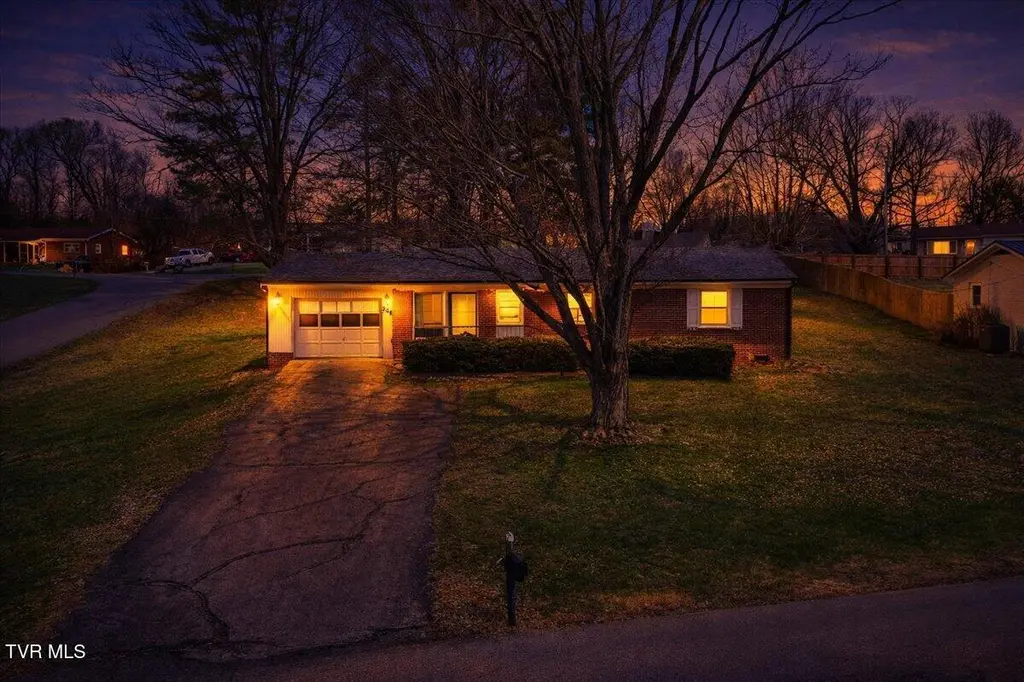
208 Lynfield Rd · Bristol, TN
Flood risk 1/10 · Minimal
- FEMA flood zone
- X (unshaded)
- Chance of flooding over 30 yrs
- 0.0%
- Est. flood insurance / yr
- $507 – $1,088
Fire risk 4/10 · Minor
- Est. fire insurance / yr
- $949 – $1,763
Heat risk 4/10 · Minor
- Hot days now (above 98°F)
- 7 days/yr
- Hot days in 30 yrs
- 20 days/yr
Wind risk 2/10 · Minimal
- Chance of severe wind over 30 yrs
- —
Air-quality risk 2/10 · Minimal
- Unhealthy air days now
- 1 days/yr
- Unhealthy air days in 30 yrs
- 2 days/yr
Risk factors via First Street. Map © Google.
Why this score? — see what drove the D grade
The composite is a weighted blend of 9 inputs, each scored 0–100. Each bar is that input's sub-score; the figure is the points it added to the 100-point composite (weight × sub-score).
- Cash flow +14.3/30.0
- ARV discount +7.3/15.0
- DSCR +4.3/10.0
- Livability +3.7/5.0
- 1% rule +3.1/10.0
- Schools +3.0/10.0
- Rent growth +2.5/5.0
- Condition / age +2.5/5.0
- Appreciation +0.0/10.0
$209,900
🖨 Deal sheet 📄 Offer letter ✓ Due diligence
Listing remarks
Welcome to this charming 3-bedroom, 1-bath home nestled in the heart of Bristol, TN! Situated on a spacious corner lot just shy of half an acre, this property offers both convenience and opportunity. Inside, you'll find 1,175 finished square feet featuring beautiful hardwood floors throughout, adding warmth and character to every room. The home also includes a garage for added storage and functionality, while the generous lot provides plenty of outdoor space for entertaining, gardening, or future improvements. With its prime location just minutes from downtown Bristol, local dining, shopping, and entertainment are right at your fingertips. Whether you're searching for the perfect starter ho
Key facts
- Outdoor space
- Prime location
- Corner lot
Tags
Property features AI
Exterior
- Parking: Attached garage (1 car); Driveway
- Utilities: Public water; Public sewer
- Home design: Single-family house; One story; Residential property in Marlyn Hills subdivision; Zoned R 1A
- Construction: Brick construction; Composition/Shingle roof; Other foundation
- Exterior features: Patio; Porch; Level and sloped topography
Interior
- Kitchen: Dishwasher; Range; Refrigerator
- Flooring: Hardwood; Laminate; Vinyl
- Bathrooms: 1 full bathroom
- Heating & cooling: Heating present (type: Other); Wall cooling units
- Interior features: Dishwasher; Range; Refrigerator
- Laundry & utility: Washer hookup; Electric dryer hookup
Neighborhood map
What this means for you Summary
Snapshot
- This is a 3-bed/1.0-bath single-family listed at $210k.
Deal economics
- At list price, monthly cash flow is $38 ($454/yr) — positive.
- The deal already cash-flows at list — no discount required.
- To meet the 1% rule (rent ≥ 1% of price), the offer needs to be $170k (19.0% below list).
- Recommended offer: $170k (19.0% below list) — sets the bar for 1% rule.
- Cap rate 6.5% vs local median 3.8% in Bristol — top-decile yield for the area; either an underpriced asset or a hidden risk that comps aren't pricing in. Stress-test before assuming the spread holds.
Location & tenants
- Location reads 73/100 on livability (#24 in TN) — a middle-class / working-renter tenant base. Strengths: cost of living A+, housing A+, health & safety A+; Watch: crime D+, commute F, employment F.
- Bristol (urban): math 37% / reading 35% proficiency, ranked #29 of 139 in TN (top 21%) — families likely to look elsewhere, expect single-tenant / working-renter base with shorter leases.
- Zoned schools: Avoca Elementary (math 44% / reading 38%, grade F, #215 of 952 statewide, top 23%, 423 students, 0% FRL); Bristol Tennessee Middle School (math 37% / reading 29%, grade F, #77 of 333 statewide, top 24%, 883 students, 0% FRL); Tennessee High School (math 20% / reading 41%, grade F, #75 of 332 statewide, top 24%, 1,154 students, 0% FRL) — zoned schools average 0% FRL vs 46% district-wide (46 pts lower); this property's tenant base skews higher-income than the district average.
- Market conditions: 253 active listings in the ZIP; 2 comparable units currently listed for rent nearby; 453 units permitted in Sullivan County in 2024 (6 in 5+ unit buildings).
- This rent runs 36% of the median local income ($56k/yr) — at the standard rent-burdened threshold; future hikes will face affordability resistance.
Forward outlook
- Local home prices are declining (-3.0%/yr); year-one equity from $1k of loan paydown is wiped out by about $6k of value loss. Plan a longer hold.
- Sullivan County population projected to shrink 5% by 2050 — rents likely to lag national; underwrite the cash flow, not the appreciation.
Negotiation context
- It's been on market 93 days — a 9% lower offer ($191k) is reasonable based on typical stale-listing flexibility.
- Current owner paid $130k; list at $210k implies a 61% gain — meaningful room to come down on a strong offer.
Questions for the listing agent
- It's been on market 93 days. Have you received any prior offers? Is the seller open to a 19% concession, seller financing, or rate buy-down credit?
- Built in 1965 — when were the roof, HVAC, electrical panel, plumbing, and water heater last replaced?
- Why hasn't it sold? Are there any deal-killer items the seller is aware of (foundation, flood, title, zoning, code violations)?
- Is there a deadline driving the sale (1031 exchange, divorce, estate, relocation)? That informs how much negotiation room exists.
- Schools are D-rated, which usually means shorter tenancies and higher turnover. Who's the typical renter profile here, and what's been the actual vacancy rate?
- Crime grade is D in this area — have there been break-ins, vandalism, or insurance claims at this property in the last 3 years? What carrier currently insures it and at what premium?
- The area grade is low — what's the realistic commute time and amenity access for the typical tenant pool here? Any planned neighborhood developments (good or bad) we should know about?
- What's the average days-on-market for RENTAL listings here right now (not sales)? A rising rental-DOM trend means longer vacancies and softer asking-rent achievability than the comps imply.
- What's the recent tenant-quality profile in this submarket — average credit score on applications, eviction rate, late-payment / NSF rate, and stable-employment percentage? A property-management company in the area should have these aggregated.
- How much new for-sale + rental construction is in the pipeline within 1–3 miles? Heavy new supply typically softens prices + rents 12–24 months out; constrained supply supports both.
Investment metrics
- 1% rule
- 0.81% ✗
- Cap rate
- 6.51%
- Cash-on-cash
- 0.77%
- DSCR
- 1.03
- GRM
- 10.3
CMA / ARV
- ARV (on-the-fly)
- $209,150
- Comps found
- 12
Show comp detail 12 sales within ~0.75 mi
| Address | Dist | Beds/Ba | Sqft | Sold | Price | $/sf | Match |
|---|---|---|---|---|---|---|---|
| 206 Lynfield Rd | 0.02mi | 3/1.0 | 1,306 (+11%) | 6mo | $237,000 | $181 | 76 |
| 204 Johnston Ave | 0.39mi | 3/1.0 | 1,116 (-5%) | 7mo | $199,000 | $178 | 68 |
| 112 Lynfield Rd | 0.11mi | 3/2.0 | 1,344 (+14%) | 4mo | $275,000 | $205 | 63 |
| 311 Oak Rd | 0.21mi | 3/1.0 | 1,092 (-7%) | 19mo | $179,900 | $165 | 63 |
| 306 Tween Hills Rd | 0.49mi | 2/1.0 (-1) | 1,161 (-1%) | 16mo | $199,000 | $171 | 57 |
| 101 Tween Hills Rd | 0.48mi | 3/1.0 | 1,297 (+10%) | 5mo | $199,900 | $154 | 56 |
| 102 Walnut Rd | 0.37mi | 3/1.5 | 1,008 (-14%) | 4mo | $205,000 | $203 | 54 |
| 6 Lynn St | 0.57mi | 3/1.0 | 1,200 (+2%) | 21mo | $199,900 | $167 | 53 |
| 113 Hemlock Rd | 0.30mi | 2/2.0 (-1) | 1,040 (-12%) | 7mo | $223,000 | $214 | 52 |
| 300 Redwood Rd | 0.42mi | 3/2.0 | 1,250 (+6%) | 18mo | $220,500 | $176 | 51 |
| 1017 Barber Rd | 0.65mi | 3/2.5 | 1,264 (+8%) | 9mo | $328,000 | $259 | 44 |
| 113 Walnut Rd | 0.41mi | 3/1.0 | 1,311 (+12%) | 22mo | $195,900 | $149 | 44 |
Match score weights: distance 35% · size 25% · config 20% · recency 20%. Top-matched comps best support the ARV.
Projected returns pro-forma
-3.0% appreciation · 3.0% rent growth · sell at horizon
- IRR
- -15.1%
- Equity multiple
- 0.46×
- Total profit
- $-31,667
- Equity at exit
- $31,297
- IRR
- -6.6%
- Equity multiple
- 0.58×
- Total profit
- $-24,733
- Equity at exit
- $18,148
Cash invested: $58,772 (down + closing). Projections, not guarantees.
Landlord ↔ Tenant lean methodology
- Overall (STATE)
- 87 Strongly Landlord-Friendly
- State Tennessee
- 87 Strongly Landlord-Friendly · R+13
- County
- — inherits STATE
- City
- — inherits STATE
ZIP-level market 37620
- Active inventory
- 253
- Price-to-rent
- 10.3×
Monthly cashflow live
- Estimated rent
- $1,699 medium interval (Pro) →
- Mortgage (P&I)
- −$1,101
- Tax from tax record
- −$116 /mo · $1,397/yr
- Insurance
- −$87
- HOA
- −$0
- Vacancy / Maint / Mgmt
- −$357
- Net cashflow
- $38
Break-even live
UW: 25.0% down · 7.5% · 30yr · 1.5% tax · 5.0% vac · 8.0% maint · 8.0% mgmt
Financing live
Cash to close
- Down payment
- $52,475
- Closing costs
- $6,297
- Reserves months
- —
- Total cash needed
- —
Loan-product check · same deal, 3 products live
Conventional
25% down · 7.5% · 30yr
- Down + closing
- —
- Monthly P&I
- —
- Monthly cashflow
- —
- DSCR
- —
- Eligible?
- —
Personal DTI + credit; lowest rate.
DSCR
20% down · 8.5% · 30yr
- Down + closing
- —
- Monthly P&I
- —
- Monthly cashflow
- —
- DSCR
- —
- Eligible?
- —
No personal income docs; deal must DSCR.
Hard money
10% down · 12.0% · 12mo
- Down + closing
- —
- Monthly P&I
- —
- Monthly cashflow
- —
- DSCR
- —
- Eligible?
- —
Short-term bridge; refi at stabilization.
Rent comps 2 comps
| Address | Beds | Baths | Sqft | Rent | $/sqft | DOM | Units | Dist |
|---|---|---|---|---|---|---|---|---|
| 1270 Volunteer Pkwy Bristol, TN | 2.0–3.0 | 1.0–2.0 | 1151 | $1,550 | $1.35 | 13d | 1 | 0.73mi |
| 60 Maple Tree Dr Bristol, TN | 2.0 | 1.0 | 944 | $1,350 | $1.43 | 21d | 1 | 1.33mi |
Listing history 19 events
-
2026-06-19days on market $209,900 Active 93 DOM
-
2026-06-18days on market $209,900 Active 92 DOM
-
2026-06-17days on market $209,900 Active 91 DOM
-
2026-06-16days on market $209,900 Active 90 DOM
-
2026-06-15days on market $209,900 Active 89 DOM
-
2026-06-14days on market $209,900 Active 87 DOM
-
2026-06-13days on market $209,900 Active 86 DOM
-
2026-06-10days on market $209,900 Active 84 DOM
-
2026-06-09days on market $209,900 Active 83 DOM
-
2026-06-08days on market $209,900 Active 82 DOM
-
2026-06-07days on market $209,900 Active 81 DOM
-
2026-06-03days on market $209,900 Active 77 DOM
-
2026-06-03price $209,900 Active 76 DOM
-
2026-06-02days on market $219,900 Active 76 DOM
-
2026-06-01days on market $219,900 Active 75 DOM
-
2026-05-31days on market $219,900 Active 74 DOM
-
2026-05-30days on market $219,900 Active 73 DOM
-
2026-03-18$219,900 Active
-
2023-12-29soldstatus $130,000
ⓘ Source: listings_history table (triggers on properties + properties_extension) + one-shot
backfill from property_details.listing_events for pre-trigger history.
Tax reassessment forecast TN · Resets to sale price
- Current annual tax
- $1,397 · $116/mo
- Projected year-2 tax
- $1,490 · $124/mo
- Expected delta
- +$93/yr (+$8/mo · 6.7%)
ⓘ Screening estimate from a state-policy table — verify with the county assessor before closing.
Climate risk First Street
- Flood 1/10 Low FEMA zone X (unshaded) · 0% chance over 30 yrs
- Wildfire 4/10 Moderate
- Heat 4/10 Moderate 7 d/yr ≥98°F today · 20 d/yr by 30 yrs out
- Wind 2/10 Low
- Air quality 2/10 Low 1 unhealthy d/yr today · 2 by 30 yrs out
Nearby sold comps map
Loading sold comps map…
Walkable amenities ~0.75 mi
Loading nearby amenities…
Taxation est. · year 1
- Rental income
- $20,392
- − Mortgage interest
- −$11,758
- − Property taxes
- −$1,397
- − Insurance
- −$1,050
- − Repairs & maintenance
- −$1,631
- − Management
- −$1,631
- − Depreciation
- −$6,106
- Taxable loss
- −$3,181
- Est. tax savings @ 24.0%
- +$764
- After-tax cash flow
- $1,218/yr
For passive investors: Depreciation is non-cash, so a rental often shows a tax loss while cash-flowing — sheltering income. Rental losses are passive: they offset passive income freely, and up to $25,000/yr can offset ordinary (W-2) income if you actively participate and your MAGI is under $100k (phasing out to $0 by $150k); unused losses carry forward. On sale, claimed depreciation is recaptured at up to 25%, and gains may owe capital-gains tax (a 1031 exchange can defer both). Figures are a year-1 estimate at your 24.0% rate — not tax advice; consult a CPA.
Schools (NCES district)
- District
- Bristol
- NCES district ID
- 4700360
- Math proficiency
- 37% ▼ -7.00%
- Reading proficiency
- 35% ▼ -8.00%
- Median HH income
- $37,018
- Composite
- 29.95/100
- National rank
- #6376
- State rank
- #29 of 139 in TN
Livability — Bristol
- Score
- 73/100
- State rank
- #24
- US rank
- #5413
Category grades
Schools grade is shown separately in the Schools card above.
Census & demographics
- Census place
- Bristol, TN
- County
- Sullivan County · 121,987 people
- City population
- 38,494
- Metro
- Kingsport-Bristol, TN-VA
- Population (ZIP)
- 38,494
- Household income
- $56,128
- Rent vs Own
- Severe rent burden
- 724.0
Population outlook (Sullivan County) Hauer SSP2
- Today (2025)
- 157,030 people
- By 2030
- 156,415 · -0.4%
- By 2040
- 153,778 · -2.1%
- By 2050
- 149,018 · -5.1%
- By 2075
- 138,068 · -12.1%
- By 2100
- 119,927 · -23.6%
Race, ethnicity, and origin ACS 2023
- Neighborhood character
- Predominantly White (91%)
- Race & ethnicity
- White 91% Two or more races 5% Hispanic / Latino 3% Black 2%
- Common ancestry
- Serbian 3% Slovak 3% Italian 1%
- Foreign-born
- 2% · Canada
- Languages at home
- 97% English-only · Spanish 2%
Political lean MEDSL · Sullivan
- 2024 margin
- Solid R (+55.0) · D 22.0% · R 77.0% · Other 1.0%
- 2008→2024 swing
- -13.6pp toward R · 2008: -41.3pp · 2024: -55.0pp
- All cycles
- 2024: R+55.0 2020: R+51.9 2016: R+56.2 2012: R+47.2 2008: R+41.3
Not yet ingested
- Civics
- —
Market trends
- HPI YoY
- ▼ -294.12%
- Current HPI
- 263.38
- Rent YoY
- —
- Metro
- Kingsport-Bristol, TN-VA
- State GDP YoY
- ▲ 2.78%
- F500 in state
- 22
Industry mix (Fortune 500 HQ in TN)
| Industry | F500 HQs | Revenue |
|---|---|---|
| Healthcare | 3 | $91B |
|
||
| Retail | 3 | $72B |
|
||
| Transportation / Logistics | 1 | $88B |
|
||
| Paper / Packaging | 1 | $19B |
|
||
| Insurance | 1 | $13B |
|
||
| Energy | 1 | $12B |
|
||
Price history
+69.2% since first listed2 events — show timeline
- 2026-03-18 Listed $219,900 TVRMLS
- 2023-12-29 Sold (Public Records) $130,000 Public Records
Property tax history
+4.0%/yrLatest (2025): $1,397 · +33.9% YoY. Source: county tax records.
Cash-flow waterfall
monthlySold comps — $/sqft
last 12 mo · ≤1 miLoading sold comps…