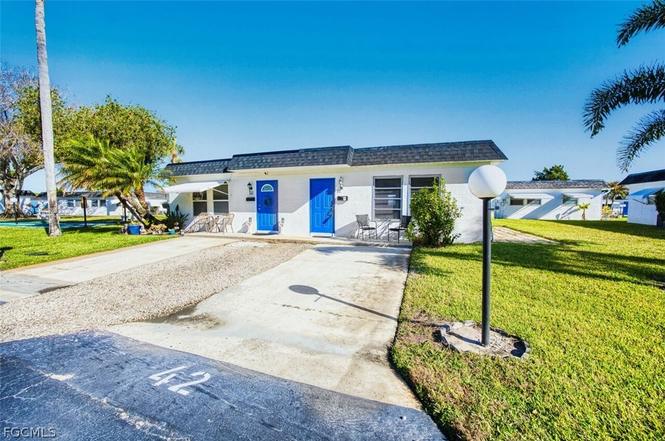
42 Temple Ct · Lehigh Acres, FL
Flood risk 1/10 · Minimal
- FEMA flood zone
- X (unshaded)
- Chance of flooding over 30 yrs
- 0.0%
- Est. flood insurance / yr
- $507 – $1,088
Fire risk 1/10 · Minimal
- Est. fire insurance / yr
- $947 – $1,759
Heat risk 10/10 · Severe
- Hot days now (above 107°F)
- 7 days/yr
- Hot days in 30 yrs
- 30 days/yr
Wind risk 10/10 · Severe
- Chance of severe wind over 30 yrs
- 99.0%
Air-quality risk 2/10 · Minimal
- Unhealthy air days now
- 1 days/yr
- Unhealthy air days in 30 yrs
- 2 days/yr
Risk factors via First Street. Map © Google.
Why this score? — see what drove the C grade
The composite is a weighted blend of 9 inputs, each scored 0–100. Each bar is that input's sub-score; the figure is the points it added to the 100-point composite (weight × sub-score).
- Cash flow +25.5/30.0
- DSCR +8.4/10.0
- ARV discount +7.5/15.0
- 1% rule +6.5/10.0
- Schools +4.1/10.0
- Livability +3.0/5.0
- Condition / age +2.5/5.0
- Rent growth +2.3/5.0
- Appreciation +0.0/10.0
$117,900
🖨 Deal sheet 📄 Offer letter ✓ Due diligence
Listing remarks
Welcome to your slice of paradise in the peaceful 55+ community of Orange Grove Park! This beautifully updated 2-bedroom, 2-bath duplex offers the perfect blend of comfort, convenience, and low-maintenance living in one of the most desirable streets in the neighborhood. Step inside to an inviting open floor plan designed for easy everyday living and entertaining. The spacious living area flows seamlessly into the open kitchen featuring a convenient breakfast bar, ideal for casual dining or hosting friends. Beautiful laminate flooring adds warmth and style throughout the home, while the generously sized bedrooms and tastefully updated bathrooms provide comfort and privacy. Additional highlig
Key facts
- Open floor plan
- Laminate flooring
- Low maintenance fee
Tags
Property features AI
Finance
- Financial info: Pets allowed with conditions (call)
- HOA & community: Homeowners association (198-unit community); Community amenities include barbecue and picnic area; On-site management; Non-gated; Senior community
Exterior
- Parking: Assigned parking; Driveway (paved); One space
- Security: Smoke detector(s)
- Utilities: Cable available; High speed internet available; Public sewer; Water assessment paid
- Home design: Single-story; Entry level 1; Faces west; East exposure on lot
- Construction: Stucco and wood frame construction; Shingle roof; Guest house attached
- Exterior features: Courtyard; Deck; Open porch
Interior
- Kitchen: Microwave; Range; Refrigerator
- Flooring: Laminate
- Bathrooms: 2 full bathrooms
- Heating & cooling: Central electric heating; Central electric cooling
- Interior features: Sliding windows; Family/Dining room; Kitchen island; Living/Dining room; Separate shower; Shower only; Cable TV; Unfurnished
- Laundry & utility: Washer; Dryer; Laundry inside
Neighborhood map
What this means for you Summary
Snapshot
- This is a 2-bed/2.0-bath condo listed at $118k.
Deal economics
- At list price, monthly cash flow is $274 ($3k/yr) — positive.
- The deal already cash-flows at list — no discount required.
- Meets the 1% rule at list price ($1k rent vs $118k).
- Recommended offer: $107k (9.0% below list) — sets the bar for market timing.
- Cap rate 9.1% vs local median 4.7% in Lehigh Acres — top-decile yield for the area; either an underpriced asset or a hidden risk that comps aren't pricing in. Stress-test before assuming the spread holds.
Location & tenants
- Location reads 59/100 on livability (#826 in FL) — a working-class tenant base; expect higher turnover. Strengths: cost of living A+, housing A+; Watch: crime C-, employment D+, schools D-.
- Lee (suburban): math 47% / reading 50% proficiency, ranked #42 of 73 in FL (top 58%) — families likely to look elsewhere, expect single-tenant / working-renter base with shorter leases.
- Market conditions: Rents soft (-0.8%/yr); 641 active listings in the ZIP; 40 comparable units currently listed for rent nearby; rentals at typical pace (median 24d on market — plan ~3-4 weeks tenant-placement turnaround); 15,411 units permitted in Lee County in 2024 (4,686 in 5+ unit buildings).
- This rent runs 32% of the median local income ($51k/yr) — at the standard rent-burdened threshold; future hikes will face affordability resistance.
Forward outlook
- Local home prices are declining (-3.0%/yr); year-one equity from $815 of loan paydown is wiped out by about $4k of value loss. Plan a longer hold.
- Lee County population projected at +44% by 2050 — long-run rental-demand tailwind backs the buy-and-hold thesis.
Negotiation context
- It's been on market 104 days — a 9% lower offer ($107k) is reasonable based on typical stale-listing flexibility.
- 9 sale attempts since 9y ago; this cycle's ask has dropped $10k (8%) from the opening price — seller is motivated, your offer sets the floor, not the list.
- Current owner paid $45k; list at $118k implies a 162% gain — meaningful room to come down on a strong offer.
Risks & watch-outs
- Climate carrying-cost: severe wind risk, 99% chance of damaging wind over 30y; extreme-heat days projected 7→30/yr by 2055 (HVAC capex compounding) — expect insurance premiums to compound above CPI over the hold.
Questions for the listing agent
- It's been on market 104 days. Have you received any prior offers? Is the seller open to a 9% concession, seller financing, or rate buy-down credit?
- Built in 1972 — when were the roof, HVAC, electrical panel, plumbing, and water heater last replaced?
- Any open or pending special assessments — roof, HVAC, plumbing, elevator, façade? What's the per-unit balance and payoff schedule, and is the seller paying it off at close or rolling it to the buyer?
- Why hasn't it sold? Are there any deal-killer items the seller is aware of (foundation, flood, title, zoning, code violations)?
- Is there a deadline driving the sale (1031 exchange, divorce, estate, relocation)? That informs how much negotiation room exists.
- Schools are D-rated, which usually means shorter tenancies and higher turnover. Who's the typical renter profile here, and what's been the actual vacancy rate?
- What's the average days-on-market for RENTAL listings here right now (not sales)? A rising rental-DOM trend means longer vacancies and softer asking-rent achievability than the comps imply.
- What's the recent tenant-quality profile in this submarket — average credit score on applications, eviction rate, late-payment / NSF rate, and stable-employment percentage? A property-management company in the area should have these aggregated.
- How much new apartment / multifamily construction is in the pipeline within 1–3 miles? Heavy new supply (>2% of stock underway) typically softens rents 12–24 months out; light construction supports rent growth.
Investment metrics
- 1% rule
- 1.15% ✓
- Cap rate
- 9.08%
- Cash-on-cash
- 9.94%
- DSCR
- 1.44
- GRM
- 7.2
CMA / ARV
No comps found within radius.
Projected returns pro-forma
-3.0% appreciation · 0.0% rent growth · sell at horizon
- IRR
- -4.7%
- Equity multiple
- 0.83×
- Total profit
- $-5,657
- Equity at exit
- $17,579
- IRR
- 1.1%
- Equity multiple
- 1.07×
- Total profit
- $2,147
- Equity at exit
- $10,194
Cash invested: $33,012 (down + closing). Projections, not guarantees.
Landlord ↔ Tenant lean methodology
- Overall (STATE)
- 87 Strongly Landlord-Friendly
- State Florida
- 87 Strongly Landlord-Friendly · R+3
- County
- — inherits STATE
- City
- — inherits STATE
ZIP-level market 33936
- Home prices YoY
- -19.9%
- Rents YoY
- -0.8%
- Active inventory
- 641
- Price-to-rent
- 7.2×
Monthly cashflow live
- Estimated rent
- $1,361 high interval (Pro) →
- Mortgage (P&I)
- −$618
- Tax from tax record
- −$134 /mo · $1,612/yr
- Insurance
- −$49
- HOA
- −$0
- Vacancy / Maint / Mgmt
- −$286
- Net cashflow
- $274
Break-even live
UW: 25.0% down · 7.5% · 30yr · 1.5% tax · 5.0% vac · 8.0% maint · 8.0% mgmt
Financing live
Cash to close
- Down payment
- $29,475
- Closing costs
- $3,537
- Reserves months
- —
- Total cash needed
- —
Loan-product check · same deal, 3 products live
Conventional
25% down · 7.5% · 30yr
- Down + closing
- —
- Monthly P&I
- —
- Monthly cashflow
- —
- DSCR
- —
- Eligible?
- —
Personal DTI + credit; lowest rate.
DSCR
20% down · 8.5% · 30yr
- Down + closing
- —
- Monthly P&I
- —
- Monthly cashflow
- —
- DSCR
- —
- Eligible?
- —
No personal income docs; deal must DSCR.
Hard money
10% down · 12.0% · 12mo
- Down + closing
- —
- Monthly P&I
- —
- Monthly cashflow
- —
- DSCR
- —
- Eligible?
- —
Short-term bridge; refi at stabilization.
Rent comps 40 comps
| Address | Beds | Baths | Sqft | Rent | $/sqft | DOM | Units | Dist |
|---|---|---|---|---|---|---|---|---|
| 10625 Windsmont Ct Lehigh Acres, FL | 3.0 | 2.0 | 1080 | $1,350 | $1.25 | 23d | 1 | 0.07mi |
| 10 Tangerine Ct Lehigh Acres, FL | 2.0 | 2.0 | 812 | $1,200 | $1.48 | 18d | 1 | 0.08mi |
| 46 Hamlin Ct Lehigh Acres, FL | 2.0 | 2.0 | 812 | $1,050 | $1.29 | 23d | 1 | 0.11mi |
| 10578 Quincy Ct Unit 1 Lehigh Acres, FL | 2.0 | 2.0 | 899 | $1,275 | $1.42 | 23d | 1 | 0.11mi |
| 10554 Quincy Ct Lehigh Acres, FL | 2.0 | 2.0 | 1004 | $1,300 | $1.29 | 18d | 1 | 0.15mi |
| 47 Tangelo Ct Lehigh Acres, FL | 2.0 | 2.0 | 812 | $1,150 | $1.42 | 23d | 1 | 0.15mi |
| 9 Hamlin Ct Lehigh Acres, FL | 1.0 | 1.5 | 807 | $950 | $1.18 | 3d | 1 | 0.15mi |
| 44 Tangelo Ct Lehigh Acres, FL | 2.0 | 2.0 | 812 | $1,150 | $1.42 | 3d | 1 | 0.17mi |
| 10525 Putnam Ct Lehigh Acres, FL | 2.0 | 2.0 | 1014 | $1,250 | $1.23 | 19d | 1 | 0.21mi |
| 423 Morgan Cir S Lehigh Acres, FL | 3.0 | 1.0 | 920 | $1,450 | $1.58 | 23d | 1 | 0.29mi |
| 1112 Gifford Ave S Lehigh Acres, FL | 2.0 | 2.0 | 880 | $1,350 | $1.53 | 3d | 1 | 0.32mi |
| 1112 Gifford Ave S Lehigh Acres, FL | 2.0 | 2.0 | 880 | $1,350 | $1.53 | 23d | 1 | 0.32mi |
| 201 Alabama Rd S Lehigh Acres, FL | 3.0 | 1.0 | 920 | $1,275 | $1.39 | 2d | 1 | 0.34mi |
| 6 Aztec Lily Ln Lehigh Acres, FL | 2.0 | 2.0 | 853 | $2,600 | $3.05 | 23d | 1 | 0.49mi |
| 6 Aztec Lily Ln Lehigh Acres, FL | 2.0 | 2.0 | 853 | $1,500 | $1.76 | 19d | 1 | 0.49mi |
| 26 Alabama Rd S Lehigh Acres, FL | 2.0 | 1.0 | 920 | $1,650 | $1.79 | 21d | 1 | 0.56mi |
| 907 Laredo Ave Lehigh Acres, FL | 1.0 | 1.0 | 636 | $1,000 | $1.57 | 23d | 1 | 0.58mi |
| 3 Desert Candle Cir Lehigh Acres, FL | 2.0 | 2.0 | 853 | $1,200 | $1.41 | 23d | 1 | 0.62mi |
| 18461 Copperhead Ct N #444 Lehigh Acres, FL | 2.0 | 2.0 | 1120 | $2,300 | $2.05 | 23d | 1 | 0.63mi |
| 18411 Copperhead Dr #346 Lehigh Acres, FL | 2.0 | 2.0 | 1061 | $1,695 | $1.60 | 21d | 1 | 0.67mi |
| 9161 Aegean Cir Lehigh Acres, FL | 2.0 | 2.0 | 1120 | $1,650 | $1.47 | 13d | 1 | 0.71mi |
| 9137 Aegean Cir Lehigh Acres, FL | 2.0 | 2.0 | 1120 | $1,474 | $1.32 | 3d | 1 | 0.76mi |
| 9137 Aegean Cir Lehigh Acres, FL | 2.0 | 2.0 | 1120 | $1,474 | $1.32 | 23d | 1 | 0.76mi |
| 9123 Aegean Cir Lehigh Acres, FL | 2.0 | 2.0 | 1120 | $1,474 | $1.32 | 2d | 1 | 0.78mi |
| 11 California Rd Lehigh Acres, FL | 1.0 | 1.0 | 683 | $1,450 | $2.12 | 23d | 1 | 0.82mi |
| 9099 Aegean Cir Lehigh Acres, FL | 2.0 | 2.0 | 1120 | $1,499 | $1.34 | 23d | 1 | 0.82mi |
| 1120 Vineyard St Lehigh Acres, FL | 2.0 | 1.0 | 1028 | $1,300 | $1.26 | 23d | 1 | 0.90mi |
| 448 Reading St Lehigh Acres, FL | 3.0 | 2.0 | 1100 | $1,890 | $1.72 | 3d | 1 | 0.91mi |
| 704 W Cleveland Ln Lehigh Acres, FL | 2.0 | 1.0 | 816 | $1,400 | $1.72 | 23d | 1 | 0.92mi |
| 1113 Vineyard St Lehigh Acres, FL | 3.0 | 2.0 | 1004 | $1,500 | $1.49 | 23d | 1 | 0.92mi |
| 18451 Copperhead Dr #522 Lehigh Acres, FL | 2.0 | 2.0 | 1120 | $1,895 | $1.69 | 23d | 1 | 1.00mi |
| 10 Beth Stacey Blvd #206 Lehigh Acres, FL | 2.0 | 2.0 | 1012 | $1,100 | $1.09 | 3d | 1 | 1.00mi |
| 28 Cosmopolitan Dr #13 Lehigh Acres, FL | 2.0 | 2.0 | 973 | $1,375 | $1.41 | 14d | 1 | 1.07mi |
| 102 Connecticut Rd Lehigh Acres, FL | 2.0 | 1.0 | 816 | $1,300 | $1.59 | 23d | 1 | 1.07mi |
| 1423 Caywood Cir S Lehigh Acres, FL | 2.0 | 2.0 | 960 | $1,376 | $1.43 | 3d | 1 | 1.16mi |
| 106 Leeland Heights Blvd W Lehigh Acres, FL | 1.0 | 1.0 | 794 | $1,450 | $1.83 | 23d | 1 | 1.21mi |
| 305 Bougainvillea Rd W Lehigh Acres, FL | 1.0 | 1.0 | 742 | $1,295 | $1.75 | 23d | 1 | 1.24mi |
| 1000 Monroe Dr Lehigh Acres, FL | 3.0 | 2.0 | 984 | $1,650 | $1.68 | 23d | 1 | 1.28mi |
| 111 Yellowtail Loop #3 Lehigh Acres, FL | 2.0 | 2.0 | 1100 | $1,750 | $1.59 | 23d | 1 | 1.33mi |
| 110 Texas Rd Lehigh Acres, FL | 3.0 | 1.0 | 1118 | $1,750 | $1.57 | 15d | 1 | 1.39mi |
HOA detail condo
- Monthly dues
- $0 · $0/yr
- Assessments
- None detected in remarks — confirm with the listing agent.
Listing history 36 events
-
2026-06-17days on market $117,900 Active 104 DOM
-
2026-06-16days on market $117,900 Active 103 DOM
-
2026-06-15days on market $117,900 Active 102 DOM
-
2026-06-13days on market $117,900 Active 100 DOM
-
2026-06-10days on market $117,900 Active 97 DOM
-
2026-06-09days on market $117,900 Active 96 DOM
-
2026-06-07pricedays on market $117,900 Active 94 DOM
-
2026-06-02days on market $127,900 Active 89 DOM
-
2026-06-01days on market $127,900 Active 88 DOM
-
2026-06-01days on market $127,900 Active 87 DOM
-
2026-03-05$127,900 Active
-
2026-02-07historical
-
2025-11-15$130,000 Active
-
2025-10-22historical
-
2025-07-20$139,000 Active
-
2025-07-13historical $1,400
-
2025-05-05historical
-
2025-04-25$1,400
-
2025-04-21$149,900 Active
-
2025-04-11historical
-
2025-03-28price $149,900
-
2025-03-10price $157,000
-
2024-11-26$162,000 Active
-
2023-11-01historical
-
2023-10-18status Active
-
2023-10-05status Pending
-
2023-08-21price $159,900
-
2023-06-30$163,000 Active
-
2017-08-25soldstatus $45,000
-
2017-08-21soldstatus $45,000 Sold
-
2017-08-16status Pending
-
2017-08-10$49,900 Active
-
2011-07-28soldstatus $32,000
-
2011-07-08soldstatus $18,000
-
1996-12-20soldstatus $29,900
-
1995-11-02soldstatus $29,000
ⓘ Source: listings_history table (triggers on properties + properties_extension) + one-shot
backfill from property_details.listing_events for pre-trigger history.
Tax reassessment forecast FL · Resets to sale price
- Current annual tax
- $1,612 · $134/mo
- Projected year-2 tax
- $1,612 · $134/mo
- Expected delta
- $0/yr ($0/mo · 0.0%)
ⓘ Screening estimate from a state-policy table — verify with the county assessor before closing.
Climate risk First Street
- Flood 1/10 Low FEMA zone X (unshaded) · 0% chance over 30 yrs
- Wildfire 1/10 Low
- Heat 10/10 Extreme 7 d/yr ≥107°F today · 30 d/yr by 30 yrs out
- Wind 10/10 Extreme 99% chance of damaging wind over 30 yrs
- Air quality 2/10 Low 1 unhealthy d/yr today · 2 by 30 yrs out
Nearby sold comps map
Loading sold comps map…
Walkable amenities ~0.75 mi
Loading nearby amenities…
Taxation est. · year 1
- Rental income
- $16,333
- − Mortgage interest
- −$6,604
- − Property taxes
- −$1,612
- − Insurance
- −$590
- − Repairs & maintenance
- −$1,307
- − Management
- −$1,307
- − Depreciation
- −$3,430
- Taxable income
- $1,485
- Est. tax owed @ 24.0%
- −$356
- After-tax cash flow
- $2,927/yr
For passive investors: Depreciation is non-cash, so a rental often shows a tax loss while cash-flowing — sheltering income. Rental losses are passive: they offset passive income freely, and up to $25,000/yr can offset ordinary (W-2) income if you actively participate and your MAGI is under $100k (phasing out to $0 by $150k); unused losses carry forward. On sale, claimed depreciation is recaptured at up to 25%, and gains may owe capital-gains tax (a 1031 exchange can defer both). Figures are a year-1 estimate at your 24.0% rate — not tax advice; consult a CPA.
Schools (NCES district)
- District
- Lee
- NCES district ID
- 1201080
- Math proficiency
- 47% ▼ -11.00%
- Reading proficiency
- 50% ▼ -4.00%
- Median HH income
- $49,518
- Composite
- 41.49/100
- National rank
- #3458
- State rank
- #42 of 73 in FL
Livability — Lehigh Acres
- Score
- 59/100
- State rank
- #826
- US rank
- #20055
Category grades
Schools grade is shown separately in the Schools card above.
Census & demographics
- Census place
- Lehigh Acres, FL
- County
- Lee County · 788,662 people
- City population
- 130,638
- Metro
- Cape Coral-Fort Myers, FL
- Population (ZIP)
- 27,967
- Household income
- $51,417
- Rent vs Own
- Severe rent burden
- 1027.0
Population outlook (Lee County) Hauer SSP2
- Today (2025)
- 871,946 people
- By 2030
- 955,468 · +9.6%
- By 2040
- 1,113,587 · +27.7%
- By 2050
- 1,256,891 · +44.1%
- By 2075
- 1,560,270 · +78.9%
- By 2100
- 1,726,848 · +98.0%
Race, ethnicity, and origin ACS 2023
- Neighborhood character
- Diverse neighborhood (Simpson 0.63)
- Race & ethnicity
- Hispanic / Latino 44% White 41% Two or more races 21% Black 9% Asian 1%
- Hispanic origin (detail)
- Mexican 7% Puerto Rican 9% Cuban 18% Dominican 2%
- Common ancestry
- Hispanic 3% Romanian 2% Lithuanian 1%
- Foreign-born
- 28% · Canada, Jamaica
- Languages at home
- 59% English-only · Spanish 36% French/Haitian/Cajun 3% Tagalog/Filipino 1%
Political lean MEDSL · Lee
- 2024 margin
- Strong R (+28.4) · D 35.5% · R 63.9%
- 2008→2024 swing
- -18.0pp toward R · 2008: -10.4pp · 2024: -28.4pp
- All cycles
- 2024: R+28.4 2020: R+19.2 2016: R+20.4 2012: R+16.6 2008: R+10.4
Not yet ingested
- Civics
- —
Market trends
- HPI YoY
- ▼ -86.78%
- Current HPI
- 348.8631
- Rent YoY
- ▼ -0.77%
- Metro
- Cape Coral-Fort Myers, FL
- State GDP YoY
- ▲ 3.28%
- F500 in state
- 36
Industry mix (Fortune 500 HQ in FL)
| Industry | F500 HQs | Revenue |
|---|---|---|
| Industrial Technology | 2 | $29B |
|
||
| Insurance | 2 | $17B |
|
||
| Retail | 1 | $60B |
|
||
| Technology Distribution | 1 | $58B |
|
||
| Homebuilding | 1 | $35B |
|
||
| Technology Manufacturing | 1 | $35B |
|
||
Price history
+341.0% since first listed26 events — show timeline
- 2026-03-05 Listed $127,900 FORTMLS
- 2026-02-07 Listing Removed — FORTMLS
- 2025-11-15 Listed $130,000 FORTMLS
- 2025-10-22 Listing Removed — FORTMLS
- 2025-07-20 Listed $139,000 FORTMLS
- 2025-07-13 Rental Removed $1,400 NAPLESMLS
- 2025-05-05 Listing Removed — FORTMLS
- 2025-04-25 Listed for Rent $1,400 NAPLESMLS
- 2025-04-21 Listed $149,900 FORTMLS
- 2025-04-11 Listing Removed — FORTMLS
- 2025-03-28 Price Changed $149,900 FORTMLS
- 2025-03-10 Price Changed $157,000 FORTMLS
- 2024-11-26 Listed $162,000 FORTMLS
- 2023-11-01 Listing Removed — FORTMLS
- 2023-10-18 Relisted — FORTMLS
- 2023-10-05 Pending — FORTMLS
- 2023-08-21 Price Changed $159,900 FORTMLS
- 2023-06-30 Listed $163,000 FORTMLS
- 2017-08-25 Sold (Public Records) $45,000 Public Records
- 2017-08-21 Sold (MLS) $45,000 FORTMLS
- 2017-08-16 Pending — FORTMLS
- 2017-08-10 Listed $49,900 FORTMLS
- 2011-07-28 Sold (Public Records) $32,000 Public Records
- 2011-07-08 Sold (Public Records) $18,000 Public Records
- 1996-12-20 Sold (Public Records) $29,900 Public Records
- 1995-11-02 Sold (Public Records) $29,000 Public Records
Property tax history
+10.0%/yrLatest (2025): $1,612 · -0.0% YoY. Source: county tax records.
Cash-flow waterfall
monthlySold comps — $/sqft
last 12 mo · ≤1 miLoading sold comps…