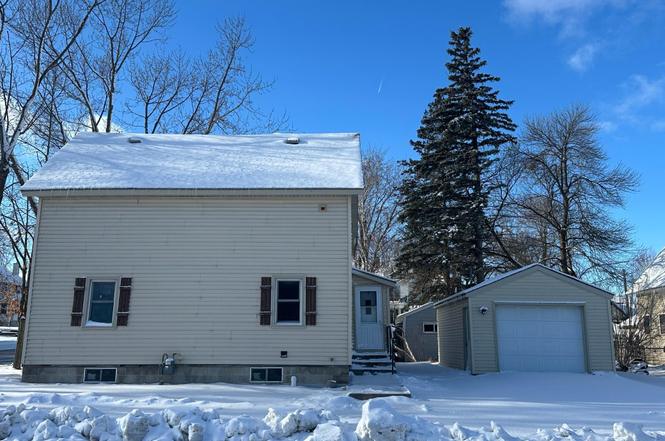
700 Sinclair Lewis Ave · Sauk Centre, MN
Flood risk 1/10 · Minimal
- FEMA flood zone
- X (unshaded)
- Chance of flooding over 30 yrs
- 0.0%
- Est. flood insurance / yr
- $507 – $1,088
Fire risk 1/10 · Minimal
- Est. fire insurance / yr
- $888 – $1,650
Heat risk 2/10 · Minimal
- Hot days now (above 97°F)
- 7 days/yr
- Hot days in 30 yrs
- 13 days/yr
Wind risk 2/10 · Minimal
- Chance of severe wind over 30 yrs
- —
Air-quality risk 2/10 · Minimal
- Unhealthy air days now
- 2 days/yr
- Unhealthy air days in 30 yrs
- 2 days/yr
Risk factors via First Street. Map © Google.
Why this score? — see what drove the B- grade
The composite is a weighted blend of 9 inputs, each scored 0–100. Each bar is that input's sub-score; the figure is the points it added to the 100-point composite (weight × sub-score).
- Cash flow +28.1/30.0
- DSCR +10.0/10.0
- 1% rule +8.0/10.0
- ARV discount +7.5/15.0
- Schools +4.0/10.0
- Livability +3.9/5.0
- Rent growth +2.5/5.0
- Condition / age +2.5/5.0
- Appreciation +0.0/10.0
$130,000
🖨 Deal sheet (PDF) 📄 Offer letter ✓ Due diligence
Listing remarks MLS
HUD acquired home. Good starter home in convenient Sauk Centre location. 3 Bedroom, 1.5 Bath home with large and inviting open layout.
Key facts
- 3,049 sq ft lot
- Garage
- Built 1885
Neighborhood map
What this means for you Summary
Snapshot
- This is a 4-bed/2.0-bath single-family listed at $130k.
Deal economics
- At list price, monthly cash flow is $408 ($5k/yr) — positive.
- The deal already cash-flows at list — no discount required.
- Meets the 1% rule at list price ($2k rent vs $130k).
- Recommended offer: $114k (12.0% below list) — sets the bar for market timing.
- Cap rate 10.1% vs local median 3.7% in Sauk Centre — top-decile yield for the area; either an underpriced asset or a hidden risk that comps aren't pricing in. Stress-test before assuming the spread holds.
Location & tenants
- Location reads 77/100 on livability (#127 in MN, #2,899 nationally) — a middle-class / working-renter tenant base. Strengths: crime A+, cost of living A+, housing A+; Watch: amenities F, commute F.
- Sauk Centre Public School District (town): math 42% / reading 51% proficiency, ranked #164 of 301 in MN (top 54%) — families likely to look elsewhere, expect single-tenant / working-renter base with shorter leases.
- Zoned schools: Sauk Centre Elementary (math 37% / reading 42%, grade F, #604 of 857 statewide, top 74%, 390 students, 50% FRL); Sauk Centre Middle (math 27% / reading 47%, grade F, #163 of 258 statewide, top 65%, 141 students, 52% FRL); Sauk Centre Secondary (math 52% / reading 58%, grade C, #83 of 471 statewide, top 18%, 608 students, 38% FRL) — zoned schools average 47% FRL vs 29% district-wide (18 pts higher); higher-poverty schools than district average — tighter screening recommended.
- Market conditions: 58 active listings in the ZIP; 661 units permitted in Stearns County in 2024 (291 in 5+ unit buildings).
Forward outlook
- Local home prices are declining (-3.0%/yr); year-one equity from $899 of loan paydown is wiped out by about $4k of value loss. Plan a longer hold.
- Stearns County population projected at +9% by 2050 — modest demand growth; plan on rents tracking national, not racing it.
- At projected returns (-3.0% appreciation + 3.0% rent growth), your $36k cash investment doubles in ~9 years — after that, you're playing with house money.
Negotiation context
- It's been on market 165 days — a 12% lower offer ($114k) is reasonable based on typical stale-listing flexibility.
- 3 sale attempts since 27y ago; this cycle's ask has dropped $60k (32%) from the opening price — seller is motivated, your offer sets the floor, not the list.
- Current owner paid $38k; list at $130k implies a 242% gain — meaningful room to come down on a strong offer.
Risks & watch-outs
- Watch-outs: built in 1885 — expect roof / HVAC / electrical / plumbing capex.
Questions for the listing agent
- It's been on market 165 days. Have you received any prior offers? Is the seller open to a 12% concession, seller financing, or rate buy-down credit?
- Built in 1885 — when were the roof, HVAC, electrical panel, plumbing, and water heater last replaced?
- Why hasn't it sold? Are there any deal-killer items the seller is aware of (foundation, flood, title, zoning, code violations)?
- Is there a deadline driving the sale (1031 exchange, divorce, estate, relocation)? That informs how much negotiation room exists.
- Schools are B-rated — typically a magnet for longer-tenancy family renters. What's the average tenant stay here, and is there a school-zone premium baked into asking?
- What's the average days-on-market for RENTAL listings here right now (not sales)? A rising rental-DOM trend means longer vacancies and softer asking-rent achievability than the comps imply.
- What's the recent tenant-quality profile in this submarket — average credit score on applications, eviction rate, late-payment / NSF rate, and stable-employment percentage? A property-management company in the area should have these aggregated.
- How much new for-sale + rental construction is in the pipeline within 1–3 miles? Heavy new supply typically softens prices + rents 12–24 months out; constrained supply supports both.
Investment metrics
- 1% rule
- 1.30% ✓
- Cap rate
- 10.06%
- Cash-on-cash
- 13.45%
- DSCR
- 1.60
- GRM
- 6.4
CMA / ARV
No comps found within radius.
Projected returns pro-forma
-3.0% appreciation · 3.0% rent growth · sell at horizon
- IRR
- 3.5%
- Equity multiple
- 1.14×
- Total profit
- $4,969
- Equity at exit
- $19,383
- IRR
- 13.1%
- Equity multiple
- 2.04×
- Total profit
- $37,965
- Equity at exit
- $11,240
Cash invested: $36,400 (down + closing). Projections, not guarantees.
Landlord ↔ Tenant lean methodology
- Overall (STATE)
- 46 Balanced
- State Minnesota
- 46 Balanced · D+2
- County
- — inherits STATE
- City
- — inherits STATE
ZIP-level market 56378
- Active inventory
- 58
- Price-to-rent
- 6.4×
Monthly cashflow live
- Estimated rent
- $1,686 medium interval (Pro) →
- Mortgage (P&I)
- −$682
- Tax from tax record
- −$188 /mo · $2,252/yr
- Insurance
- −$54
- HOA
- −$0
- Lot rent
- −$0
- Vacancy / Maint / Mgmt
- −$354
- Net cashflow
- $408
Break-even live
Sensitivity live
| Price | -10% $482 | -5% $445 | +0% $408 | +5% $371 | +10% $335 |
|---|---|---|---|---|---|
| Rent | -10% $275 | -5% $342 | +0% $408 | +5% $475 | +10% $541 |
| Rate | -1.0pp $474 | -0.5pp $441 | base $408 | +0.5pp $374 | +1.0pp $340 |
UW: 25.0% down · 7.5% · 30yr · 1.5% tax · 5.0% vac · 8.0% maint · 8.0% mgmt
Financing live
Cash to close
- Down payment
- $32,500
- Closing costs
- $3,900
- Reserves months
- —
- Total cash needed
- —
Loan-product check · same deal, 3 products live
Conventional
25% down · 7.5% · 30yr
- Down + closing
- —
- Monthly P&I
- —
- Monthly cashflow
- —
- DSCR
- —
- Eligible?
- —
Personal DTI + credit; lowest rate.
DSCR
20% down · 8.5% · 30yr
- Down + closing
- —
- Monthly P&I
- —
- Monthly cashflow
- —
- DSCR
- —
- Eligible?
- —
No personal income docs; deal must DSCR.
Hard money
10% down · 12.0% · 12mo
- Down + closing
- —
- Monthly P&I
- —
- Monthly cashflow
- —
- DSCR
- —
- Eligible?
- —
Short-term bridge; refi at stabilization.
Listing history 17 events
-
2026-04-08status Pending
-
2026-04-05price $130,000
-
2026-03-07price $150,000
-
2025-12-31price $178,000
-
2025-10-26$190,000 Active
-
2025-10-13historical $190,000
-
2011-07-26soldstatus $38,000 134-char remark
Show marketing remark (134 chars)
HUD acquired home. Good starter home in convenient Sauk Centre location. 3 Bedroom, 1.5 Bath home with large and inviting open layout.
-
2011-06-09historical 134-char remark
Show marketing remark (134 chars)
HUD acquired home. Good starter home in convenient Sauk Centre location. 3 Bedroom, 1.5 Bath home with large and inviting open layout.
-
2011-01-12$48,000 134-char remark
Show marketing remark (134 chars)
HUD acquired home. Good starter home in convenient Sauk Centre location. 3 Bedroom, 1.5 Bath home with large and inviting open layout.
-
2006-03-28soldstatus $98,500
-
2005-03-24soldstatus $98,500
-
2005-03-07soldstatus $104,000
-
2005-03-01soldstatus $98,500
-
2002-08-08soldstatus $65,000
-
2000-05-05soldstatus $46,000
Show marketing remark (72 chars)
OLDER TWO STORY ON CORNER LOT ON SINCLAIR LEWIS AVE, NEWER SINGLE GARAGE
-
2000-05-05soldstatus $48,000 72-char remark
Show marketing remark (72 chars)
OLDER TWO STORY ON CORNER LOT ON SINCLAIR LEWIS AVE, NEWER SINGLE GARAGE
-
1999-07-24$34,900 72-char remark
Show marketing remark (72 chars)
OLDER TWO STORY ON CORNER LOT ON SINCLAIR LEWIS AVE, NEWER SINGLE GARAGE
ⓘ Source: listings_history table (triggers on properties + properties_extension) + one-shot
backfill from property_details.listing_events for pre-trigger history.
Tax reassessment forecast MN · Partial reset (capped growth)
- Current annual tax
- $2,252 · $188/mo
- Projected year-2 tax
- $2,252 · $188/mo
- Expected delta
- $0/yr ($0/mo · 0.0%)
ⓘ Screening estimate from a state-policy table — verify with the county assessor before closing.
Climate risk First Street
- Flood 1/10 Low FEMA zone X (unshaded) · 0% chance over 30 yrs
- Wildfire 1/10 Low
- Heat 2/10 Low 7 d/yr ≥97°F today · 13 d/yr by 30 yrs out
- Wind 2/10 Low
- Air quality 2/10 Low 2 unhealthy d/yr today · 2 by 30 yrs out
Nearby sold comps map
Loading sold comps map…
Walkable amenities ~0.75 mi
Loading nearby amenities…
Taxation est. · year 1
- Rental income
- $20,228
- − Mortgage interest
- −$7,282
- − Property taxes
- −$2,252
- − Insurance
- −$650
- − Repairs & maintenance
- −$1,618
- − Management
- −$1,618
- − Depreciation
- −$3,782
- Taxable income
- $3,026
- Est. tax owed @ 24.0%
- −$726
- After-tax cash flow
- $4,171/yr
For passive investors: Depreciation is non-cash, so a rental often shows a tax loss while cash-flowing — sheltering income. Rental losses are passive: they offset passive income freely, and up to $25,000/yr can offset ordinary (W-2) income if you actively participate and your MAGI is under $100k (phasing out to $0 by $150k); unused losses carry forward. On sale, claimed depreciation is recaptured at up to 25%, and gains may owe capital-gains tax (a 1031 exchange can defer both). Figures are a year-1 estimate at your 24.0% rate — not tax advice; consult a CPA.
Schools (NCES district)
- District
- Sauk Centre Public School District
- NCES district ID
- 2732850
- Math proficiency
- 42% ▼ -18.00%
- Reading proficiency
- 51% ▼ -12.00%
- Median HH income
- $52,108
- Composite
- 40.05/100
- National rank
- #3816
- State rank
- #164 of 301 in MN
Livability — Sauk Centre
- Score
- 77/100
- State rank
- #127
- US rank
- #2899
Category grades
Schools grade is shown separately in the Schools card above.
Census & demographics
- Census place
- Sauk Centre, MN
- Population (ZIP)
- 8,433
Population outlook (Stearns County) Hauer SSP2
- Today (2025)
- 162,629 people
- By 2030
- 166,495 · +2.4%
- By 2040
- 172,661 · +6.2%
- By 2050
- 177,480 · +9.1%
- By 2075
- 192,907 · +18.6%
- By 2100
- 206,274 · +26.8%
Race, ethnicity, and origin ACS 2023
- Neighborhood character
- Predominantly White (93%)
- Race & ethnicity
- White 93% Two or more races 3% Hispanic / Latino 3%
- Common ancestry
- Portuguese 12% Romanian 4% Italian 3%
- Foreign-born
- 1% · Canada
- Languages at home
- 96% English-only · Spanish 2%
Political lean MEDSL · Stearns
- 2024 margin
- Strong R (+26.8) · D 35.7% · R 62.5% · Other 1.9%
- 2008→2024 swing
- -19.8pp toward R · 2008: -7.0pp · 2024: -26.8pp
- All cycles
- 2024: R+26.8 2020: R+22.5 2016: R+27.9 2012: R+12.1 2008: R+7.0
Not yet ingested
- Civics
- —
Market trends
- HPI YoY
- ▼ -142.31%
- Current HPI
- 149.9169
- Rent YoY
- —
- Metro
- —
- State GDP YoY
- ▲ 2.41%
- F500 in state
- 34
Industry mix (Fortune 500 HQ in MN)
| Industry | F500 HQs | Revenue |
|---|---|---|
| Healthcare | 2 | $407B |
|
||
| Retail | 2 | $150B |
|
||
| Consumer Goods | 2 | $32B |
|
||
| Industrial Machinery | 2 | $6B |
|
||
| Agriculture | 1 | $40B |
|
||
| Healthcare / Medical Devices | 1 | $32B |
|
||
Price history
+272.5% since first listed17 events — show timeline
- 2026-04-08 Pending — NORTHSTARMLS as Distributed by MLS Grid
- 2026-04-05 Price Changed $130,000 NORTHSTARMLS as Distributed by MLS Grid
- 2026-03-07 Price Changed $150,000 NORTHSTARMLS as Distributed by MLS Grid
- 2025-12-31 Price Changed $178,000 NORTHSTARMLS as Distributed by MLS Grid
- 2025-10-26 Listed $190,000 NORTHSTARMLS as Distributed by MLS Grid
- 2025-10-13 Coming Soon $190,000 NORTHSTARMLS as Distributed by MLS Grid
- 2011-07-26 Sold (MLS) $38,000 NORTHSTARMLS as Distributed by MLS Grid
- 2011-06-09 Listing Removed — NORTHSTARMLS as Distributed by MLS Grid
- 2011-01-12 Listed $48,000 NORTHSTARMLS as Distributed by MLS Grid
- 2006-03-28 Sold (Public Records) $98,500 Public Records
- 2005-03-24 Sold (Public Records) $98,500 Public Records
- 2005-03-07 Sold (Public Records) $104,000 Public Records
- 2005-03-01 Sold (Public Records) $98,500 Public Records
- 2002-08-08 Sold (Public Records) $65,000 Public Records
- 2000-05-05 Sold (Public Records) $46,000 Public Records
- 2000-05-05 Sold (MLS) $48,000 NORTHSTARMLS as Distributed by MLS Grid
- 1999-07-24 Listed $34,900 NORTHSTARMLS as Distributed by MLS Grid
Property tax history
+3.7%/yrLatest (2025): $2,252 · +0.3% YoY. Source: county tax records.
Cash-flow waterfall
monthlySold comps — $/sqft
last 12 mo · ≤1 miLoading sold comps…