2514 Melbourne St · Houston, TX
Flood risk 6/10 · Moderate
- FEMA flood zone
- X (unshaded)
- Chance of flooding over 30 yrs
- 0.72%
- Est. flood insurance / yr
- $507 – $1,088
Fire risk 1/10 · Minimal
- Est. fire insurance / yr
- $1,222 – $2,270
Heat risk 9/10 · Severe
- Hot days now (above 109°F)
- 7 days/yr
- Hot days in 30 yrs
- 23 days/yr
Wind risk 9/10 · Severe
- Chance of severe wind over 30 yrs
- 99.0%
Air-quality risk 3/10 · Minor
- Unhealthy air days now
- 2 days/yr
- Unhealthy air days in 30 yrs
- 3 days/yr
Risk factors via First Street. Map © Google.
Why this score? — see what drove the B- grade
The composite is a weighted blend of 9 inputs, each scored 0–100. Each bar is that input's sub-score; the figure is the points it added to the 100-point composite (weight × sub-score).
- Cash flow +25.9/30.0
- DSCR +8.7/10.0
- 1% rule +8.5/10.0
- ARV discount +7.5/15.0
- Appreciation +6.9/10.0
- Livability +3.7/5.0
- Rent growth +3.3/5.0
- Schools +2.7/10.0
- Condition / age +2.5/5.0
$99,900
🖨 Deal sheet 📄 Offer letter ✓ Due diligence
Listing remarks
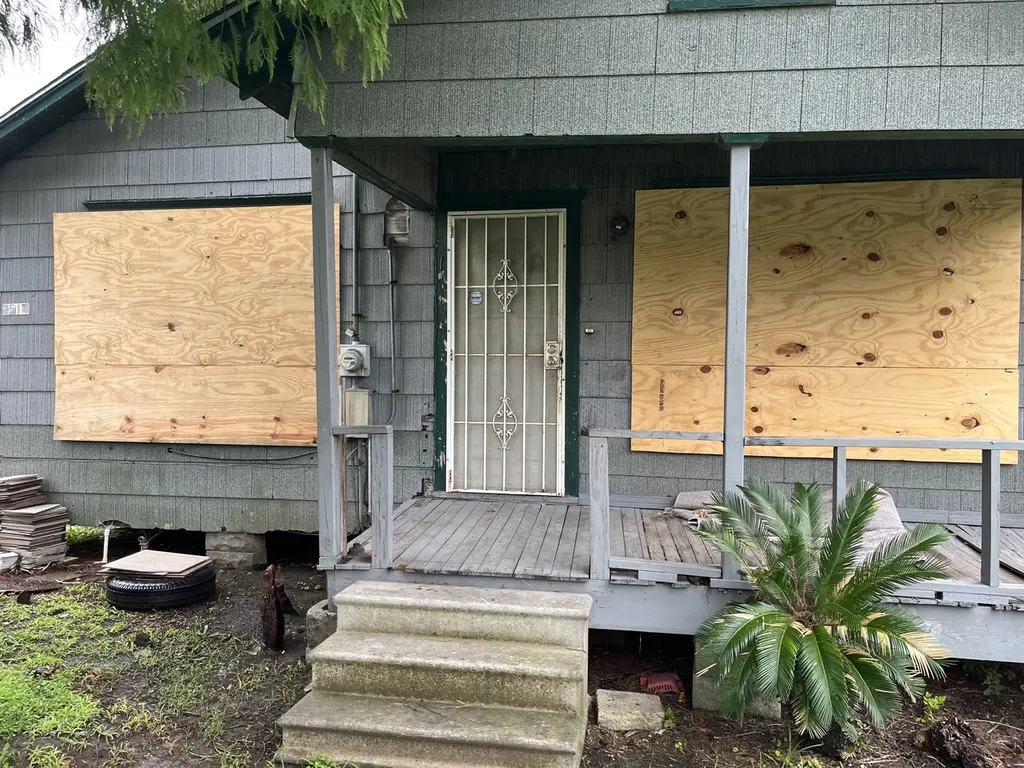
Investors and home renovators, this property is for you. It needs a complete floor plan redesign and update. It's a blank canvas waiting for a great design plan. The property currently has 4 bedrooms and 2 baths. The property can be gutted and rebuilt or torn down and a new property constructed. Property has a nice size back yard. Great access to Loop 610, Hwy 59/69; I-45 and the Hardy Toll Road. Downtown and Midtown Houston are a short drive away. The property is boarded up for safety concerns. Pls bring a strong light source when viewing. No long option periods. Verify all property information including room sizes. .
Key facts
- Great access to i-45
- Nice size back yard
- 8,498 sq ft lot
Tags
Property features AI
Finance
- Other: Seller disclosure available
Exterior
- Parking: Driveway; Electric gate
- Utilities: Public water; Public sewer
- Home design: Residential property; Fractional ownership; Built in 1940; Pillar/post/pier foundation
- Construction: Composition roof
- Exterior features: Fully fenced yard; Partial fencing; Asphalt road access; Subdivision lot setting
Interior
- Bedrooms: Up to 4 bedrooms
- Flooring: Carpet
- Bathrooms: 2 full bathrooms
- Interior features: Carpet flooring; No fireplaces; Six total rooms
Neighborhood map
What this means for you Summary
Snapshot
- This is a 3-bed/1.0-bath single-family listed at $100k.
Deal economics
- At list price, monthly cash flow is $245 ($3k/yr) — positive.
- The deal already cash-flows at list — no discount required.
- Meets the 1% rule at list price ($1k rent vs $100k).
- Cap rate 9.2% vs local median 3.2% in Houston — top-decile yield for the area; either an underpriced asset or a hidden risk that comps aren't pricing in. Stress-test before assuming the spread holds.
Location & tenants
- Location reads 74/100 on livability (#184 in TX, #4,771 nationally) — a middle-class / working-renter tenant base. Strengths: amenities A+, cost of living A+, housing A+; Watch: crime F.
- Houston ISD (urban): math 27% / reading 35% proficiency, ranked #593 of 826 in TX (top 72%) — families likely to look elsewhere, expect single-tenant / working-renter base with shorter leases; 71% free/reduced lunch — lower-income household profile, screen leases tightly.
- Zoned schools: Key Middle (math 10% / reading 20%, grade F, #1,569 of 1,662 statewide, top 95%, 615 students, 100% FRL); Northside H S (math 15% / reading 26%, grade F, #1,389 of 1,632 statewide, top 86%, 1,168 students, 94% FRL) — zoned schools average 97% FRL vs 71% district-wide (26 pts higher); higher-poverty schools than district average — tighter screening recommended.
- Zoned-school proficiency averages 18% at this address vs 31% district-wide (-13 pts) — the specific schools serving this property underperform the Houston ISD average; the district grade overstates school quality for this exact location.
- Market conditions: Rents rising (+3.1%/yr); 445 active listings in the ZIP; 14 comparable units currently listed for rent nearby; rentals at typical pace (median 17d on market — plan ~3-4 weeks tenant-placement turnaround); lower-income renter base — watch delinquency; 29,883 units permitted in Harris County in 2024 (8,621 in 5+ unit buildings).
- This rent runs 41% of the median local income ($39k/yr) — at the standard rent-burdened threshold; future hikes will face affordability resistance.
Forward outlook
- In year one you build about $5k of equity ($691 loan paydown + $4k appreciation (3.9% local appreciation)).
- Harris County population projected at +47% by 2050 — long-run rental-demand tailwind backs the buy-and-hold thesis.
- At projected returns (3.9% appreciation + 3.1% rent growth), your $28k cash investment doubles in ~4 years — after that, you're playing with house money.
- By year 8, paydown + projected appreciation supports a ~$34k cash-out refi (75% LTV) — recoverable capital for the next deal without selling this one.
Negotiation context
- Only 2 days on market — expect competitive offers; lowballing is unlikely to land.
Risks & watch-outs
- Watch-outs: property tax is 3.1% of price; built in 1940 — expect roof / HVAC / electrical / plumbing capex.
- Climate carrying-cost: major flood risk; severe wind risk, 99% chance of damaging wind over 30y; extreme-heat days projected 7→23/yr by 2055 (HVAC capex compounding) — expect insurance premiums to compound above CPI over the hold.
Questions for the listing agent
- Built in 1940 — when were the roof, HVAC, electrical panel, plumbing, and water heater last replaced?
- Property tax is high relative to price — has the assessment been appealed recently, and will the sale trigger a re-assessment?
- Is there a deadline driving the sale (1031 exchange, divorce, estate, relocation)? That informs how much negotiation room exists.
- Schools are D-rated, which usually means shorter tenancies and higher turnover. Who's the typical renter profile here, and what's been the actual vacancy rate?
- Crime grade is F in this area — have there been break-ins, vandalism, or insurance claims at this property in the last 3 years? What carrier currently insures it and at what premium?
- What's the average days-on-market for RENTAL listings here right now (not sales)? A rising rental-DOM trend means longer vacancies and softer asking-rent achievability than the comps imply.
- What's the recent tenant-quality profile in this submarket — average credit score on applications, eviction rate, late-payment / NSF rate, and stable-employment percentage? A property-management company in the area should have these aggregated.
- How much new for-sale + rental construction is in the pipeline within 1–3 miles? Heavy new supply typically softens prices + rents 12–24 months out; constrained supply supports both.
Investment metrics
- 1% rule
- 1.35% ✓
- Cap rate
- 9.23%
- Cash-on-cash
- 10.50%
- DSCR
- 1.47
- GRM
- 6.2
CMA / ARV
- ARV (on-the-fly)
- $233,376
- Comps found
- 12
Show comp detail 12 sales within ~0.75 mi
| Address | Dist | Beds/Ba | Sqft | Sold | Price | $/sf | Match |
|---|---|---|---|---|---|---|---|
| 6512 Jensen Dr | 0.26mi | 3/— | 1,259 (+1%) | 18mo | $249,999 | $199 | 71 |
| 1410 Caplin St | 0.57mi | 3/1.0 | 1,209 (-3%) | 0mo | $154,000 | $127 | 68 |
| 3401 Melbourne St | 0.41mi | 3/1.0 | 1,346 (+8%) | 3mo | $125,000 | $93 | 66 |
| 1909 Melbourne St | 0.29mi | 3/2.0 | 1,364 (+9%) | 5mo | $259,000 | $190 | 63 |
| 6903 Semmes St | 0.46mi | 3/1.0 | 1,350 (+8%) | 3mo | $399,900 | $296 | 63 |
| 3012 Melbourne St | 0.26mi | 3/1.0 | 1,075 (-14%) | 4mo | $169,000 | $157 | 62 |
| 2010 King St | 0.26mi | 3/2.0 | 1,400 (+12%) | 3mo | $269,000 | $192 | 61 |
| 2915 Creston Dr | 0.28mi | 3/2.0 | 1,392 (+12%) | 5mo | $89,000 | $64 | 60 |
| 2719 Milwaukee St | 0.49mi | 3/3.0 | 1,148 (-8%) | 2mo | $215,000 | $187 | 54 |
| 5708 Elysian St | 0.53mi | 3/2.5 | 1,388 (+11%) | 1mo | $249,900 | $180 | 50 |
| 7110 Eugene St | 0.49mi | 3/1.0 | 1,098 (-12%) | 14mo | $190,777 | $174 | 45 |
| 5801 Terry St | 0.63mi | 3/2.0 | 1,360 (+9%) | 16mo | $275,000 | $202 | 38 |
Match score weights: distance 35% · size 25% · config 20% · recency 20%. Top-matched comps best support the ARV.
Projected returns pro-forma
3.89% appreciation · 3.08% rent growth · sell at horizon
- IRR
- 19.5%
- Equity multiple
- 2.17×
- Total profit
- $32,636
- Equity at exit
- $50,026
- IRR
- 20.2%
- Equity multiple
- 4.18×
- Total profit
- $88,923
- Equity at exit
- $81,327
Cash invested: $27,972 (down + closing). Projections, not guarantees.
Landlord ↔ Tenant lean methodology
- Overall (STATE)
- 87 Strongly Landlord-Friendly
- State Texas
- 87 Strongly Landlord-Friendly · R+5
- County
- — inherits STATE
- City
- — inherits STATE
ZIP-level market 77026
- Home prices YoY
- 1.5%
- Rents YoY
- 3.1%
- Active inventory
- 445
- Price-to-rent
- 6.2×
Monthly cashflow live
- Estimated rent
- $1,349 high interval (Pro) →
- Mortgage (P&I)
- −$524
- Tax from tax record
- −$255 /mo · $3,064/yr
- Insurance
- −$42
- HOA
- −$0
- Vacancy / Maint / Mgmt
- −$283
- Net cashflow
- $245
Break-even live
UW: 25.0% down · 7.5% · 30yr · 1.5% tax · 5.0% vac · 8.0% maint · 8.0% mgmt
Financing live
Cash to close
- Down payment
- $24,975
- Closing costs
- $2,997
- Reserves months
- —
- Total cash needed
- —
Loan-product check · same deal, 3 products live
Conventional
25% down · 7.5% · 30yr
- Down + closing
- —
- Monthly P&I
- —
- Monthly cashflow
- —
- DSCR
- —
- Eligible?
- —
Personal DTI + credit; lowest rate.
DSCR
20% down · 8.5% · 30yr
- Down + closing
- —
- Monthly P&I
- —
- Monthly cashflow
- —
- DSCR
- —
- Eligible?
- —
No personal income docs; deal must DSCR.
Hard money
10% down · 12.0% · 12mo
- Down + closing
- —
- Monthly P&I
- —
- Monthly cashflow
- —
- DSCR
- —
- Eligible?
- —
Short-term bridge; refi at stabilization.
Rent comps 14 comps
| Address | Beds | Baths | Sqft | Rent | $/sqft | DOM | Units | Dist |
|---|---|---|---|---|---|---|---|---|
| 2110 Melbourne St Unit 3 Houston, TX | 2.0 | 1.0 | 825 | $1,350 | $1.64 | 24d | 1 | 0.17mi |
| 3107 Melbourne St Houston, TX | 3.0 | 1.0 | 956 | $1,500 | $1.57 | 43d | 1 | 0.31mi |
| 6869 Arto St Houston, TX | 1.0–2.0 | 1.0 | 900 | $950 | $1.06 | 17d | 6 | 0.46mi |
| 7301 Jensen Dr Unit 50 Houston, TX | 2.0 | 1.0 | 880 | $999 | $1.14 | 7d | 1 | 0.57mi |
| 7301 Jensen Dr Apt 12 Houston, TX | 2.0 | 1.0 | 880 | $930 | $1.06 | 7d | 1 | 0.57mi |
| 7320 Jensen Dr Houston, TX | 1.0–3.0 | 1.0–2.0 | 935 | $1,176 | $1.26 | 2d | 5 | 0.64mi |
| 2516 Ivy St Houston, TX | 3.0 | 1.0 | 1200 | $1,500 | $1.25 | 43d | 1 | 0.73mi |
| 7506 Jensen Dr Houston, TX | 1.0–2.0 | 1.0–2.0 | 772 | $1,160 | $1.50 | 4d | 12 | 0.73mi |
| 3810 Lynnfield St Houston, TX | 3.0 | 2.0 | 1298 | $1,599 | $1.23 | 15d | 1 | 0.74mi |
| 3812 Lynnfield St Houston, TX | 3.0 | 2.0 | 1298 | $1,545 | $1.19 | 5d | 1 | 0.76mi |
| 6918 Irvington Blvd Houston, TX | 2.0 | 2.0 | 1100 | $1,550 | $1.41 | 43d | 1 | 1.03mi |
| 4711 Sayers St Unit A Houston, TX | 2.0 | 1.0 | 1200 | $1,650 | $1.38 | 43d | 1 | 1.22mi |
| 4626 Shreveport Blvd Unit B Houston, TX | 3.0 | 2.0 | 1150 | $1,490 | $1.30 | 14d | 1 | 1.38mi |
| 4111 Cavalcade St Unit 5 Houston, TX | 2.0 | 1.0 | 757 | $825 | $1.09 | 43d | 1 | 1.43mi |
Listing history 2 events
-
2026-06-13remarks 626-char remark
-
2026-06-13$99,900 Pending 2 DOM
ⓘ Source: listings_history table (triggers on properties + properties_extension) + one-shot
backfill from property_details.listing_events for pre-trigger history.
Tax reassessment forecast TX · Resets to sale price
- Current annual tax
- $3,064 · $255/mo
- Projected year-2 tax
- $3,064 · $255/mo
- Expected delta
- $0/yr ($0/mo · 0.0%)
ⓘ Screening estimate from a state-policy table — verify with the county assessor before closing.
Climate risk First Street
- Flood 6/10 Major FEMA zone X (unshaded) · 72% chance over 30 yrs
- Wildfire 1/10 Low
- Heat 9/10 Extreme 7 d/yr ≥109°F today · 23 d/yr by 30 yrs out
- Wind 9/10 Extreme 99% chance of damaging wind over 30 yrs
- Air quality 3/10 Moderate 2 unhealthy d/yr today · 3 by 30 yrs out
Nearby sold comps map
Loading sold comps map…
Walkable amenities ~0.75 mi
Loading nearby amenities…
Taxation est. · year 1
- Rental income
- $16,187
- − Mortgage interest
- −$5,596
- − Property taxes
- −$3,064
- − Insurance
- −$500
- − Repairs & maintenance
- −$1,295
- − Management
- −$1,295
- − Depreciation
- −$2,906
- Taxable income
- $1,532
- Est. tax owed @ 24.0%
- −$368
- After-tax cash flow
- $2,570/yr
For passive investors: Depreciation is non-cash, so a rental often shows a tax loss while cash-flowing — sheltering income. Rental losses are passive: they offset passive income freely, and up to $25,000/yr can offset ordinary (W-2) income if you actively participate and your MAGI is under $100k (phasing out to $0 by $150k); unused losses carry forward. On sale, claimed depreciation is recaptured at up to 25%, and gains may owe capital-gains tax (a 1031 exchange can defer both). Figures are a year-1 estimate at your 24.0% rate — not tax advice; consult a CPA.
Schools (NCES district)
- District
- Houston ISD
- NCES district ID
- 4823640
- Math proficiency
- 27% ▼ -18.00%
- Reading proficiency
- 35% ▼ -6.00%
- Median HH income
- $46,054
- Composite
- 26.63/100
- National rank
- #7173
- State rank
- #593 of 826 in TX
Livability — Houston
- Score
- 74/100
- State rank
- #184
- US rank
- #4771
Category grades
Schools grade is shown separately in the Schools card above.
Census & demographics
- Census place
- Houston, TX
- County
- Harris County · 4,702,590 people
- City population
- 3,226,434
- Metro
- Houston-The Woodlands-Sugar Land, TX
- Population (ZIP)
- 21,981
- Household income
- $39,211
- Rent vs Own
- Severe rent burden
- 1531.0
Population outlook (Harris County) Hauer SSP2
- Today (2025)
- 5,571,493 people
- By 2030
- 6,089,821 · +9.3%
- By 2040
- 7,142,806 · +28.2%
- By 2050
- 8,185,864 · +46.9%
- By 2075
- 10,574,329 · +89.8%
- By 2100
- 12,109,958 · +117.4%
Race, ethnicity, and origin ACS 2023
- Neighborhood character
- Diverse neighborhood (Simpson 0.56)
- Race & ethnicity
- Black 49% Hispanic / Latino 44% Two or more races 18% White 5% Native American 1%
- Hispanic origin (detail)
- Mexican 34%
- Common ancestry
- Lithuanian 1%
- Foreign-born
- 15% · Canada
- Languages at home
- 61% English-only · Spanish 39%
Political lean MEDSL · Harris
- 2024 margin
- Lean D (+5.5) · D 52.0% · R 46.4% · Other 1.6%
- 2008→2024 swing
- +3.9pp toward D · 2008: 1.6pp · 2024: 5.5pp
- All cycles
- 2024: D+5.5 2020: D+13.3 2016: D+12.4 2012: D+0.1 2008: D+1.6
Not yet ingested
- Civics
- —
Market trends
- HPI YoY
- ▲ 3.89%
- Current HPI
- 267.5995
- Rent YoY
- ▲ 3.08%
- Metro
- Houston-The Woodlands-Sugar Land, TX
- State GDP YoY
- ▲ 3.95%
- F500 in state
- 110
Industry mix (Fortune 500 HQ in TX)
| Industry | F500 HQs | Revenue |
|---|---|---|
| Energy | 16 | $1,198B |
|
||
| Technology | 5 | $198B |
|
||
| Engineering / Construction | 4 | $72B |
|
||
| Energy Services | 3 | $60B |
|
||
| Utilities | 3 | $41B |
|
||
| Healthcare | 2 | $330B |
|
||
Price history
5 events — show timeline
- 2026-06-12 Pending — HARMLS
- 2026-06-10 Listed $99,900 HARMLS
- 2026-05-21 Sold (Public Records) — Public Records
- 2026-05-01 Sold (Public Records) — Public Records
- 1988-01-02 Sold (Public Records) — Public Records
Property tax history
+8.7%/yrLatest (2025): $3,064 · -5.5% YoY. Source: county tax records.
Cash-flow waterfall
monthlySold comps — $/sqft
last 12 mo · ≤1 miLoading sold comps…