 🌊 Lakefront
4064 Lcr 254 · Lake Colorado City, TX
Flood risk 1/10 · Minimal
- FEMA flood zone
- X
- Chance of flooding over 30 yrs
- 0.0%
- Est. flood insurance / yr
- $507 – $1,088
Fire risk 5/10 · Moderate
- Est. fire insurance / yr
- $1,222 – $2,270
Heat risk 7/10 · Major
- Hot days now (above 104°F)
- 7 days/yr
- Hot days in 30 yrs
- 21 days/yr
Wind risk 3/10 · Minor
- Chance of severe wind over 30 yrs
- 7.0%
Air-quality risk 1/10 · Minimal
- Unhealthy air days now
- 0 days/yr
- Unhealthy air days in 30 yrs
- 0 days/yr
Risk factors via First Street. Map © Google.
Why this score? — see what drove the B+ grade
The composite is a weighted blend of 9 inputs, each scored 0–100. Each bar is that input's sub-score; the figure is the points it added to the 100-point composite (weight × sub-score).
- Cash flow +30.0/30.0
- 1% rule +10.0/10.0
- DSCR +10.0/10.0
- ARV discount +7.5/15.0
- Appreciation +7.2/10.0
- Schools +4.3/10.0
- Livability +3.2/5.0
- Rent growth +2.5/5.0
- Condition / age +1.0/5.0
$49,000
🖨 Deal sheet 📄 Offer letter ✓ Due diligence
Listing remarks MLS
Lake front property!! Westbrook ISD!! This adorable home is ready for your touches! Carport and dock.
Key facts
- Dock
- Lake front property
- Carport
Tags
Neighborhood map
What this means for you Summary
Snapshot
- This is a 2-bed/1.0-bath single-family listed at $49k. Condition is rated poor.
Deal economics
- At list price, monthly cash flow is $520 ($6k/yr) — positive.
- The deal already cash-flows at list — no discount required.
- Meets the 1% rule at list price ($1k rent vs $49k).
- Recommended offer: $43k (12.0% below list) — sets the bar for market timing.
Location & tenants
- Location reads 64/100 on livability (#782 in TX) — a middle-class / working-renter tenant base. Strengths: employment A+, cost of living A+, housing A+; Watch: health & safety C-, schools F, crime F.
- Westbrook ISD (rural): math 50% / reading 45% proficiency, ranked #429 of 1,141 in TX (top 38%) — families likely to look elsewhere, expect single-tenant / working-renter base with shorter leases.
- Market conditions: 84 active listings in the ZIP.
Forward outlook
- In year one you build about $2k of equity ($339 loan paydown + $2k appreciation (4.4% local appreciation)).
- Mitchell County population projected at +8% by 2050 — modest demand growth; plan on rents tracking national, not racing it.
- At projected returns (4.4% appreciation + 3.0% rent growth), your $14k cash investment doubles in ~2 years — after that, you're playing with house money.
Negotiation context
- It's been on market 321 days — a 12% lower offer ($43k) is reasonable based on typical stale-listing flexibility.
Risks & watch-outs
- Watch-outs: built in 1945 — expect roof / HVAC / electrical / plumbing capex.
- Climate carrying-cost: moderate wildfire risk; extreme-heat days projected 7→21/yr by 2055 (HVAC capex compounding) — expect insurance premiums to compound above CPI over the hold.
Questions for the listing agent
- It's been on market 321 days. Have you received any prior offers? Is the seller open to a 12% concession, seller financing, or rate buy-down credit?
- Have any recent inspections been done? Can we get a copy of the seller's disclosures and any deferred-maintenance estimates?
- Built in 1945 — when were the roof, HVAC, electrical panel, plumbing, and water heater last replaced?
- Why hasn't it sold? Are there any deal-killer items the seller is aware of (foundation, flood, title, zoning, code violations)?
- Is there a deadline driving the sale (1031 exchange, divorce, estate, relocation)? That informs how much negotiation room exists.
- Schools are F-rated, which usually means shorter tenancies and higher turnover. Who's the typical renter profile here, and what's been the actual vacancy rate?
- Crime grade is F in this area — have there been break-ins, vandalism, or insurance claims at this property in the last 3 years? What carrier currently insures it and at what premium?
- This sits on a lake — are riparian / water-frontage rights deeded with the parcel? Any dock permits, shoreline easements, or HOA water-use restrictions?
- What's the documented flood / surge / shoreline-erosion history here (FEMA AND non-FEMA — e.g., storm surge, creek backup, septic-field saturation)?
- Any water-quality or seasonal algae-bloom issues that affect tenant satisfaction or short-term-rental demand?
- What's the average days-on-market for RENTAL listings here right now (not sales)? A rising rental-DOM trend means longer vacancies and softer asking-rent achievability than the comps imply.
- What's the recent tenant-quality profile in this submarket — average credit score on applications, eviction rate, late-payment / NSF rate, and stable-employment percentage? A property-management company in the area should have these aggregated.
- How much new for-sale + rental construction is in the pipeline within 1–3 miles? Heavy new supply typically softens prices + rents 12–24 months out; constrained supply supports both.
Investment metrics
- 1% rule
- 2.22% ✓
- Cap rate
- 19.03%
- Cash-on-cash
- 45.48%
- DSCR
- 3.02
- GRM
- 3.8
CMA / ARV
No comps found within radius.
Projected returns pro-forma
4.37% appreciation · 3.0% rent growth · sell at horizon
- IRR
- 52.6%
- Equity multiple
- 4.11×
- Total profit
- $42,687
- Equity at exit
- $25,916
- IRR
- 50.9%
- Equity multiple
- 8.39×
- Total profit
- $101,336
- Equity at exit
- $43,266
Cash invested: $13,720 (down + closing). Projections, not guarantees.
Landlord ↔ Tenant lean methodology
- Overall (STATE)
- 87 Strongly Landlord-Friendly
- State Texas
- 87 Strongly Landlord-Friendly · R+5
- County
- — inherits STATE
- City
- — inherits STATE
ZIP-level market 79512
- Home prices YoY
- 4.6%
- Active inventory
- 84
- Price-to-rent
- 3.8×
Monthly cashflow live
- Estimated rent
- $1,087 medium interval (Pro) →
- Mortgage (P&I)
- −$257
- Tax est. 1.5%
- −$61 /mo · $735/yr
- Insurance
- −$20
- HOA
- −$0
- Vacancy / Maint / Mgmt
- −$228
- Net cashflow
- $520
Break-even live
UW: 25.0% down · 7.5% · 30yr · 1.5% tax · 5.0% vac · 8.0% maint · 8.0% mgmt
Financing live
Cash to close
- Down payment
- $12,250
- Closing costs
- $1,470
- Reserves months
- —
- Total cash needed
- —
Loan-product check · same deal, 3 products live
Conventional
25% down · 7.5% · 30yr
- Down + closing
- —
- Monthly P&I
- —
- Monthly cashflow
- —
- DSCR
- —
- Eligible?
- —
Personal DTI + credit; lowest rate.
DSCR
20% down · 8.5% · 30yr
- Down + closing
- —
- Monthly P&I
- —
- Monthly cashflow
- —
- DSCR
- —
- Eligible?
- —
No personal income docs; deal must DSCR.
Hard money
10% down · 12.0% · 12mo
- Down + closing
- —
- Monthly P&I
- —
- Monthly cashflow
- —
- DSCR
- —
- Eligible?
- —
Short-term bridge; refi at stabilization.
Listing history 5 events
-
2026-05-31days on market $49,000 Active 321 DOM
-
2026-01-05price $49,000 101-char remark
Show marketing remark (101 chars)
Lake front property!! Westbrook ISD!! This adorable home is ready for your touches! Carport and dock.
-
2025-10-29price $54,000 101-char remark
Show marketing remark (101 chars)
Lake front property!! Westbrook ISD!! This adorable home is ready for your touches! Carport and dock.
-
2025-07-14$69,000 Active 101-char remark
Show marketing remark (101 chars)
Lake front property!! Westbrook ISD!! This adorable home is ready for your touches! Carport and dock.
-
2024-10-23price $49,000
ⓘ Source: listings_history table (triggers on properties + properties_extension) + one-shot
backfill from property_details.listing_events for pre-trigger history.
Climate risk First Street
- Flood 1/10 Low FEMA zone X · 0% chance over 30 yrs
- Wildfire 5/10 Major
- Heat 7/10 Severe 7 d/yr ≥104°F today · 21 d/yr by 30 yrs out
- Wind 3/10 Moderate 7% chance of damaging wind over 30 yrs
- Air quality 1/10 Low 0 unhealthy d/yr today · 0 by 30 yrs out
Nearby sold comps map
Loading sold comps map…
Walkable amenities ~0.75 mi
Loading nearby amenities…
Taxation est. · year 1
- Rental income
- $13,042
- − Mortgage interest
- −$2,745
- − Property taxes
- −$735
- − Insurance
- −$245
- − Repairs & maintenance
- −$1,043
- − Management
- −$1,043
- − Depreciation
- −$1,425
- Taxable income
- $5,805
- Est. tax owed @ 24.0%
- −$1,393
- After-tax cash flow
- $4,846/yr
For passive investors: Depreciation is non-cash, so a rental often shows a tax loss while cash-flowing — sheltering income. Rental losses are passive: they offset passive income freely, and up to $25,000/yr can offset ordinary (W-2) income if you actively participate and your MAGI is under $100k (phasing out to $0 by $150k); unused losses carry forward. On sale, claimed depreciation is recaptured at up to 25%, and gains may owe capital-gains tax (a 1031 exchange can defer both). Figures are a year-1 estimate at your 24.0% rate — not tax advice; consult a CPA.
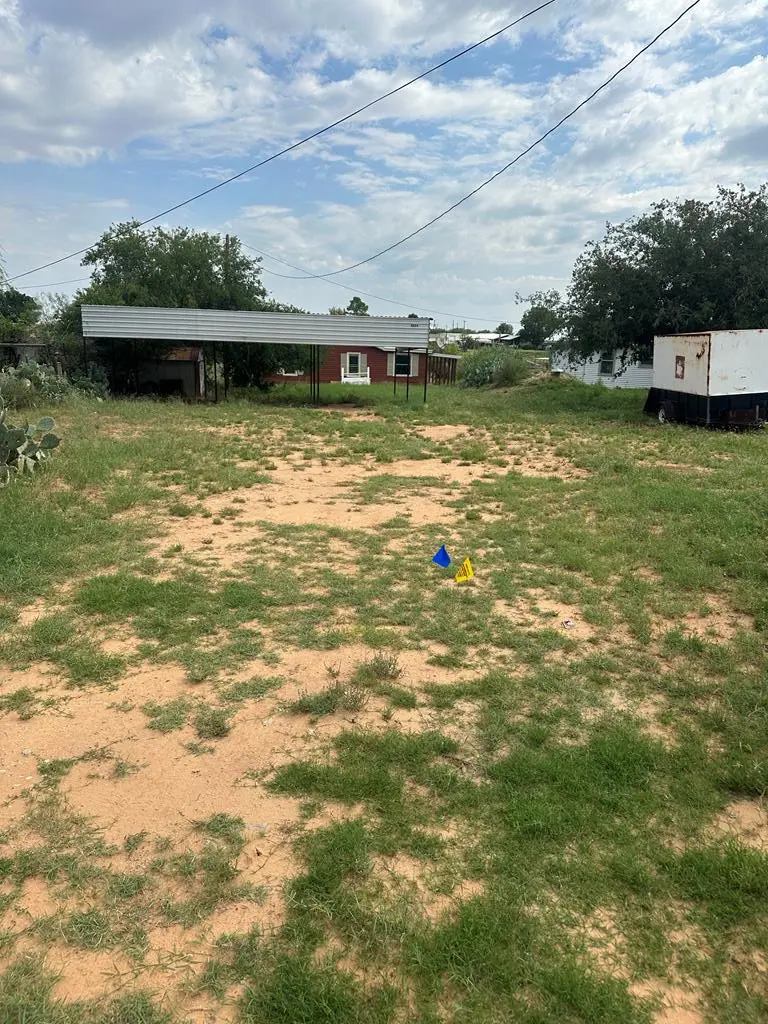
Condition & rehab AI · 2 photos
This property requires extensive repairs and maintenance, including landscaping and exterior work, to improve its condition and value.
Repairs flagged
- Major landscaping — Overgrown vegetation
- Major exterior maintenance — Lack of maintenance
Value-add opportunities
- Both Landscaping and exterior maintenance — Improves curb appeal and property value
- Both Interior updates — Enhances living space and appeal
- Both Kitchen and bathroom updates — Modernizes and increases functionality
Renovation cost estimate screening
| Repair item | Severity | Est. cost |
|---|---|---|
| landscaping · Overgrown vegetation | Major | $15,000–50,000 |
| exterior maintenance · Lack of maintenance | Major | $15,000–50,000 |
| Total estimated repair cost · 2 items | $30,000–100,000 |
Value-add ROI direction
- Both Landscaping and exterior maintenance — Improves curb appeal and property value ↑
- Both Interior updates — Enhances living space and appeal ↑
- Both Kitchen and bathroom updates — Modernizes and increases functionality ↑
ⓘ Cost ranges are severity-bucket heuristics (US national rule-of-thumb). Get contractor quotes + a written scope before underwriting a rehab budget.
Schools (NCES district)
- District
- Westbrook ISD
- NCES district ID
- 4845210
- Math proficiency
- 50% ▲ 10.00%
- Reading proficiency
- 45% ▲ 5.00%
- Median HH income
- $51,806
- Composite
- 43.02/100
- National rank
- #6658
- State rank
- #429 of 1141 in TX
Livability — Lake Colorado City
- Score
- 64/100
- State rank
- #782
- US rank
- #14249
Category grades
Schools grade is shown separately in the Schools card above.
Census & demographics
- Census place
- Lake Colorado City, TX
- City population
- 7,672
- Population (ZIP)
- 7,672
Population outlook (Mitchell County) Hauer SSP2
- Today (2025)
- 8,476 people
- By 2030
- 8,723 · +2.9%
- By 2040
- 9,046 · +6.7%
- By 2050
- 9,200 · +8.5%
- By 2075
- 8,936 · +5.4%
- By 2100
- 7,978 · -5.9%
Race, ethnicity, and origin ACS 2023
- Neighborhood character
- Diverse neighborhood (Simpson 0.64)
- Race & ethnicity
- White 47% Hispanic / Latino 37% Two or more races 20% Black 6% Asian 2%
- Hispanic origin (detail)
- Mexican 34%
- Common ancestry
- Serbian 2% Lithuanian 1% Slovak 1%
- Foreign-born
- 3% · Canada
- Languages at home
- 80% English-only · Spanish 18% Tagalog/Filipino 1%
Political lean MEDSL · Mitchell
- 2024 margin
- Solid R (+71.3) · D 14.0% · R 85.3%
- 2008→2024 swing
- -20.8pp toward R · 2008: -50.5pp · 2024: -71.3pp
- All cycles
- 2024: R+71.3 2020: R+68.8 2016: R+65.2 2012: R+52.7 2008: R+50.5
Not yet ingested
- Civics
- —
Market trends
- HPI YoY
- ▲ 4.37%
- Current HPI
- 99.8822
- Rent YoY
- —
- Metro
- —
- State GDP YoY
- ▲ 3.95%
- F500 in state
- 110
Industry mix (Fortune 500 HQ in TX)
| Industry | F500 HQs | Revenue |
|---|---|---|
| Energy | 16 | $1,198B |
|
||
| Technology | 5 | $198B |
|
||
| Engineering / Construction | 4 | $72B |
|
||
| Energy Services | 3 | $60B |
|
||
| Utilities | 3 | $41B |
|
||
| Healthcare | 2 | $330B |
|
||
Price history
+0.0% since first listed4 events — show timeline
- 2026-01-05 Price Changed $49,000 PBBOR
- 2025-10-29 Price Changed $54,000 PBBOR
- 2025-07-14 Listed $69,000 PBBOR
- 2024-10-23 Price Changed $49,000 PBBOR
Cash-flow waterfall
monthlySold comps — $/sqft
last 12 mo · ≤1 miLoading sold comps…