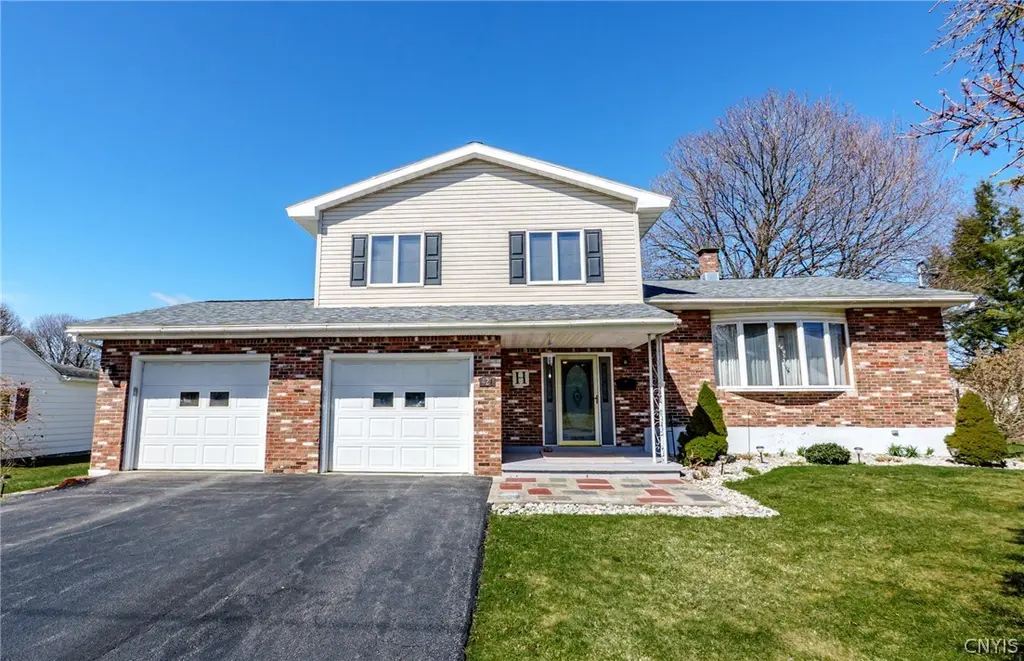
421 Buchanan Rd · Utica, NY
Flood risk 1/10 · Minimal
- FEMA flood zone
- X (unshaded)
- Chance of flooding over 30 yrs
- 0.0%
- Est. flood insurance / yr
- $473 – $860
Fire risk 1/10 · Minimal
- Est. fire insurance / yr
- $691 – $1,283
Heat risk 3/10 · Minor
- Hot days now (above 96°F)
- 7 days/yr
- Hot days in 30 yrs
- 16 days/yr
Wind risk 2/10 · Minimal
- Chance of severe wind over 30 yrs
- 1.0%
Air-quality risk 2/10 · Minimal
- Unhealthy air days now
- 0 days/yr
- Unhealthy air days in 30 yrs
- 1 days/yr
Risk factors via First Street. Map © Google.
Why this score? — see what drove the D- grade
The composite is a weighted blend of 9 inputs, each scored 0–100. Each bar is that input's sub-score; the figure is the points it added to the 100-point composite (weight × sub-score).
- Cash flow +13.5/30.0
- DSCR +4.1/10.0
- ARV discount +4.0/15.0
- Livability +4.0/5.0
- 1% rule +3.6/10.0
- Schools +2.9/10.0
- Rent growth +2.5/5.0
- Condition / age +2.5/5.0
- Appreciation +0.0/10.0
$289,900
🖨 Deal sheet (PDF) 📄 Offer letter ✓ Due diligence
Listing remarks MLS
Wide open and delightful, this 3 bedroom split will surprise you with its open contemporary design, Volume ceilings, and fire placed family room. Great Spot!
Key facts
- 0.23 acre lot
- 2 garage spots
- Built 1983
Neighborhood map
What this means for you Summary
Snapshot
- This is a 3-bed/1.5-bath single-family listed at $290k.
Deal economics
- At list price, monthly cash flow is $12 ($143/yr) — positive.
- The deal already cash-flows at list — no discount required.
- To meet the 1% rule (rent ≥ 1% of price), the offer needs to be $248k (14.3% below list).
- Recommended offer: $248k (14.3% below list) — sets the bar for 1% rule.
Location & tenants
- Location reads 80/100 on livability (#104 in NY, #1,589 nationally) — a professional / high-income tenant draw. Strengths: commute A+, cost of living A+, housing A+; Watch: employment D, crime F.
- Utica City School District (urban): math 33% / reading 38% proficiency, ranked #562 of 590 in NY (top 95%) — families likely to look elsewhere, expect single-tenant / working-renter base with shorter leases; 71% free/reduced lunch — lower-income household profile, screen leases tightly.
- Zoned schools: Thomas Jefferson Elementary School (math 28% / reading 41%, grade F, #1,577 of 2,108 statewide, top 77%, 456 students, 80% FRL); John F Kennedy Middle School (math 27% / reading 35%, grade F, #534 of 729 statewide, top 73%, 695 students, 77% FRL); Thomas R Proctor High School (math 86% / reading 62%, grade B+, #659 of 1,100 statewide, top 60%, 2,675 students, 76% FRL).
- Market conditions: 150 active listings in the ZIP; 2 comparable units currently listed for rent nearby; 204 units permitted in Oneida County in 2024 (68 in 5+ unit buildings).
- At $2,484/mo this rent would consume 52% of the median local household income ($58k/yr) (locally 1604% of renters already pay >50% of income on rent) — very limited rent-growth headroom before tenants either downsize or default.
Forward outlook
- Local home prices are declining (-3.0%/yr); year-one equity from $2k of loan paydown is wiped out by about $9k of value loss. Plan a longer hold.
- Oneida County population projected at -12% by 2050 — secular population decline; favor cash flow + early exit over multi-decade hold.
Negotiation context
- Only 5 days on market — expect competitive offers; lowballing is unlikely to land.
- 3 sale attempts since 8y ago with the ask held roughly flat each time — persistent listings suggest the price (not the market) is what's stuck; bring a comps-based counter.
- Current owner paid $150k; list at $290k implies a 93% gain — meaningful room to come down on a strong offer.
Questions for the listing agent
- Is there a deadline driving the sale (1031 exchange, divorce, estate, relocation)? That informs how much negotiation room exists.
- Schools are D-rated, which usually means shorter tenancies and higher turnover. Who's the typical renter profile here, and what's been the actual vacancy rate?
- Crime grade is F in this area — have there been break-ins, vandalism, or insurance claims at this property in the last 3 years? What carrier currently insures it and at what premium?
- The area grade is low — what's the realistic commute time and amenity access for the typical tenant pool here? Any planned neighborhood developments (good or bad) we should know about?
- What's the average days-on-market for RENTAL listings here right now (not sales)? A rising rental-DOM trend means longer vacancies and softer asking-rent achievability than the comps imply.
- What's the recent tenant-quality profile in this submarket — average credit score on applications, eviction rate, late-payment / NSF rate, and stable-employment percentage? A property-management company in the area should have these aggregated.
- How much new for-sale + rental construction is in the pipeline within 1–3 miles? Heavy new supply typically softens prices + rents 12–24 months out; constrained supply supports both.
Investment metrics
- 1% rule
- 0.86% ✗
- Cap rate
- 6.34%
- Cash-on-cash
- 0.18%
- DSCR
- 1.01
- GRM
- 9.7
CMA / ARV
- ARV (on-the-fly)
- $268,736
- Comps found
- 12
Show comp detail 12 sales within ~0.75 mi
| Address | Dist | Beds/Ba | Sqft | Sold | Price | $/sf | Match |
|---|---|---|---|---|---|---|---|
| 421 Buchanan Rd | 0.00mi | 3/1.5 | 1,768 (0%) | 1mo | $297,000 | $168 | 99 |
| 625 Cosby Rd | 0.27mi | 3/2.0 | 1,600 (-10%) | 3mo | $325,000 | $203 | 67 |
| 410 Utica Rd | 0.09mi | 3/1.0 | 1,541 (-13%) | 7mo | $164,800 | $107 | 66 |
| 407 Kingston Rd | 0.32mi | 3/1.0 | 1,664 (-6%) | 14mo | $240,000 | $144 | 62 |
| 405 Spratt Pl | 0.43mi | 3/2.0 | 1,635 (-8%) | 6mo | $190,000 | $116 | 61 |
| 103 Riverside Dr | 0.43mi | 3/1.5 | 1,596 (-10%) | 8mo | $200,000 | $125 | 57 |
| 136 Forrest St | 0.71mi | 3/1.0 | 1,844 (+4%) | 1mo | $280,000 | $152 | 56 |
| 614 Utica Rd | 0.19mi | 4/2.0 (+1) | 1,980 (+12%) | 12mo | $234,000 | $118 | 54 |
| 161 Forrest St | 0.55mi | 4/2.5 (+1) | 1,650 (-7%) | 8mo | $290,000 | $176 | 48 |
| 626 Pauline Ave | 0.63mi | 4/2.0 (+1) | 1,626 (-8%) | 10mo | $245,000 | $151 | 42 |
| 156 Forrest St | 0.59mi | 3/1.5 | 1,527 (-14%) | 13mo | $260,119 | $170 | 39 |
| 524 Tamarack St | 0.49mi | 4/1.5 (+1) | 1,525 (-14%) | 16mo | $290,000 | $190 | 36 |
Match score weights: distance 35% · size 25% · config 20% · recency 20%. Top-matched comps best support the ARV.
Projected returns pro-forma
-3.0% appreciation · 3.0% rent growth · sell at horizon
- IRR
- -16.0%
- Equity multiple
- 0.43×
- Total profit
- $-46,211
- Equity at exit
- $43,225
- IRR
- -7.7%
- Equity multiple
- 0.52×
- Total profit
- $-39,241
- Equity at exit
- $25,065
Cash invested: $81,172 (down + closing). Projections, not guarantees.
Landlord ↔ Tenant lean methodology
- Overall (STATE)
- 15 Strongly Tenant-Friendly
- State New York
- 15 Strongly Tenant-Friendly · D+10
- County
- — inherits STATE
- City
- — inherits STATE
ZIP-level market 13502
- Home prices YoY
- -12.1%
- Active inventory
- 150
- Price-to-rent
- 9.7×
Monthly cashflow live
- Estimated rent
- $2,484 medium interval (Pro) →
- Mortgage (P&I)
- −$1,520
- Tax from tax record
- −$309 /mo · $3,708/yr
- Insurance
- −$121
- HOA
- −$0
- Vacancy / Maint / Mgmt
- −$522
- Net cashflow
- $12
Break-even live
Sensitivity live
| Price | -10% $176 | -5% $94 | +0% $12 | +5% $-70 | +10% $-152 |
|---|---|---|---|---|---|
| Rent | -10% $-184 | -5% $-86 | +0% $12 | +5% $110 | +10% $208 |
| Rate | -1.0pp $158 | -0.5pp $86 | base $12 | +0.5pp $-63 | +1.0pp $-140 |
UW: 25.0% down · 7.5% · 30yr · 1.5% tax · 5.0% vac · 8.0% maint · 8.0% mgmt
Financing live
Cash to close
- Down payment
- $72,475
- Closing costs
- $8,697
- Reserves months
- —
- Total cash needed
- —
Loan-product check · same deal, 3 products live
Conventional
25% down · 7.5% · 30yr
- Down + closing
- —
- Monthly P&I
- —
- Monthly cashflow
- —
- DSCR
- —
- Eligible?
- —
Personal DTI + credit; lowest rate.
DSCR
20% down · 8.5% · 30yr
- Down + closing
- —
- Monthly P&I
- —
- Monthly cashflow
- —
- DSCR
- —
- Eligible?
- —
No personal income docs; deal must DSCR.
Hard money
10% down · 12.0% · 12mo
- Down + closing
- —
- Monthly P&I
- —
- Monthly cashflow
- —
- DSCR
- —
- Eligible?
- —
Short-term bridge; refi at stabilization.
Rent comps 2 comps
| Address | Beds | Baths | Sqft | Rent | $/sqft | DOM | Units | Dist |
|---|---|---|---|---|---|---|---|---|
| 1 Patriot Cir Utica, NY | 1.0–2.0 | 1.0–2.5 | 1451 | $3,115 | $2.15 | 45d | 6 | 0.55mi |
| Deerfield Utica, NY | 3.0 | 2.0 | 2000 | $3,600 | $1.80 | 45d | 1 | 0.91mi |
Listing history 8 events
-
2026-04-02status Pending
-
2026-03-28$289,900 Active
-
2018-04-06soldstatus $150,000
-
2018-04-05soldstatus $150,000 157-char remark
Show marketing remark (158 chars)
Wide open and delightful, this 3 bedroom split will surprise you with its open contemporary design, Volume ceilings, and fire placed family room. Great Spot!.
-
2018-04-05soldstatus $150,000 158-char remark
Show marketing remark (158 chars)
Wide open and delightful, this 3 bedroom split will surprise you with its open contemporary design, Volume ceilings, and fire placed family room. Great Spot!.
-
2018-01-18$159,000 157-char remark
Show marketing remark (157 chars)
Wide open and delightful, this 3 bedroom split will surprise you with its open contemporary design, Volume ceilings, and fire placed family room. Great Spot!
-
2018-01-17$154,900 158-char remark
Show marketing remark (158 chars)
Wide open and delightful, this 3 bedroom split will surprise you with its open contemporary design, Volume ceilings, and fire placed family room. Great Spot!.
-
1993-08-19soldstatus $99,000
ⓘ Source: listings_history table (triggers on properties + properties_extension) + one-shot
backfill from property_details.listing_events for pre-trigger history.
Tax reassessment forecast NY · Partial reset (capped growth)
- Current annual tax
- $3,708 · $309/mo
- Projected year-2 tax
- $4,303 · $359/mo
- Expected delta
- +$596/yr (+$50/mo · 16.1%)
ⓘ Screening estimate from a state-policy table — verify with the county assessor before closing.
Climate risk First Street
- Flood 1/10 Low FEMA zone X (unshaded) · 0% chance over 30 yrs
- Wildfire 1/10 Low
- Heat 3/10 Moderate 7 d/yr ≥96°F today · 16 d/yr by 30 yrs out
- Wind 2/10 Low 100% chance of damaging wind over 30 yrs
- Air quality 2/10 Low 0 unhealthy d/yr today · 1 by 30 yrs out
Nearby sold comps map
Loading sold comps map…
Walkable amenities ~0.75 mi
Loading nearby amenities…
Taxation est. · year 1
- Rental income
- $29,802
- − Mortgage interest
- −$16,239
- − Property taxes
- −$3,708
- − Insurance
- −$1,450
- − Repairs & maintenance
- −$2,384
- − Management
- −$2,384
- − Depreciation
- −$8,433
- Taxable loss
- −$4,796
- Est. tax savings @ 24.0%
- +$1,151
- After-tax cash flow
- $1,294/yr
For passive investors: Depreciation is non-cash, so a rental often shows a tax loss while cash-flowing — sheltering income. Rental losses are passive: they offset passive income freely, and up to $25,000/yr can offset ordinary (W-2) income if you actively participate and your MAGI is under $100k (phasing out to $0 by $150k); unused losses carry forward. On sale, claimed depreciation is recaptured at up to 25%, and gains may owe capital-gains tax (a 1031 exchange can defer both). Figures are a year-1 estimate at your 24.0% rate — not tax advice; consult a CPA.
Schools (NCES district)
- District
- Utica City School District
- NCES district ID
- 3629370
- Math proficiency
- 33% ▼ -7.00%
- Reading proficiency
- 38% ▲ 2.00%
- Median HH income
- $31,834
- Composite
- 29.01/100
- National rank
- #6613
- State rank
- #562 of 590 in NY
Livability — Utica
- Score
- 80/100
- State rank
- #104
- US rank
- #1589
Category grades
Schools grade is shown separately in the Schools card above.
Census & demographics
- Census place
- Utica, NY
- County
- Oneida County · 89,710 people
- City population
- 72,968
- Metro
- Utica-Rome, NY
- Population (ZIP)
- 34,037
- Household income
- $57,835
- Rent vs Own
- Severe rent burden
- 1604.0
Population outlook (Oneida County) Hauer SSP2
- Today (2025)
- 225,223 people
- By 2030
- 220,384 · -2.1%
- By 2040
- 209,071 · -7.2%
- By 2050
- 197,920 · -12.1%
- By 2075
- 175,541 · -22.1%
- By 2100
- 148,491 · -34.1%
Race, ethnicity, and origin ACS 2023
- Neighborhood character
- Predominantly White (71%)
- Race & ethnicity
- White 71% Hispanic / Latino 11% Black 9% Two or more races 7% Asian 5%
- Hispanic origin (detail)
- Mexican 2% Puerto Rican 5% Dominican 2%
- Common ancestry
- Romanian 11% Lithuanian 3% American 2%
- Foreign-born
- 12% · Canada, Philippines, China
- Languages at home
- 81% English-only · Spanish 7% Russian/Polish/Slavic 4% Other Asian/Pacific 3%
Political lean MEDSL · Oneida
- 2024 margin
- Strong R (+21.3) · D 39.4% · R 60.6%
- 2008→2024 swing
- -15.2pp toward R · 2008: -6.1pp · 2024: -21.3pp
- All cycles
- 2024: R+21.3 2020: R+15.5 2016: R+21.1 2012: R+5.3 2008: R+6.1
Not yet ingested
- Civics
- —
Market trends
- HPI YoY
- ▼ -50.76%
- Current HPI
- 368.3955
- Rent YoY
- —
- Metro
- Utica-Rome, NY
- State GDP YoY
- ▲ 2.60%
- F500 in state
- 92
Industry mix (Fortune 500 HQ in NY)
| Industry | F500 HQs | Revenue |
|---|---|---|
| Financial Services | 10 | $950B |
|
||
| Consumer Goods | 9 | $162B |
|
||
| Insurance | 4 | $225B |
|
||
| Telecommunications | 2 | $144B |
|
||
| Pharmaceuticals | 2 | $112B |
|
||
| Media / Entertainment | 2 | $69B |
|
||
Price history
+192.8% since first listed8 events — show timeline
- 2026-04-02 Pending — CNYIS
- 2026-03-28 Listed $289,900 CNYIS
- 2018-04-06 Sold (Public Records) $150,000 Public Records
- 2018-04-05 Sold (MLS) $150,000 CNYIS
- 2018-04-05 Sold (MLS) $150,000 CNYIS
- 2018-01-18 Listed $159,000 CNYIS
- 2018-01-17 Listed $154,900 CNYIS
- 1993-08-19 Sold (Public Records) $99,000 Public Records
Property tax history
+3.7%/yrLatest (2025): $3,708 · +6.5% YoY. Source: county tax records.
Cash-flow waterfall
monthlySold comps — $/sqft
last 12 mo · ≤1 miLoading sold comps…