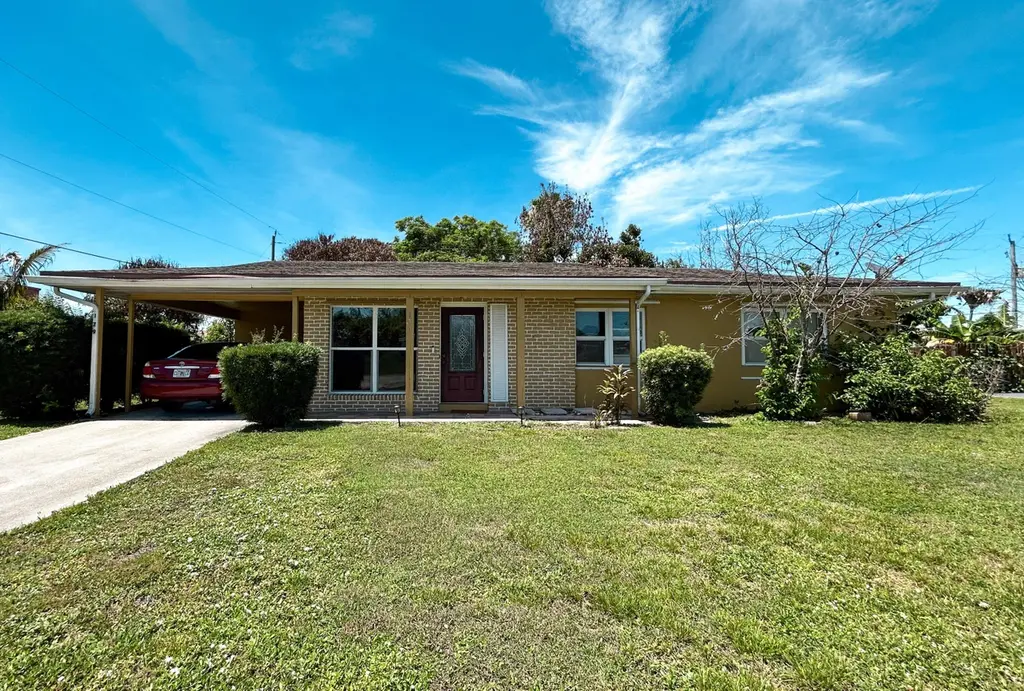
179 SE Soneto Ct · River Park, FL
Flood risk 1/10 · Minimal
- FEMA flood zone
- X (unshaded)
- Chance of flooding over 30 yrs
- 0.0%
- Est. flood insurance / yr
- $507 – $1,088
Fire risk 1/10 · Minimal
- Est. fire insurance / yr
- $947 – $1,759
Heat risk 10/10 · Severe
- Hot days now (above 106°F)
- 7 days/yr
- Hot days in 30 yrs
- 24 days/yr
Wind risk 10/10 · Severe
- Chance of severe wind over 30 yrs
- 99.0%
Air-quality risk 2/10 · Minimal
- Unhealthy air days now
- 1 days/yr
- Unhealthy air days in 30 yrs
- 1 days/yr
Risk factors via First Street. Map © Google.
Why this score? — see what drove the C+ grade
The composite is a weighted blend of 9 inputs, each scored 0–100. Each bar is that input's sub-score; the figure is the points it added to the 100-point composite (weight × sub-score).
- Cash flow +21.0/30.0
- ARV discount +15.0/15.0
- DSCR +6.7/10.0
- 1% rule +6.2/10.0
- Schools +3.7/10.0
- Livability +3.5/5.0
- Rent growth +2.9/5.0
- Condition / age +2.5/5.0
- Appreciation +0.0/10.0
$229,995
🖨 Deal sheet 📄 Offer letter ✓ Due diligence
Listing remarks MLS
CUTE AND CLEAN 3 BEDROOM 2 BATH HOME IN RIVER PARK; FAMILY ROOM, CARPET IN GREAT CONDITION; NICE YARD; AIR HANDLER NEW IN LAST 2 YRS; THIS IS A GREAT HOME FOR A FAMILY. EASY TO SHOW; ON SUPRA.
Key facts
- Florida room
- Outdoor living
- 0.24 acre lot
Tags
Property features AI
Finance
- Other: Building area reported as 1,969 (source: public records)
Exterior
- Parking: Attached carport (1 covered space); Driveway
- Utilities: Public water; Public sewer; Cable available; Electricity available
- Home design: Single-family residence; One story; Resale property; Faces south
- Construction: Stucco and concrete block (CBS) construction; Shingle roof
- Exterior features: Storage structure; City street frontage; Not waterfront
Interior
- Kitchen: Dishwasher; Electric range; Microwave; Refrigerator; Electric water heater
- Bedrooms: 3 bedrooms on the main level
- Flooring: Tile
- Bathrooms: 2 full bathrooms on the main level
- Heating & cooling: Wall/window cooling units
- Interior features: Bedroom layout is stacked; Partially furnished
- Laundry & utility: Laundry room on the main level with washer and electric dryer hookups (inside)
Neighborhood map
What this means for you Summary
Snapshot
- This is a 3-bed/1.5-bath single-family listed at $230k.
Deal economics
- At list price, monthly cash flow is $325 ($4k/yr) — positive.
- The deal already cash-flows at list — no discount required.
- Meets the 1% rule at list price ($3k rent vs $230k).
- Cap rate 8.0% vs local median 6.3% in River Park — meaningfully above typical; check what's discounted (condition, days-on-market, listing class) to confirm the premium yield is real.
Location & tenants
- Location reads 69/100 on livability (#451 in FL) — a middle-class / working-renter tenant base. Strengths: cost of living A+, housing A+, commute A-; Watch: schools F, amenities F, employment F.
- St. Lucie (urban): math 40% / reading 48% proficiency, ranked #51 of 73 in FL (top 70%) — families likely to look elsewhere, expect single-tenant / working-renter base with shorter leases.
- Market conditions: Rents rising (+1.5%/yr); 358 active listings in the ZIP; 37 comparable units currently listed for rent nearby; rentals at typical pace (median 23d on market — plan ~3-4 weeks tenant-placement turnaround); solid renter incomes; 4,868 units permitted in St. Lucie County in 2024 (268 in 5+ unit buildings).
- This rent runs 41% of the median local income ($75k/yr) — at the standard rent-burdened threshold; future hikes will face affordability resistance.
Forward outlook
- Local home prices are declining (-3.0%/yr); year-one equity from $2k of loan paydown is wiped out by about $7k of value loss. Plan a longer hold.
- St. Lucie County population projected at +20% by 2050 — long-run rental-demand tailwind backs the buy-and-hold thesis.
Negotiation context
- Only 7 days on market — expect competitive offers; lowballing is unlikely to land.
- 2 sale attempts since 27y ago with the ask held roughly flat each time — persistent listings suggest the price (not the market) is what's stuck; bring a comps-based counter.
- Current owner paid $62k; list at $230k implies a 268% gain — meaningful room to come down on a strong offer.
Risks & watch-outs
- Climate carrying-cost: severe wind risk, 99% chance of damaging wind over 30y; extreme-heat days projected 7→24/yr by 2055 (HVAC capex compounding) — expect insurance premiums to compound above CPI over the hold.
Questions for the listing agent
- Built in 1966 — when were the roof, HVAC, electrical panel, plumbing, and water heater last replaced?
- Is there a deadline driving the sale (1031 exchange, divorce, estate, relocation)? That informs how much negotiation room exists.
- Schools are F-rated, which usually means shorter tenancies and higher turnover. Who's the typical renter profile here, and what's been the actual vacancy rate?
- What's the average days-on-market for RENTAL listings here right now (not sales)? A rising rental-DOM trend means longer vacancies and softer asking-rent achievability than the comps imply.
- What's the recent tenant-quality profile in this submarket — average credit score on applications, eviction rate, late-payment / NSF rate, and stable-employment percentage? A property-management company in the area should have these aggregated.
- How much new for-sale + rental construction is in the pipeline within 1–3 miles? Heavy new supply typically softens prices + rents 12–24 months out; constrained supply supports both.
Investment metrics
- 1% rule
- 1.12% ✓
- Cap rate
- 7.99%
- Cash-on-cash
- 6.06%
- DSCR
- 1.27
- GRM
- 7.5
CMA / ARV
- ARV (on-the-fly)
- $302,574
- Comps found
- 12
Show comp detail 12 sales within ~0.75 mi
| Address | Dist | Beds/Ba | Sqft | Sold | Price | $/sf | Match |
|---|---|---|---|---|---|---|---|
| 100 SW Lakehurst Dr | 0.33mi | 3/2.0 | 1,442 (+1%) | 8mo | $290,000 | $201 | 75 |
| 109 SE Lucero Dr | 0.17mi | 3/2.0 | 1,256 (-12%) | 6mo | $265,000 | $211 | 64 |
| 1155 SW Hutchins St | 0.63mi | 3/2.0 | 1,408 (-2%) | 3mo | $380,000 | $270 | 63 |
| 162 SW Ewing Ave | 0.68mi | 3/2.0 | 1,494 (+4%) | 3mo | $250,000 | $167 | 57 |
| 236 SE Prima Vista Blvd SE | 0.53mi | 3/2.0 | 1,557 (+9%) | 4mo | $310,000 | $199 | 56 |
| 208 SE Verada Ave | 0.29mi | 3/2.0 | 1,648 (+15%) | 8mo | $325,000 | $197 | 53 |
| 385 SW Violet Ave | 0.65mi | 3/2.0 | 1,334 (-7%) | 11mo | $300,500 | $225 | 47 |
| 313 SE Husted Ter | 0.54mi | 3/2.0 | 1,608 (+12%) | 12mo | $365,000 | $227 | 42 |
| 175 SE Floresta Dr | 0.67mi | 3/2.0 | 1,257 (-12%) | 6mo | $260,000 | $207 | 41 |
| 159 NE Lobster Rd | 0.57mi | 4/3.0 (+1) | 1,602 (+12%) | 8mo | $275,000 | $172 | 36 |
| 1174 SW Hutchins St | 0.69mi | 3/3.0 | 1,248 (-13%) | 8mo | $335,000 | $268 | 33 |
| 543 SE Calmoso Dr | 0.70mi | 2/2.0 (-1) | 1,218 (-15%) | 4mo | $296,500 | $243 | 32 |
Match score weights: distance 35% · size 25% · config 20% · recency 20%. Top-matched comps best support the ARV.
Projected returns pro-forma
-3.0% appreciation · 1.53% rent growth · sell at horizon
- IRR
- -8.7%
- Equity multiple
- 0.69×
- Total profit
- $-20,180
- Equity at exit
- $34,293
- IRR
- -1.3%
- Equity multiple
- 0.92×
- Total profit
- $-5,360
- Equity at exit
- $19,886
Cash invested: $64,399 (down + closing). Projections, not guarantees.
Landlord ↔ Tenant lean methodology
- Overall (STATE)
- 87 Strongly Landlord-Friendly
- State Florida
- 87 Strongly Landlord-Friendly · R+3
- County
- — inherits STATE
- City
- — inherits STATE
ZIP-level market 34983
- Home prices YoY
- -33.9%
- Rents YoY
- 1.5%
- Active inventory
- 358
- Price-to-rent
- 7.5×
Monthly cashflow live
- Estimated rent
- $2,568 high interval (Pro) →
- Mortgage (P&I)
- −$1,206
- Tax from tax record
- −$401 /mo · $4,816/yr
- Insurance
- −$96
- HOA
- −$0
- Vacancy / Maint / Mgmt
- −$539
- Net cashflow
- $325
Break-even live
UW: 25.0% down · 7.5% · 30yr · 1.5% tax · 5.0% vac · 8.0% maint · 8.0% mgmt
Financing live
Cash to close
- Down payment
- $57,499
- Closing costs
- $6,900
- Reserves months
- —
- Total cash needed
- —
Loan-product check · same deal, 3 products live
Conventional
25% down · 7.5% · 30yr
- Down + closing
- —
- Monthly P&I
- —
- Monthly cashflow
- —
- DSCR
- —
- Eligible?
- —
Personal DTI + credit; lowest rate.
DSCR
20% down · 8.5% · 30yr
- Down + closing
- —
- Monthly P&I
- —
- Monthly cashflow
- —
- DSCR
- —
- Eligible?
- —
No personal income docs; deal must DSCR.
Hard money
10% down · 12.0% · 12mo
- Down + closing
- —
- Monthly P&I
- —
- Monthly cashflow
- —
- DSCR
- —
- Eligible?
- —
Short-term bridge; refi at stabilization.
Rent comps 37 comps
| Address | Beds | Baths | Sqft | Rent | $/sqft | DOM | Units | Dist |
|---|---|---|---|---|---|---|---|---|
| 151 SE Castana Ct Port Saint Lucie, FL | 3.0 | 2.0 | 1382 | $2,500 | $1.81 | 23d | 1 | 0.19mi |
| 107 SE Lucero Dr Port Saint Lucie, FL | 3.0 | 2.0 | 1326 | $2,150 | $1.62 | 21d | 1 | 0.19mi |
| 154 SE Selva Ct Port Saint Lucie, FL | 3.0 | 2.0 | 1503 | $3,000 | $2.00 | 23d | 1 | 0.21mi |
| 738 SW Ravenswood Ln Port St Lucie, FL | 2.0 | 2.0 | 894 | $2,100 | $2.35 | 21d | 1 | 0.26mi |
| 642 SW Bolin Ct Port Saint Lucie, FL | 3.0 | 2.0 | 1166 | $2,150 | $1.84 | 21d | 1 | 0.34mi |
| 116 Prima Vista Blvd Unit A Port St. Lucie, FL | 3.0 | 1.0 | 1314 | $2,600 | $1.98 | 23d | 1 | 0.37mi |
| 160 SE Duxbury Ave Port Saint Lucie, FL | 2.0 | 2.5 | 1521 | $2,700 | $1.78 | 23d | 1 | 0.40mi |
| 121 SE Juper Ave Port Saint Lucie, FL | 2.0 | 2.0 | 1450 | $2,500 | $1.72 | 23d | 1 | 0.48mi |
| 213 NE Prima Vista Blvd Port Saint Lucie, FL | 2.0 | 1.0 | 1012 | $2,000 | $1.98 | 23d | 1 | 0.51mi |
| 216 NE Mainsail St Port Saint Lucie, FL | 3.0 | 2.0 | 1516 | $2,550 | $1.68 | 21d | 1 | 0.70mi |
| 336 SE Tranquilla Ave Port Saint Lucie, FL | 3.0 | 3.0 | 1412 | $2,700 | $1.91 | 13d | 1 | 0.72mi |
| 160 NE Bracken Rd Port Saint Lucie, FL | 3.0 | 2.0 | 1166 | $2,200 | $1.89 | 21d | 1 | 0.74mi |
| 160 NE Bracken Rd Port Saint Lucie, FL | 3.0 | 2.0 | 1166 | $2,200 | $1.89 | 23d | 1 | 0.74mi |
| 351 SW Buswell Ave Port Saint Lucie, FL | 2.0 | 2.0 | 1234 | $2,200 | $1.78 | 13d | 1 | 0.75mi |
| 201 NE Midfield Ln Port Saint Lucie, FL | 2.0 | 2.0 | 1389 | $2,500 | $1.80 | 23d | 1 | 0.79mi |
| 456 SW Prado Ave Port Saint Lucie, FL | 3.0 | 2.0 | 1376 | $2,100 | $1.53 | 13d | 1 | 0.83mi |
| 1189 SW Broadview St Port Saint Lucie, FL | 2.0 | 2.0 | 988 | $2,200 | $2.23 | 13d | 1 | 0.88mi |
| 173 SE Fallon Dr Port Saint Lucie, FL | 3.0 | 2.0 | 1281 | $2,400 | $1.87 | 13d | 1 | 0.89mi |
| 400 NW Prima Vista Blvd Port St Lucie, FL | 2.0 | 2.0 | 1566 | $2,300 | $1.47 | 23d | 1 | 0.91mi |
| 632 SW Granadeer St Port Saint Lucie, FL | 3.0 | 2.0 | 1618 | $2,495 | $1.54 | 13d | 1 | 0.94mi |
| 1382 SE Sandia Dr Port Saint Lucie, FL | 2.0 | 1.0 | 945 | $1,000 | $1.06 | 23d | 1 | 0.95mi |
| 507 NW Billiar Ave Port St Lucie, FL | 3.0 | 2.0 | 1249 | $2,350 | $1.88 | 21d | 1 | 0.97mi |
| 532 SW Buswell Ave Port Saint Lucie, FL | 4.0 | 2.5 | 1629 | $2,750 | $1.69 | 23d | 1 | 1.00mi |
| 554 SW Lakehurst Dr Port Saint Lucie, FL | 3.0 | 2.0 | 1054 | $2,100 | $1.99 | 13d | 1 | 1.01mi |
| 1521 SE Ladner St Port Saint Lucie, FL | 4.0 | 2.0 | 1844 | $1,400 | $0.76 | 23d | 1 | 1.08mi |
| 326 SW Ray Ave Port Saint Lucie, FL | 3.0 | 2.0 | 1350 | $2,400 | $1.78 | 23d | 1 | 1.09mi |
| 326 SW Ray Ave Port Saint Lucie, FL | 3.0 | 2.0 | 1350 | $2,350 | $1.74 | 21d | 1 | 1.09mi |
| 730 SE White Ave Port Saint Lucie, FL | 2.0 | 2.0 | 1386 | $10,000 | $7.22 | 23d | 1 | 1.11mi |
| 385 NW Broadview St Port Saint Lucie, FL | 2.0 | 2.0 | 1500 | $2,300 | $1.53 | 23d | 1 | 1.12mi |
| 325 NW Ferris Dr Port Saint Lucie, FL | 2.0 | 2.0 | 1100 | $1,900 | $1.73 | 13d | 1 | 1.14mi |
| 650 SE Evergreen Ter Port Saint Lucie, FL | 2.0 | 2.0 | 974 | $2,095 | $2.15 | 13d | 1 | 1.15mi |
| 149 SW Fairview Ave Port Saint Lucie, FL | 3.0 | 2.0 | 1574 | $2,550 | $1.62 | 23d | 1 | 1.16mi |
| 365 NW Hibiscus St Port Saint Lucie, FL | 4.0 | 2.0 | 1714 | $4,000 | $2.33 | 23d | 1 | 1.20mi |
| 385 SW Fairway Ave Port Saint Lucie, FL | 3.0 | 2.0 | 1440 | $2,800 | $1.94 | 23d | 1 | 1.25mi |
| 805 SE Cavern Ave Port Saint Lucie, FL | 3.0 | 2.0 | 1732 | $2,500 | $1.44 | 23d | 1 | 1.28mi |
| 562 SE Walters Ter Port Saint Lucie, FL | 3.0 | 2.0 | 1833 | $2,700 | $1.47 | 13d | 1 | 1.36mi |
| 134 NW Peach St Port Saint Lucie, FL | 3.0 | 2.0 | 1862 | $2,050 | $1.10 | 13d | 1 | 1.45mi |
Listing history 7 events
-
2026-06-18days on market $229,995 Active 7 DOM
-
2026-06-17days on market $229,995 Active 6 DOM
-
2026-06-16pricedays on market $229,995 Active 5 DOM
-
2026-06-15days on market $239,995 Active 4 DOM
-
2026-06-14days on market $239,995 Active 2 DOM
-
2026-06-13remarks 649-char remark
-
2026-06-13$239,995 Active 1 DOM
ⓘ Source: listings_history table (triggers on properties + properties_extension) + one-shot
backfill from property_details.listing_events for pre-trigger history.
Tax reassessment forecast FL · Resets to sale price
- Current annual tax
- $4,816 · $401/mo
- Projected year-2 tax
- $4,816 · $401/mo
- Expected delta
- $0/yr ($0/mo · 0.0%)
ⓘ Screening estimate from a state-policy table — verify with the county assessor before closing.
Climate risk First Street
- Flood 1/10 Low FEMA zone X (unshaded) · 0% chance over 30 yrs
- Wildfire 1/10 Low
- Heat 10/10 Extreme 7 d/yr ≥106°F today · 24 d/yr by 30 yrs out
- Wind 10/10 Extreme 99% chance of damaging wind over 30 yrs
- Air quality 2/10 Low 1 unhealthy d/yr today · 1 by 30 yrs out
Nearby sold comps map
Loading sold comps map…
Walkable amenities ~0.75 mi
Loading nearby amenities…
Taxation est. · year 1
- Rental income
- $30,815
- − Mortgage interest
- −$12,883
- − Property taxes
- −$4,816
- − Insurance
- −$1,150
- − Repairs & maintenance
- −$2,465
- − Management
- −$2,465
- − Depreciation
- −$6,691
- Taxable income
- $345
- Est. tax owed @ 24.0%
- −$83
- After-tax cash flow
- $3,822/yr
For passive investors: Depreciation is non-cash, so a rental often shows a tax loss while cash-flowing — sheltering income. Rental losses are passive: they offset passive income freely, and up to $25,000/yr can offset ordinary (W-2) income if you actively participate and your MAGI is under $100k (phasing out to $0 by $150k); unused losses carry forward. On sale, claimed depreciation is recaptured at up to 25%, and gains may owe capital-gains tax (a 1031 exchange can defer both). Figures are a year-1 estimate at your 24.0% rate — not tax advice; consult a CPA.
Schools (NCES district)
- District
- St. Lucie
- NCES district ID
- 1201770
- Math proficiency
- 40% ▼ -11.00%
- Reading proficiency
- 48% ▼ -4.00%
- Median HH income
- $44,737
- Composite
- 37.28/100
- National rank
- #4449
- State rank
- #51 of 73 in FL
Livability — River Park
- Score
- 69/100
- State rank
- #451
- US rank
- #8159
Category grades
Schools grade is shown separately in the Schools card above.
Census & demographics
- Census place
- River Park, FL
- County
- Saint Lucie County · 337,150 people
- Metro
- Port St. Lucie, FL
- Population (ZIP)
- 49,001
- Household income
- $75,489
- Rent vs Own
- Severe rent burden
- 843.0
Population outlook (St. Lucie County) Hauer SSP2
- Today (2025)
- 338,016 people
- By 2030
- 355,687 · +5.2%
- By 2040
- 385,521 · +14.1%
- By 2050
- 406,106 · +20.1%
- By 2075
- 441,054 · +30.5%
- By 2100
- 436,885 · +29.2%
Race, ethnicity, and origin ACS 2023
- Neighborhood character
- Diverse neighborhood (Simpson 0.65)
- Race & ethnicity
- White 51% Hispanic / Latino 23% Black 18% Two or more races 13% Asian 3%
- Hispanic origin (detail)
- Mexican 3% Puerto Rican 9% Cuban 3%
- Common ancestry
- Hispanic 3% Romanian 2% Italian 1%
- Foreign-born
- 19% · Canada, Guatemala, Jamaica
- Languages at home
- 74% English-only · Spanish 15% French/Haitian/Cajun 4% Other Indo-European 2%
Political lean MEDSL · St. Lucie
- 2024 margin
- Lean R (+9.1) · D 45.1% · R 54.2%
- 2008→2024 swing
- -21.2pp toward R · 2008: 12.1pp · 2024: -9.1pp
- All cycles
- 2024: R+9.1 2020: R+1.6 2016: R+2.5 2012: D+7.9 2008: D+12.1
Not yet ingested
- Civics
- —
Market trends
- HPI YoY
- ▼ -209.28%
- Current HPI
- 407.6341
- Rent YoY
- ▲ 1.53%
- Metro
- Port St. Lucie, FL
- State GDP YoY
- ▲ 3.28%
- F500 in state
- 36
Industry mix (Fortune 500 HQ in FL)
| Industry | F500 HQs | Revenue |
|---|---|---|
| Industrial Technology | 2 | $29B |
|
||
| Insurance | 2 | $17B |
|
||
| Retail | 1 | $60B |
|
||
| Technology Distribution | 1 | $58B |
|
||
| Homebuilding | 1 | $35B |
|
||
| Technology Manufacturing | 1 | $35B |
|
||
Price history
+381.0% since first listed6 events — show timeline
- 2026-06-10 Listed $239,995 Beaches MLS
- 1999-08-12 Sold (Public Records) $62,500 Public Records
- 1999-08-06 Sold (MLS) $62,500 Beaches MLS
- 1999-06-16 Listing Removed — Beaches MLS
- 1999-04-02 Listed $62,500 Beaches MLS
- 1981-05-01 Sold (Public Records) $49,900 Public Records
Property tax history
+21.1%/yrLatest (2025): $4,816 · +446.8% YoY. Source: county tax records.
Cash-flow waterfall
monthlySold comps — $/sqft
last 12 mo · ≤1 miLoading sold comps…