 Duplex
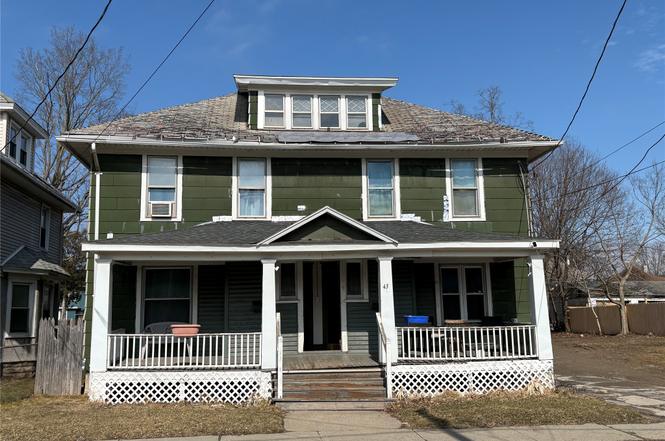
43 Bevier St St · Binghamton, NY
Flood risk 4/10 · Minor
- FEMA flood zone
- X
- Chance of flooding over 30 yrs
- 0.21%
- Est. flood insurance / yr
- $473 – $860
Fire risk 1/10 · Minimal
- Est. fire insurance / yr
- $691 – $1,283
Heat risk 3/10 · Minor
- Hot days now (above 94°F)
- 7 days/yr
- Hot days in 30 yrs
- 16 days/yr
Wind risk 2/10 · Minimal
- Chance of severe wind over 30 yrs
- 2.0%
Air-quality risk 2/10 · Minimal
- Unhealthy air days now
- 0 days/yr
- Unhealthy air days in 30 yrs
- 1 days/yr
Risk factors via First Street. Map © Google.
Why this score? — see what drove the B+ grade
The composite is a weighted blend of 9 inputs, each scored 0–100. Each bar is that input's sub-score; the figure is the points it added to the 100-point composite (weight × sub-score).
- Cash flow +30.0/30.0
- ARV discount +15.0/15.0
- 1% rule +10.0/10.0
- DSCR +10.0/10.0
- Livability +3.9/5.0
- Schools +3.0/10.0
- Rent growth +2.5/5.0
- Condition / age +2.5/5.0
- Appreciation +0.0/10.0
$80,000
🖨 Deal sheet 📄 Offer letter ✓ Due diligence
Multi-family units
County records classify this as Multi-Family (2-4 Unit). Listing-text estimate: 2 units. confirmed
Listing remarks
This large duplex in Binghamton’s District offers two spacious three-bedroom units, each close to schools, shopping, and everyday amenities. Unit 1L features newly updated living room and dining room flooring, while the property as a whole includes a full walk-up attic and a full basement, providing abundant storage options. Long-term tenants are already in place, adding stability for an investor or owner-occupant. A rare four-car garage enhances the value and functionality of the home. The property does need some TLC, but it presents a strong opportunity for anyone looking to build equity.
Key facts
- Four-car garage
- Full basement
- Full walk-up attic
Tags
Property features AI
Finance
- Other: Zoning: 2-family residential
- Financial info: Each unit rents for $700 (two units); Total rent per unit listed as $700
- HOA & community: No HOA information provided
Exterior
- Parking: Attached garage with 4 garage spaces; Additional parking details: Other / See remarks
- Security: No security details provided
- Utilities: Public water; Public sewer
- Home design: Duplex (residential income property); Level lot
- Construction: Vinyl siding; Asphalt construction material
- Exterior features: Covered porch
Interior
- Kitchen: No specific kitchen appliance list provided
- Bedrooms: Two 3-bedroom units (each unit has 3 bedrooms)
- Flooring: Hardwood flooring; Vinyl flooring
- Bathrooms: Two 1-bath units (each unit has 1 full bathroom); Additional: 2 full bathrooms building total
- Heating & cooling: Forced air heating; No cooling
- Interior features: Gas water heater
- Laundry & utility: No laundry details provided
Neighborhood map
What this means for you Summary
Snapshot
- This is a 2 × 3-bed/1.0-bath units multifamily listed at $80k.
Deal economics
- At list price, monthly cash flow is $2k ($21k/yr) — positive. Per door: $880/mo.
- The deal already cash-flows at list — no discount required.
- Meets the 1% rule at list price ($3k rent vs $80k).
- Recommended offer: $78k (3.0% below list) — sets the bar for market timing.
- Cap rate 32.7% vs local median 6.4% in Binghamton — top-decile yield for the area; either an underpriced asset or a hidden risk that comps aren't pricing in. Stress-test before assuming the spread holds.
Location & tenants
- Location reads 78/100 on livability (#174 in NY, #2,710 nationally) — a middle-class / working-renter tenant base. Strengths: amenities A+, commute A+, cost of living A+; Watch: crime F, employment F.
- Binghamton City School District (urban): math 30% / reading 44% proficiency, ranked #557 of 590 in NY (top 94%) — families likely to look elsewhere, expect single-tenant / working-renter base with shorter leases; 61% free/reduced lunch — lower-income household profile, screen leases tightly.
- Zoned schools: Theodore Roosevelt School (math 27% / reading 37%, grade F, #1,646 of 2,108 statewide, top 80%, 345 students, 74% FRL).
- Market conditions: 92 active listings in the ZIP; 1 comparable units currently listed for rent nearby; 340 units permitted in Broome County in 2024 (269 in 5+ unit buildings).
- At $2,927/mo this rent would consume 63% of the median local household income ($56k/yr) (locally 1230% of renters already pay >50% of income on rent) — very limited rent-growth headroom before tenants either downsize or default.
Forward outlook
- Local home prices are declining (-3.0%/yr); year-one equity from $553 of loan paydown is wiped out by about $2k of value loss. Plan a longer hold.
- Broome County population projected at -13% by 2050 — secular population decline; favor cash flow + early exit over multi-decade hold.
- At projected returns (-3.0% appreciation + 3.0% rent growth), your $22k cash investment doubles in ~2 years — after that, you're playing with house money.
Negotiation context
- It's been on market 52 days — a 3% lower offer ($78k) is reasonable based on typical stale-listing flexibility.
- 2 sale attempts since 8y ago; this cycle's ask has dropped $5k (6%) from the opening price — seller is motivated, your offer sets the floor, not the list.
- Current owner paid $60k; 33% above their basis — modest negotiation headroom, anchor on the comps not their cost.
Risks & watch-outs
- Watch-outs: built in 1928 — expect roof / HVAC / electrical / plumbing capex.
Questions for the listing agent
- It's been on market 52 days. Have you received any prior offers? Is the seller open to a 3% concession, seller financing, or rate buy-down credit?
- Can we see the unit-by-unit rent roll, current vacancy, and any below-market leases? What's the average tenancy length?
- What capital expenditures (roof, boiler, parking lot, exteriors) have been made in the last 5 years, and what's planned in the next 2?
- Built in 1928 — when were the roof, HVAC, electrical panel, plumbing, and water heater last replaced?
- Is there a deadline driving the sale (1031 exchange, divorce, estate, relocation)? That informs how much negotiation room exists.
- Schools are D-rated, which usually means shorter tenancies and higher turnover. Who's the typical renter profile here, and what's been the actual vacancy rate?
- Crime grade is F in this area — have there been break-ins, vandalism, or insurance claims at this property in the last 3 years? What carrier currently insures it and at what premium?
- What's the average days-on-market for RENTAL listings here right now (not sales)? A rising rental-DOM trend means longer vacancies and softer asking-rent achievability than the comps imply.
- What's the recent tenant-quality profile in this submarket — average credit score on applications, eviction rate, late-payment / NSF rate, and stable-employment percentage? A property-management company in the area should have these aggregated.
- How much new apartment / multifamily construction is in the pipeline within 1–3 miles? Heavy new supply (>2% of stock underway) typically softens rents 12–24 months out; light construction supports rent growth.
Investment metrics
- 1% rule
- 3.66% ✓
- Cap rate
- 32.68%
- Cash-on-cash
- 94.26%
- DSCR
- 5.19
- GRM
- 2.3
CMA / ARV
- ARV (on-the-fly)
- $155,904
- Comps found
- 11
Show comp detail 11 sales within ~0.75 mi
| Address | Dist | Beds/Ba | Sqft | Sold | Price | $/sf | Match |
|---|---|---|---|---|---|---|---|
| 43 Bevier St St | 0.00mi | 6/2.0 | 2,688 (0%) | 1mo | $71,000 | $26 | 99 |
| 528 Chenango St | 0.18mi | 6/2.0 | 2,488 (-7%) | 2mo | $140,000 | $56 | 78 |
| 32 Linden St | 0.10mi | 6/2.0 | 2,586 (-4%) | 13mo | $155,000 | $60 | 78 |
| 8 Roosevelt Ave | 0.28mi | 6/2.0 | 2,833 (+5%) | 8mo | $136,000 | $48 | 71 |
| 41 Roosevelt Ave | 0.46mi | 6/2.5 | 2,736 (+2%) | 8mo | $76,000 | $28 | 66 |
| 507 Chenango St | 0.27mi | 5/3.0 (-1) | 2,740 (+2%) | 11mo | $131,000 | $48 | 66 |
| 23 Linden St | 0.11mi | 5/3.0 (-1) | 2,304 (-14%) | 9mo | $215,000 | $93 | 54 |
| 675 Chenango St | 0.66mi | 6/2.5 | 2,552 (-5%) | 8mo | $188,000 | $74 | 52 |
| 17 Deforest St | 0.34mi | 5/3.0 (-1) | 2,600 (-3%) | 22mo | $170,000 | $65 | 51 |
| 54 & 56 Griswold St | 0.72mi | 6/2.0 | 3,048 (+13%) | 3mo | $216,000 | $71 | 42 |
| 639 Chenango St | 0.50mi | 5/3.0 (-1) | 2,398 (-11%) | 16mo | $140,000 | $58 | 36 |
Match score weights: distance 35% · size 25% · config 20% · recency 20%. Top-matched comps best support the ARV.
Projected returns pro-forma
-3.0% appreciation · 3.0% rent growth · sell at horizon
- IRR
- 95.1%
- Equity multiple
- 5.43×
- Total profit
- $99,142
- Equity at exit
- $11,928
- IRR
- 97.9%
- Equity multiple
- 11.30×
- Total profit
- $230,808
- Equity at exit
- $6,917
Cash invested: $22,400 (down + closing). Projections, not guarantees.
Landlord ↔ Tenant lean methodology
- Overall (STATE)
- 15 Strongly Tenant-Friendly
- State New York
- 15 Strongly Tenant-Friendly · D+10
- County
- — inherits STATE
- City
- — inherits STATE
ZIP-level market 13901
- Home prices YoY
- -5.1%
- Active inventory
- 92
- Price-to-rent
- 4.6×
Monthly cashflow live
- Estimated rent
- $2,927 high interval (Pro) →
- Mortgage (P&I)
- −$420
- Tax est. 1.5%
- −$100 /mo · $1,200/yr
- Insurance
- −$33
- HOA
- −$0
- Vacancy / Maint / Mgmt
- −$615
- Net cashflow
- $1,759
Break-even live
2-unit breakdown (identical units grouped — click to expand)
| Units | Beds | Baths | Est. rent |
|---|---|---|---|
| 2× units | 3 | 1 | $2,926 |
| #1 | 3 | 1 | $1,463 |
| #2 | 3 | 1 | $1,463 |
| Total (2 units) | $2,927 | ||
UW: 25.0% down · 7.5% · 30yr · 1.5% tax · 5.0% vac · 8.0% maint · 8.0% mgmt
Financing live
Cash to close
- Down payment
- $20,000
- Closing costs
- $2,400
- Reserves months
- —
- Total cash needed
- —
Loan-product check · same deal, 3 products live
Conventional
25% down · 7.5% · 30yr
- Down + closing
- —
- Monthly P&I
- —
- Monthly cashflow
- —
- DSCR
- —
- Eligible?
- —
Personal DTI + credit; lowest rate.
DSCR
20% down · 8.5% · 30yr
- Down + closing
- —
- Monthly P&I
- —
- Monthly cashflow
- —
- DSCR
- —
- Eligible?
- —
No personal income docs; deal must DSCR.
Hard money
10% down · 12.0% · 12mo
- Down + closing
- —
- Monthly P&I
- —
- Monthly cashflow
- —
- DSCR
- —
- Eligible?
- —
Short-term bridge; refi at stabilization.
Rent comps 1 comps
| Address | Beds | Baths | Sqft | Rent | $/sqft | DOM | Units | Dist |
|---|---|---|---|---|---|---|---|---|
| 607 Chenango St Binghamton, NY | 5.0 | 2.5 | 2500 | $2,800 | $1.12 | 13d | 1 | 0.39mi |
Listing history 6 events
-
2026-05-01status Pending
-
2026-04-09historical Active Under Contract
-
2026-03-16price $80,000
-
2026-03-10$85,000 Active
-
2018-08-01$68,000
-
2006-03-17soldstatus $60,087
ⓘ Source: listings_history table (triggers on properties + properties_extension) + one-shot
backfill from property_details.listing_events for pre-trigger history.
Climate risk First Street
- Flood 4/10 Moderate FEMA zone X · 21% chance over 30 yrs
- Wildfire 1/10 Low
- Heat 3/10 Moderate 7 d/yr ≥94°F today · 16 d/yr by 30 yrs out
- Wind 2/10 Low 2% chance of damaging wind over 30 yrs
- Air quality 2/10 Low 0 unhealthy d/yr today · 1 by 30 yrs out
Nearby sold comps map
Loading sold comps map…
Walkable amenities ~0.75 mi
Loading nearby amenities…
Taxation est. · year 1
- Rental income
- $35,124
- − Mortgage interest
- −$4,481
- − Property taxes
- −$1,200
- − Insurance
- −$400
- − Repairs & maintenance
- −$2,810
- − Management
- −$2,810
- − Depreciation
- −$2,327
- Taxable income
- $21,096
- Est. tax owed @ 24.0%
- −$5,063
- After-tax cash flow
- $16,051/yr
For passive investors: Depreciation is non-cash, so a rental often shows a tax loss while cash-flowing — sheltering income. Rental losses are passive: they offset passive income freely, and up to $25,000/yr can offset ordinary (W-2) income if you actively participate and your MAGI is under $100k (phasing out to $0 by $150k); unused losses carry forward. On sale, claimed depreciation is recaptured at up to 25%, and gains may owe capital-gains tax (a 1031 exchange can defer both). Figures are a year-1 estimate at your 24.0% rate — not tax advice; consult a CPA.
Schools (NCES district)
- District
- Binghamton City School District
- NCES district ID
- 3604870
- Math proficiency
- 30% ▬ 0.00%
- Reading proficiency
- 44% ▲ 15.00%
- Median HH income
- $30,475
- Composite
- 30.09/100
- National rank
- #6342
- State rank
- #557 of 590 in NY
Livability — Binghamton
- Score
- 78/100
- State rank
- #174
- US rank
- #2710
Category grades
Schools grade is shown separately in the Schools card above.
Census & demographics
- Census place
- Binghamton, NY
- County
- Broome County · 126,805 people
- City population
- 65,170
- Metro
- Binghamton, NY
- Population (ZIP)
- 19,613
- Household income
- $55,523
- Rent vs Own
- Severe rent burden
- 1230.0
Population outlook (Broome County) Hauer SSP2
- Today (2025)
- 187,989 people
- By 2030
- 183,066 · -2.6%
- By 2040
- 172,228 · -8.4%
- By 2050
- 163,161 · -13.2%
- By 2075
- 153,641 · -18.3%
- By 2100
- 140,851 · -25.1%
Race, ethnicity, and origin ACS 2023
- Neighborhood character
- Predominantly White (80%)
- Race & ethnicity
- White 80% Two or more races 7% Hispanic / Latino 7% Black 5% Asian 2%
- Hispanic origin (detail)
- Puerto Rican 3%
- Common ancestry
- Romanian 6% Lithuanian 1% Italian 1%
- Foreign-born
- 5% · Canada, Jamaica
- Languages at home
- 93% English-only · Spanish 3% Russian/Polish/Slavic 1% Other Indo-European 1%
Political lean MEDSL · Broome
- 2024 margin
- Toss-up / Even · D 50.2% · R 49.8%
- 2008→2024 swing
- -7.6pp toward R · 2008: 8.0pp · 2024: 0.4pp
- All cycles
- 2024: D+0.4 2020: D+3.5 2016: R+3.7 2012: D+4.6 2008: D+8.0
Not yet ingested
- Civics
- —
Market trends
- HPI YoY
- ▼ -16.13%
- Current HPI
- 300.7692
- Rent YoY
- —
- Metro
- Binghamton, NY
- State GDP YoY
- ▲ 2.60%
- F500 in state
- 92
Industry mix (Fortune 500 HQ in NY)
| Industry | F500 HQs | Revenue |
|---|---|---|
| Financial Services | 10 | $950B |
|
||
| Consumer Goods | 9 | $162B |
|
||
| Insurance | 4 | $225B |
|
||
| Telecommunications | 2 | $144B |
|
||
| Pharmaceuticals | 2 | $112B |
|
||
| Media / Entertainment | 2 | $69B |
|
||
Price history
+33.1% since first listed6 events — show timeline
- 2026-05-01 Pending — GBAOR
- 2026-04-09 Contingent — GBAOR
- 2026-03-16 Price Changed $80,000 GBAOR
- 2026-03-10 Listed $85,000 GBAOR
- 2018-08-01 Listed $68,000 GBAOR
- 2006-03-17 Sold (Public Records) $60,087 Public Records
Property tax history
+4.7%/yrLatest (2025): $4,971 · +0.9% YoY. Source: county tax records.
Cash-flow waterfall
monthlySold comps — $/sqft
last 12 mo · ≤1 miLoading sold comps…