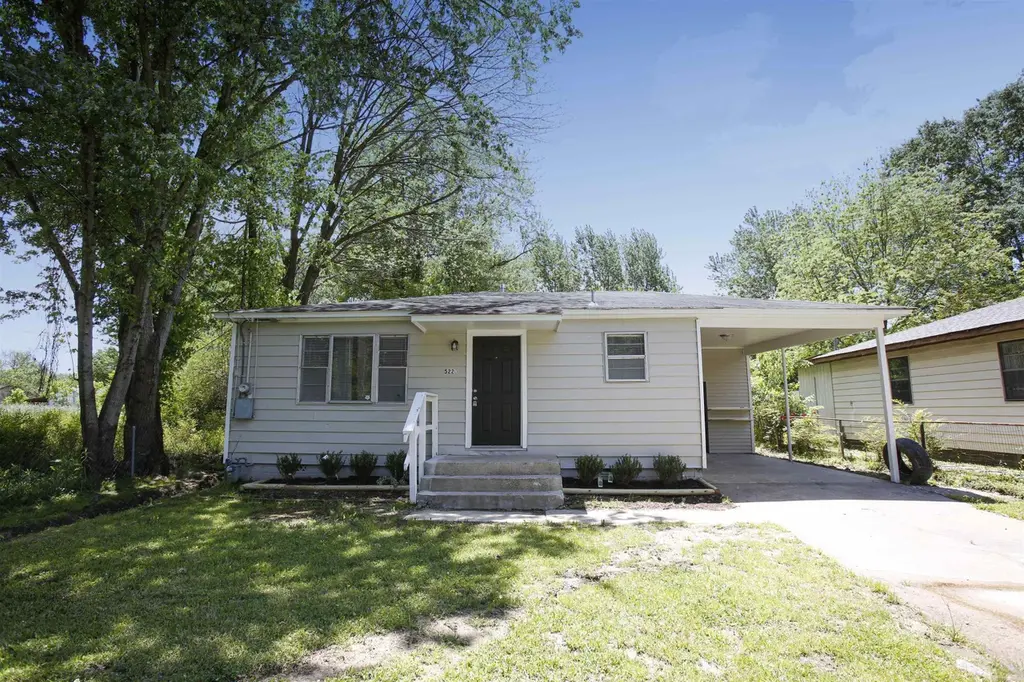
5220 Buford Rd · McAlmont, AR
Flood risk 1/10 · Minimal
- FEMA flood zone
- X (unshaded)
- Chance of flooding over 30 yrs
- 0.0%
- Est. flood insurance / yr
- $507 – $1,088
Fire risk 2/10 · Minimal
- Est. fire insurance / yr
- $1,499 – $2,785
Heat risk 7/10 · Major
- Hot days now (above 110°F)
- 7 days/yr
- Hot days in 30 yrs
- 19 days/yr
Wind risk 4/10 · Minor
- Chance of severe wind over 30 yrs
- 9.0%
Air-quality risk 2/10 · Minimal
- Unhealthy air days now
- 2 days/yr
- Unhealthy air days in 30 yrs
- 2 days/yr
Risk factors via First Street. Map © Google.
Why this score? — see what drove the C grade
The composite is a weighted blend of 9 inputs, each scored 0–100. Each bar is that input's sub-score; the figure is the points it added to the 100-point composite (weight × sub-score).
- Cash flow +24.8/30.0
- DSCR +8.1/10.0
- 1% rule +6.0/10.0
- ARV discount +5.6/15.0
- Livability +3.1/5.0
- Schools +2.6/10.0
- Rent growth +2.5/5.0
- Condition / age +2.5/5.0
- Appreciation +0.0/10.0
$110,000
🖨 Deal sheet (PDF) 📄 Offer letter ✓ Due diligence
Listing remarks MLS
Check out this 3 bedroom house that is waiting for you to call it home. Kitchen has new granite countertops and plenty of shelving and storage space. Separate dining area. Large, fenced yard with back patio area that is perfect for enjoying the outdoors. Tenant occupied, 24-hour notice. Lease in place. Monday-Friday showings only. Any offer needs to have the following verbiage included "buyer is aware there is a lease in place and agree to the lease terms".
Key facts
- Fenced yard
- Detached
- Back patio
Tags
Neighborhood map
What this means for you Summary
Snapshot
- This is a 3-bed/1.0-bath single-family listed at $110k.
Deal economics
- At list price, monthly cash flow is $234 ($3k/yr) — positive.
- The deal already cash-flows at list — no discount required.
- Meets the 1% rule at list price ($1k rent vs $110k).
- Recommended offer: $103k (6.0% below list) — sets the bar for market timing.
Location & tenants
- Location reads 62/100 on livability (#224 in AR) — a middle-class / working-renter tenant base. Strengths: cost of living A+, crime A-, housing A-; Watch: amenities F, commute F, employment F.
- Pulaski County Spec. School District (rural): math 27% / reading 31% proficiency, ranked #150 of 238 in AR (top 63%) — low school quality limits family demand, transient renter base, plan for 1-2y turnover.
- Zoned schools: Harris Elementary School (math 12% / reading 8%, grade F, #429 of 454 statewide, top 96%, 199 students, 97% FRL); Sylvan Hills Middle School (math 26% / reading 30%, grade F, #150 of 201 statewide, top 76%, 1,122 students, 52% FRL); Sylvan Hills High School (math 16% / reading 29%, grade F, #211 of 292 statewide, top 73%, 1,017 students, 38% FRL).
- Market conditions: 83 active listings in the ZIP; 5 comparable units currently listed for rent nearby; rentals at typical pace (median 16d on market — plan ~3-4 weeks tenant-placement turnaround); 1,006 units permitted in Pulaski County in 2024 (0 in 5+ unit buildings).
Forward outlook
- Local home prices are declining (-3.0%/yr); year-one equity from $761 of loan paydown is wiped out by about $3k of value loss. Plan a longer hold.
- Pulaski County population projected at +6% by 2050 — modest demand growth; plan on rents tracking national, not racing it.
Negotiation context
- It's been on market 88 days — a 6% lower offer ($103k) is reasonable based on typical stale-listing flexibility.
- 4 sale attempts since 4y ago with the ask held roughly flat each time — persistent listings suggest the price (not the market) is what's stuck; bring a comps-based counter.
Risks & watch-outs
- Watch-outs: built in 1935 — expect roof / HVAC / electrical / plumbing capex.
- Climate carrying-cost: extreme-heat days projected 7→19/yr by 2055 (HVAC capex compounding) — expect insurance premiums to compound above CPI over the hold.
Questions for the listing agent
- It's been on market 88 days. Have you received any prior offers? Is the seller open to a 6% concession, seller financing, or rate buy-down credit?
- Built in 1935 — when were the roof, HVAC, electrical panel, plumbing, and water heater last replaced?
- Why hasn't it sold? Are there any deal-killer items the seller is aware of (foundation, flood, title, zoning, code violations)?
- Is there a deadline driving the sale (1031 exchange, divorce, estate, relocation)? That informs how much negotiation room exists.
- Schools are F-rated, which usually means shorter tenancies and higher turnover. Who's the typical renter profile here, and what's been the actual vacancy rate?
- What's the average days-on-market for RENTAL listings here right now (not sales)? A rising rental-DOM trend means longer vacancies and softer asking-rent achievability than the comps imply.
- What's the recent tenant-quality profile in this submarket — average credit score on applications, eviction rate, late-payment / NSF rate, and stable-employment percentage? A property-management company in the area should have these aggregated.
- How much new for-sale + rental construction is in the pipeline within 1–3 miles? Heavy new supply typically softens prices + rents 12–24 months out; constrained supply supports both.
Investment metrics
- 1% rule
- 1.10% ✓
- Cap rate
- 8.85%
- Cash-on-cash
- 9.11%
- DSCR
- 1.41
- GRM
- 7.6
CMA / ARV
- ARV (median comp)
- $105,559
- List price
- $110,000
- Delta
- 4.21%
- Verdict
- FAIR
- Comps
- 10 within 1.0 mi
Show comp detail 1 sale within ~0.75 mi
| Address | Dist | Beds/Ba | Sqft | Sold | Price | $/sf | Match |
|---|---|---|---|---|---|---|---|
| 508 Wallace Rd | 0.68mi | 3/2.0 | 1,209 (+9%) | 21mo | $45,000 | $37 | 32 |
Match score weights: distance 35% · size 25% · config 20% · recency 20%. Top-matched comps best support the ARV.
Projected returns pro-forma
-3.0% appreciation · 3.0% rent growth · sell at horizon
- IRR
- -2.5%
- Equity multiple
- 0.90×
- Total profit
- $-2,928
- Equity at exit
- $16,401
- IRR
- 7.2%
- Equity multiple
- 1.54×
- Total profit
- $16,623
- Equity at exit
- $9,511
Cash invested: $30,800 (down + closing). Projections, not guarantees.
Landlord ↔ Tenant lean methodology
- Overall (STATE)
- 92 Strongly Landlord-Friendly
- State Arkansas
- 92 Strongly Landlord-Friendly · R+14
- County
- — inherits STATE
- City
- — inherits STATE
ZIP-level market 72117
- Home prices YoY
- -30.4%
- Active inventory
- 83
- Price-to-rent
- 7.6×
Monthly cashflow live
- Estimated rent
- $1,214 high interval (Pro) →
- Mortgage (P&I)
- −$577
- Tax from tax record
- −$102 /mo · $1,226/yr
- Insurance
- −$46
- HOA
- −$0
- Vacancy / Maint / Mgmt
- −$255
- Net cashflow
- $234
Break-even live
Sensitivity live
| Price | -10% $296 | -5% $265 | +0% $234 | +5% $203 | +10% $172 |
|---|---|---|---|---|---|
| Rent | -10% $138 | -5% $186 | +0% $234 | +5% $282 | +10% $330 |
| Rate | -1.0pp $289 | -0.5pp $262 | base $234 | +0.5pp $205 | +1.0pp $176 |
UW: 25.0% down · 7.5% · 30yr · 1.5% tax · 5.0% vac · 8.0% maint · 8.0% mgmt
Financing live
Cash to close
- Down payment
- $27,500
- Closing costs
- $3,300
- Reserves months
- —
- Total cash needed
- —
Loan-product check · same deal, 3 products live
Conventional
25% down · 7.5% · 30yr
- Down + closing
- —
- Monthly P&I
- —
- Monthly cashflow
- —
- DSCR
- —
- Eligible?
- —
Personal DTI + credit; lowest rate.
DSCR
20% down · 8.5% · 30yr
- Down + closing
- —
- Monthly P&I
- —
- Monthly cashflow
- —
- DSCR
- —
- Eligible?
- —
No personal income docs; deal must DSCR.
Hard money
10% down · 12.0% · 12mo
- Down + closing
- —
- Monthly P&I
- —
- Monthly cashflow
- —
- DSCR
- —
- Eligible?
- —
Short-term bridge; refi at stabilization.
Rent comps 5 comps
| Address | Beds | Baths | Sqft | Rent | $/sqft | DOM | Units | Dist |
|---|---|---|---|---|---|---|---|---|
| 304 Mimosa Rd North Little Rock, AR | 3.0 | 1.0 | 1200 | $1,150 | $0.96 | 25d | 1 | 0.20mi |
| 5900 McCain Park Pl North Little Rock, AR | 1.0–3.0 | 1.0–2.0 | 879 | $1,120 | $1.27 | 16d | 39 | 0.48mi |
| 4401 E 46th St North Little Rock, AR | 1.0–2.0 | 1.0–2.0 | 1029 | $1,425 | $1.38 | 16d | 6 | 0.64mi |
| 604 Ellen Dr North Little Rock, AR | 4.0 | 2.0 | 1114 | $1,550 | $1.39 | 16d | 1 | 1.33mi |
| 2107 Muldrow Dr North Little Rock, AR | 3.0 | 1.0 | 900 | $1,015 | $1.13 | 45d | 1 | 1.43mi |
Listing history 27 events
-
2026-06-21days on market $110,000 Active 88 DOM
-
2026-06-18days on market $110,000 Active 85 DOM
-
2026-06-17days on market $110,000 Active 84 DOM
-
2026-06-16days on market $110,000 Active 83 DOM
-
2026-06-15days on market $110,000 Active 82 DOM
-
2026-06-14days on market $110,000 Active 80 DOM
-
2026-06-13days on market $110,000 Active 79 DOM
-
2026-06-10days on market $110,000 Active 77 DOM
-
2026-06-09days on market $110,000 Active 76 DOM
-
2026-06-08days on market $110,000 Active 75 DOM
-
2026-06-07days on market $110,000 Active 74 DOM
-
2026-06-05days on market $110,000 Active 71 DOM
-
2026-06-03days on market $110,000 Active 70 DOM
-
2026-06-02days on market $110,000 Active 69 DOM
-
2026-06-01days on market $110,000 Active 68 DOM
-
2026-05-31days on market $110,000 Active 67 DOM
-
2026-05-31days on market $110,000 Active 66 DOM
-
2026-04-21price $110,000 471-char remark
Show marketing remark (471 chars)
Check out this 3 bedroom house that is waiting for you to call it home. Kitchen has new granite countertops and plenty of shelving and storage space. Separate dining area. Large, fenced yard with back patio area that is perfect for enjoying the outdoors. Tenant occupied, 24-hour notice. Lease in place. Monday-Friday showings only. Any offer needs to have the following verbiage included "buyer is aware there is a lease in place and agree to the lease terms".
-
2026-03-25$115,000 New Listing 471-char remark
Show marketing remark (471 chars)
Check out this 3 bedroom house that is waiting for you to call it home. Kitchen has new granite countertops and plenty of shelving and storage space. Separate dining area. Large, fenced yard with back patio area that is perfect for enjoying the outdoors. Tenant occupied, 24-hour notice. Lease in place. Monday-Friday showings only. Any offer needs to have the following verbiage included "buyer is aware there is a lease in place and agree to the lease terms".
-
2025-06-01historical
-
2025-03-20price $120,000
-
2025-01-13$124,900 New Listing
-
2024-08-31historical $995
-
2024-07-26$995
-
2022-04-22soldstatus $117,500 Sold
-
2022-02-16$117,500
-
2022-02-16historical
ⓘ Source: listings_history table (triggers on properties + properties_extension) + one-shot
backfill from property_details.listing_events for pre-trigger history.
Tax reassessment forecast AR · Resets to sale price
- Current annual tax
- $1,226 · $102/mo
- Projected year-2 tax
- $1,226 · $102/mo
- Expected delta
- $0/yr ($0/mo · 0.0%)
ⓘ Screening estimate from a state-policy table — verify with the county assessor before closing.
Climate risk First Street
- Flood 1/10 Low FEMA zone X (unshaded) · 0% chance over 30 yrs
- Wildfire 2/10 Low
- Heat 7/10 Severe 7 d/yr ≥110°F today · 19 d/yr by 30 yrs out
- Wind 4/10 Moderate 9% chance of damaging wind over 30 yrs
- Air quality 2/10 Low 2 unhealthy d/yr today · 2 by 30 yrs out
Nearby sold comps map
Loading sold comps map…
Walkable amenities ~0.75 mi
Loading nearby amenities…
Taxation est. · year 1
- Rental income
- $14,564
- − Mortgage interest
- −$6,162
- − Property taxes
- −$1,226
- − Insurance
- −$550
- − Repairs & maintenance
- −$1,165
- − Management
- −$1,165
- − Depreciation
- −$3,200
- Taxable income
- $1,096
- Est. tax owed @ 24.0%
- −$263
- After-tax cash flow
- $2,544/yr
For passive investors: Depreciation is non-cash, so a rental often shows a tax loss while cash-flowing — sheltering income. Rental losses are passive: they offset passive income freely, and up to $25,000/yr can offset ordinary (W-2) income if you actively participate and your MAGI is under $100k (phasing out to $0 by $150k); unused losses carry forward. On sale, claimed depreciation is recaptured at up to 25%, and gains may owe capital-gains tax (a 1031 exchange can defer both). Figures are a year-1 estimate at your 24.0% rate — not tax advice; consult a CPA.
Schools (NCES district)
- District
- Pulaski County Spec. School District
- NCES district ID
- 0511850
- Math proficiency
- 27% ▼ -13.00%
- Reading proficiency
- 31% ▼ -10.00%
- Median HH income
- $53,218
- Composite
- 25.67/100
- National rank
- #7394
- State rank
- #150 of 238 in AR
Livability — McAlmont
- Score
- 62/100
- State rank
- #224
- US rank
- #17100
Category grades
Schools grade is shown separately in the Schools card above.
Census & demographics
- Census place
- McAlmont, AR
- Population (ZIP)
- 14,339
Population outlook (Pulaski County) Hauer SSP2
- Today (2025)
- 415,378 people
- By 2030
- 423,720 · +2.0%
- By 2040
- 435,182 · +4.8%
- By 2050
- 440,904 · +6.1%
- By 2075
- 445,521 · +7.3%
- By 2100
- 419,173 · +0.9%
Race, ethnicity, and origin ACS 2023
- Neighborhood character
- Majority Black (63%)
- Race & ethnicity
- Black 63% White 24% Two or more races 7% Hispanic / Latino 5%
- Hispanic origin (detail)
- Mexican 5%
- Common ancestry
- Serbian 1% Slovak 1% Lithuanian 0%
- Foreign-born
- 3% · Canada
- Languages at home
- 95% English-only · Spanish 4%
Political lean MEDSL · Pulaski
- 2024 margin
- Strong D (+22.1) · D 59.8% · R 37.7% · Other 2.5%
- 2008→2024 swing
- +10.6pp toward D · 2008: 11.6pp · 2024: 22.1pp
- All cycles
- 2024: D+22.1 2020: D+22.5 2016: D+17.9 2012: D+11.4 2008: D+11.6
Not yet ingested
- Civics
- —
Market trends
- HPI YoY
- ▼ -53.78%
- Current HPI
- 123.3727
- Rent YoY
- —
- Metro
- —
- State GDP YoY
- ▲ 3.80%
- F500 in state
- 10
Industry mix (Fortune 500 HQ in AR)
| Industry | F500 HQs | Revenue |
|---|---|---|
| Retail | 1 | $681B |
|
||
| Food / Agriculture | 1 | $53B |
|
||
| Retail / Energy | 1 | $22B |
|
||
| Transportation / Logistics | 1 | $12B |
|
||
| Energy | 1 | $4B |
|
||
Price history
-6.4% since first listed10 events — show timeline
- 2026-04-21 Price Changed $110,000 CARMLS
- 2026-03-25 Listed $115,000 CARMLS
- 2025-06-01 Listing Removed — CARMLS
- 2025-03-20 Price Changed $120,000 CARMLS
- 2025-01-13 Listed $124,900 CARMLS
- 2024-08-31 Rental Removed $995 CARMLS
- 2024-07-26 Listed for Rent $995 CARMLS
- 2022-04-22 Sold (MLS) $117,500 CARMLS
- 2022-02-16 Listing Removed — CARMLS
- 2022-02-16 Listed $117,500 CARMLS
Property tax history
+15.0%/yrLatest (2025): $1,226 · +0.0% YoY. Source: county tax records.
Cash-flow waterfall
monthlySold comps — $/sqft
last 12 mo · ≤1 miLoading sold comps…