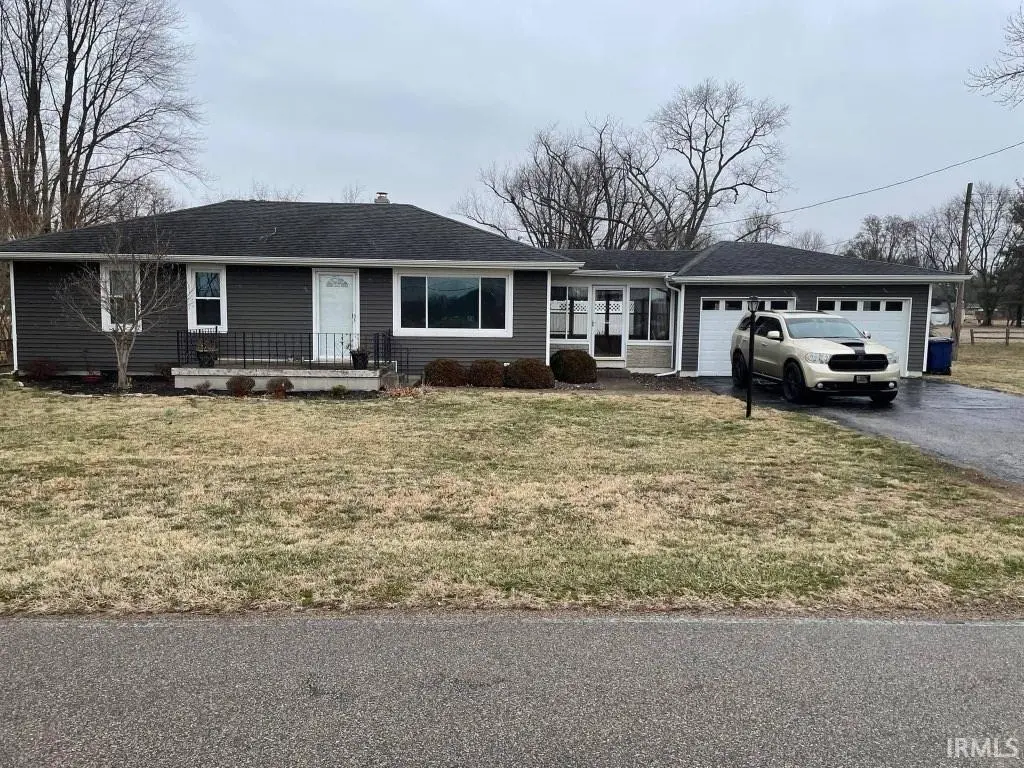
46 E 150 St S · Princeton, IN
Flood risk 1/10 · Minimal
- FEMA flood zone
- X (unshaded)
- Chance of flooding over 30 yrs
- 0.0%
- Est. flood insurance / yr
- $507 – $1,088
Fire risk 1/10 · Minimal
- Est. fire insurance / yr
- $717 – $1,331
Heat risk 5/10 · Moderate
- Hot days now (above 106°F)
- 7 days/yr
- Hot days in 30 yrs
- 19 days/yr
Wind risk 2/10 · Minimal
- Chance of severe wind over 30 yrs
- 4.0%
Air-quality risk 2/10 · Minimal
- Unhealthy air days now
- 1 days/yr
- Unhealthy air days in 30 yrs
- 2 days/yr
Risk factors via First Street. Map © Google.
Why this score? — see what drove the C grade
The composite is a weighted blend of 9 inputs, each scored 0–100. Each bar is that input's sub-score; the figure is the points it added to the 100-point composite (weight × sub-score).
- Cash flow +19.1/30.0
- ARV discount +15.0/15.0
- DSCR +6.0/10.0
- 1% rule +4.4/10.0
- Livability +3.6/5.0
- Schools +2.7/10.0
- Rent growth +2.5/5.0
- Condition / age +2.5/5.0
- Appreciation +0.0/10.0
$159,999
🖨 Deal sheet (PDF) 📄 Offer letter ✓ Due diligence
Listing remarks MLS
Move-in ready, 3 bedroom home on Hgts Chapel Road in Princeton. Very clean, well cared for home. Eat-in kitchen, breeze-way, two car attached garage. Updated kitchen and bath, neutral colors.
Key facts
- Newer roof
- 5 mins from toyota
- Newer plumbing
Tags
Property features AI
Finance
- Other: Residential property
Exterior
- Parking: Attached garage with garage door opener; 2 garage spaces
- Utilities: Public water; Public sewer; Cable available
- Home design: Single-family residence; Site-built home; One story; Above-grade finished living area
- Construction: Vinyl siding; Shingle roof; Crawl space foundation; Built as site-built construction
- Exterior features: Screened porch; Porch; Level lot; Lot dimensions approximately 115 x 80; Quarter-acre lot
Interior
- Kitchen: Microwave; Refrigerator
- Bathrooms: One full bathroom (main level)
- Heating & cooling: Central air conditioning; Ceiling fan(s); Natural gas forced-air heating
- Interior features: Ceiling fans; Eat-in kitchen
Neighborhood map
What this means for you Summary
Snapshot
- This is a 3-bed/1.0-bath single-family listed at $160k.
Deal economics
- At list price, monthly cash flow is $169 ($2k/yr) — positive.
- The deal already cash-flows at list — no discount required.
- To meet the 1% rule (rent ≥ 1% of price), the offer needs to be $150k (6.0% below list).
- Recommended offer: $150k (6.0% below list) — sets the bar for 1% rule.
- Cap rate 7.6% vs local median 4.7% in Princeton — top-decile yield for the area; either an underpriced asset or a hidden risk that comps aren't pricing in. Stress-test before assuming the spread holds.
Location & tenants
- Location reads 71/100 on livability (#131 in IN) — a middle-class / working-renter tenant base. Strengths: cost of living A+, housing A+; Watch: employment C-, amenities F, commute F.
- North Gibson School Corporation (rural): math 28% / reading 36% proficiency, ranked #223 of 301 in IN (top 74%) — families likely to look elsewhere, expect single-tenant / working-renter base with shorter leases.
- Zoned schools: Princeton Comm Primary School (414 students, 53% FRL); Princeton Community Middle (math 23% / reading 37%, grade F, #208 of 330 statewide, top 64%, 431 students, 53% FRL); Princeton Community High School (math 22% / reading 57%, grade F, #221 of 369 statewide, top 63%, 618 students, 41% FRL).
- Market conditions: 143 active listings in the ZIP; 2 comparable units currently listed for rent nearby; 167 units permitted in Gibson County in 2024 (68 in 5+ unit buildings).
Forward outlook
- Local home prices are declining (-3.0%/yr); year-one equity from $1k of loan paydown is wiped out by about $5k of value loss. Plan a longer hold.
- Gibson County population projected to shrink 10% by 2050 — rents likely to lag national; underwrite the cash flow, not the appreciation.
Negotiation context
- It's been on market 21 days — a 2% lower offer ($158k) is reasonable based on typical stale-listing flexibility.
- 2 sale attempts since 12y ago; this cycle's ask has dropped $20k (11%) from the opening price — seller is motivated, your offer sets the floor, not the list.
Risks & watch-outs
- Watch-outs: built in 1954 — expect roof / HVAC / electrical / plumbing capex.
- Climate carrying-cost: extreme-heat days projected 7→19/yr by 2055 (HVAC capex compounding) — expect insurance premiums to compound above CPI over the hold.
Questions for the listing agent
- Built in 1954 — when were the roof, HVAC, electrical panel, plumbing, and water heater last replaced?
- Is there a deadline driving the sale (1031 exchange, divorce, estate, relocation)? That informs how much negotiation room exists.
- Schools are D-rated, which usually means shorter tenancies and higher turnover. Who's the typical renter profile here, and what's been the actual vacancy rate?
- What's the average days-on-market for RENTAL listings here right now (not sales)? A rising rental-DOM trend means longer vacancies and softer asking-rent achievability than the comps imply.
- What's the recent tenant-quality profile in this submarket — average credit score on applications, eviction rate, late-payment / NSF rate, and stable-employment percentage? A property-management company in the area should have these aggregated.
- How much new for-sale + rental construction is in the pipeline within 1–3 miles? Heavy new supply typically softens prices + rents 12–24 months out; constrained supply supports both.
Investment metrics
- 1% rule
- 0.94% ✗
- Cap rate
- 7.56%
- Cash-on-cash
- 4.52%
- DSCR
- 1.20
- GRM
- 8.9
CMA / ARV
- ARV (median comp)
- $220,075
- List price
- $159,999
- Delta
- -27.30%
- Verdict
- UNDERPRICED
- Comps
- 20 within 1.0 mi
Show comp detail 5 sales within ~0.75 mi
| Address | Dist | Beds/Ba | Sqft | Sold | Price | $/sf | Match |
|---|---|---|---|---|---|---|---|
| 212 E 150 S | 0.20mi | 3/1.0 | 1,080 (+12%) | 6mo | $15,000 | $14 | 65 |
| 1713 S Main St | 0.25mi | 2/1.0 (-1) | 924 (-4%) | 16mo | $133,000 | $144 | 63 |
| 1313 S Baldwin Ct | 0.60mi | 3/2.0 | 1,081 (+13%) | 2mo | $224,900 | $208 | 46 |
| 1214 S Prince St | 0.66mi | 2/1.0 (-1) | 1,011 (+5%) | 19mo | $127,900 | $127 | 40 |
| 208 W Makemson Ave | 0.68mi | 2/1.0 (-1) | 836 (-13%) | 12mo | $90,000 | $108 | 32 |
Match score weights: distance 35% · size 25% · config 20% · recency 20%. Top-matched comps best support the ARV.
Projected returns pro-forma
-3.0% appreciation · 3.0% rent growth · sell at horizon
- IRR
- -9.3%
- Equity multiple
- 0.66×
- Total profit
- $-15,215
- Equity at exit
- $23,856
- IRR
- 0.1%
- Equity multiple
- 1.01×
- Total profit
- $461
- Equity at exit
- $13,834
Cash invested: $44,800 (down + closing). Projections, not guarantees.
Landlord ↔ Tenant lean methodology
- Overall (STATE)
- 90 Strongly Landlord-Friendly
- State Indiana
- 90 Strongly Landlord-Friendly · R+11
- County
- — inherits STATE
- City
- — inherits STATE
ZIP-level market 47670
- Home prices YoY
- -32.2%
- Active inventory
- 143
- Price-to-rent
- 8.9×
Monthly cashflow live
- Estimated rent
- $1,505 medium interval (Pro) →
- Mortgage (P&I)
- −$839
- Tax from tax record
- −$114 /mo · $1,371/yr
- Insurance
- −$67
- HOA
- −$0
- Vacancy / Maint / Mgmt
- −$316
- Net cashflow
- $169
Break-even live
Sensitivity live
| Price | -10% $259 | -5% $214 | +0% $169 | +5% $123 | +10% $78 |
|---|---|---|---|---|---|
| Rent | -10% $50 | -5% $109 | +0% $169 | +5% $228 | +10% $288 |
| Rate | -1.0pp $249 | -0.5pp $209 | base $169 | +0.5pp $127 | +1.0pp $85 |
UW: 25.0% down · 7.5% · 30yr · 1.5% tax · 5.0% vac · 8.0% maint · 8.0% mgmt
Financing live
Cash to close
- Down payment
- $40,000
- Closing costs
- $4,800
- Reserves months
- —
- Total cash needed
- —
Loan-product check · same deal, 3 products live
Conventional
25% down · 7.5% · 30yr
- Down + closing
- —
- Monthly P&I
- —
- Monthly cashflow
- —
- DSCR
- —
- Eligible?
- —
Personal DTI + credit; lowest rate.
DSCR
20% down · 8.5% · 30yr
- Down + closing
- —
- Monthly P&I
- —
- Monthly cashflow
- —
- DSCR
- —
- Eligible?
- —
No personal income docs; deal must DSCR.
Hard money
10% down · 12.0% · 12mo
- Down + closing
- —
- Monthly P&I
- —
- Monthly cashflow
- —
- DSCR
- —
- Eligible?
- —
Short-term bridge; refi at stabilization.
Rent comps 2 comps
| Address | Beds | Baths | Sqft | Rent | $/sqft | DOM | Units | Dist |
|---|---|---|---|---|---|---|---|---|
| 220 W Garfield Ave Princeton, IN | 2.0 | 1.0 | 1000 | $1,700 | $1.70 | 45d | 2 | 0.60mi |
| 102 N Seminary St Princeton, IN | 2.0 | 1.0 | 884 | $995 | $1.13 | 45d | 1 | 1.49mi |
Listing history 11 events
-
2026-06-07statusdays on market $159,999 Pending 21 DOM
-
2026-06-04days on market $159,999 Active 20 DOM
-
2026-06-02days on market $159,999 Active 19 DOM
-
2026-06-01days on market $159,999 Active 18 DOM
-
2026-05-31days on market $159,999 Active 17 DOM
-
2026-05-31days on market $159,999 Active 16 DOM
-
2026-05-14$179,999 Active 318-char remark
-
2022-01-24soldstatus $147,000
-
2014-09-02soldstatus $83,000
-
2014-08-29soldstatus $83,000 191-char remark
Show marketing remark (191 chars)
Move-in ready, 3 bedroom home on Hgts Chapel Road in Princeton. Very clean, well cared for home. Eat-in kitchen, breeze-way, two car attached garage. Updated kitchen and bath, neutral colors.
-
2014-06-30$84,500 191-char remark
Show marketing remark (191 chars)
Move-in ready, 3 bedroom home on Hgts Chapel Road in Princeton. Very clean, well cared for home. Eat-in kitchen, breeze-way, two car attached garage. Updated kitchen and bath, neutral colors.
ⓘ Source: listings_history table (triggers on properties + properties_extension) + one-shot
backfill from property_details.listing_events for pre-trigger history.
Tax reassessment forecast IN · Partial reset (capped growth)
- Current annual tax
- $1,371 · $114/mo
- Projected year-2 tax
- $1,371 · $114/mo
- Expected delta
- $0/yr ($0/mo · 0.0%)
ⓘ Screening estimate from a state-policy table — verify with the county assessor before closing.
Climate risk First Street
- Flood 1/10 Low FEMA zone X (unshaded) · 0% chance over 30 yrs
- Wildfire 1/10 Low
- Heat 5/10 Major 7 d/yr ≥106°F today · 19 d/yr by 30 yrs out
- Wind 2/10 Low 4% chance of damaging wind over 30 yrs
- Air quality 2/10 Low 1 unhealthy d/yr today · 2 by 30 yrs out
Nearby sold comps map
Loading sold comps map…
Walkable amenities ~0.75 mi
Loading nearby amenities…
Taxation est. · year 1
- Rental income
- $18,055
- − Mortgage interest
- −$8,962
- − Property taxes
- −$1,371
- − Insurance
- −$800
- − Repairs & maintenance
- −$1,444
- − Management
- −$1,444
- − Depreciation
- −$4,655
- Taxable loss
- −$622
- Est. tax savings @ 24.0%
- +$149
- After-tax cash flow
- $2,173/yr
For passive investors: Depreciation is non-cash, so a rental often shows a tax loss while cash-flowing — sheltering income. Rental losses are passive: they offset passive income freely, and up to $25,000/yr can offset ordinary (W-2) income if you actively participate and your MAGI is under $100k (phasing out to $0 by $150k); unused losses carry forward. On sale, claimed depreciation is recaptured at up to 25%, and gains may owe capital-gains tax (a 1031 exchange can defer both). Figures are a year-1 estimate at your 24.0% rate — not tax advice; consult a CPA.
Schools (NCES district)
- District
- North Gibson School Corporation
- NCES district ID
- 1807770
- Math proficiency
- 28% ▼ -10.00%
- Reading proficiency
- 36% ▼ -4.00%
- Median HH income
- $44,595
- Composite
- 27.32/100
- National rank
- #6992
- State rank
- #223 of 301 in IN
Livability — Princeton
- Score
- 71/100
- State rank
- #131
- US rank
- #6840
Category grades
Schools grade is shown separately in the Schools card above.
Census & demographics
- Census place
- Princeton, IN
- Population (ZIP)
- 11,638
Population outlook (Gibson County) Hauer SSP2
- Today (2025)
- 33,671 people
- By 2030
- 33,409 · -0.8%
- By 2040
- 32,364 · -3.9%
- By 2050
- 30,453 · -9.6%
- By 2075
- 24,610 · -26.9%
- By 2100
- 16,217 · -51.8%
Race, ethnicity, and origin ACS 2023
- Neighborhood character
- Predominantly White (85%)
- Race & ethnicity
- White 85% Black 5% Hispanic / Latino 4% Two or more races 4%
- Common ancestry
- Lithuanian 2% Slovak 2% Serbian 1%
- Foreign-born
- 3% · Canada
- Languages at home
- 95% English-only · Spanish 3% Other Asian/Pacific 1%
Political lean MEDSL · Gibson
- 2024 margin
- Solid R (+51.4) · D 23.4% · R 74.8% · Other 1.8%
- 2008→2024 swing
- -38.2pp toward R · 2008: -13.2pp · 2024: -51.4pp
- All cycles
- 2024: R+51.4 2020: R+48.2 2016: R+47.6 2012: R+31.0 2008: R+13.2
Not yet ingested
- Civics
- —
Market trends
- HPI YoY
- ▼ -104.47%
- Current HPI
- 219.932
- Rent YoY
- —
- Metro
- —
- State GDP YoY
- ▲ 2.90%
- F500 in state
- 18
Industry mix (Fortune 500 HQ in IN)
| Industry | F500 HQs | Revenue |
|---|---|---|
| Industrial Machinery | 2 | $37B |
|
||
| Healthcare | 1 | $177B |
|
||
| Pharmaceuticals | 1 | $45B |
|
||
| Metals / Steel | 1 | $18B |
|
||
| Agriculture | 1 | $17B |
|
||
| Packaging | 1 | $12B |
|
||
Price history
+89.3% since first listed7 events — show timeline
- 2026-06-04 Pending — IRMLS
- 2026-05-27 Price Changed $159,999 IRMLS
- 2026-05-14 Listed $179,999 IRMLS
- 2022-01-24 Sold (Public Records) $147,000 Public Records
- 2014-09-02 Sold (Public Records) $83,000 Public Records
- 2014-08-29 Sold (MLS) $83,000 IRMLS
- 2014-06-30 Listed $84,500 IRMLS
Property tax history
+6.8%/yrLatest (2024): $1,371 · +10.4% YoY. Source: county tax records.
Cash-flow waterfall
monthlySold comps — $/sqft
last 12 mo · ≤1 miLoading sold comps…