186 Gabriel Cir #3909 · Berkshire Lakes, FL
Flood risk 2/10 · Minimal
- FEMA flood zone
- X (unshaded)
- Chance of flooding over 30 yrs
- 0.05%
- Est. flood insurance / yr
- $507 – $1,088
Fire risk 1/10 · Minimal
- Est. fire insurance / yr
- $947 – $1,759
Heat risk 10/10 · Severe
- Hot days now (above 107°F)
- 7 days/yr
- Hot days in 30 yrs
- 27 days/yr
Wind risk 10/10 · Severe
- Chance of severe wind over 30 yrs
- 99.0%
Air-quality risk 2/10 · Minimal
- Unhealthy air days now
- 2 days/yr
- Unhealthy air days in 30 yrs
- 2 days/yr
Risk factors via First Street. Map © Google.
Why this score? — see what drove the D grade
The composite is a weighted blend of 9 inputs, each scored 0–100. Each bar is that input's sub-score; the figure is the points it added to the 100-point composite (weight × sub-score).
- Cash flow +10.4/30.0
- ARV discount +7.5/15.0
- 1% rule +5.7/10.0
- Schools +5.0/10.0
- Condition / age +4.0/5.0
- DSCR +3.0/10.0
- Livability +2.5/5.0
- Rent growth +2.2/5.0
- Appreciation +0.0/10.0
$279,900
🖨 Deal sheet 📄 Offer letter ✓ Due diligence
Listing remarks
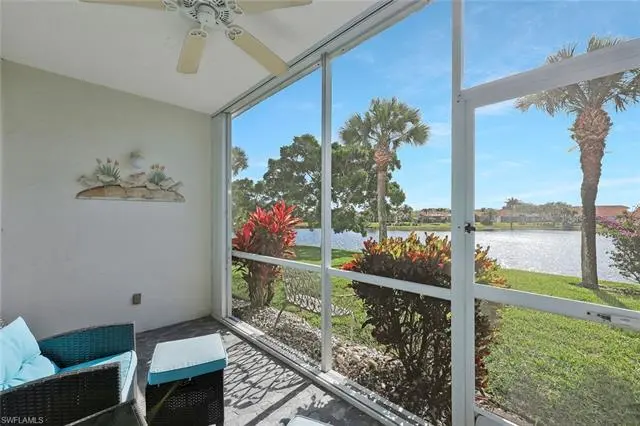
Enjoy the best of Naples living in this well-maintained 2BR/2BA condo with a detached garage and beautiful water views! This light and bright residence offers an inviting open floor plan, spacious living and dining areas, and a split-bedroom layout ideal for guests or a home office. Relax on your screened lanai overlooking the lake—perfect for morning coffee or evening unwinding. Located in a gated community with resort-style amenities including multiple pools, pickleball, and bocce, there’s always something to do (or not do—your call!). Conveniently close to shopping, dining, and Naples’ famous beaches. Whether you’re looking for a full-time home, seasonal esc
Key facts
- Gated community
- Pickleball
- Screened lanai
Tags
Property features AI
Finance
- Other: Part of a complex with 550 units and 12 units in this building; One unit per floor, one floor in this unit; Directions: Davis to Gabriel North; property is on the east side of the road
- HOA & community: Mandatory HOA (Condo management); Quarterly condo fee; Condo fee covers cable, insurance, internet/Wi‑Fi, lawn/land maintenance, exterior pest control, recreation facilities, reserves, and street lights; Community amenities include community pool, tennis court, pickleball, bocce court, bike and jog path, BBQ/picnic areas, and internet access; Gated community; Total annual recurring HOA fees reported
Exterior
- Parking: Covered parking; Paved driveway; Under-building closed parking; Detached 1-car garage
- Security: Gated community
- Utilities: Central water; Central sewer; Cable available; Reclaimed and central irrigation
- Home design: Residential property in a low-rise (1–3) building; Two-story building; Built in 1996; Rear exposure facing east; Located in the Sapphire Lakes development (Garnet Club sub-condo)
- Construction: Concrete block construction; Tile roof; Stucco finish
- Exterior features: Tennis court on property; Lake waterfront view; Cul-de-sac location on a paved road; Zero lot line; Shutters (manual); Sliding windows; Stucco exterior finish
Interior
- Kitchen: Dishwasher; Garbage disposal; Microwave; Refrigerator; Eat-in kitchen
- Bedrooms: 2 bedrooms; Master bedroom on ground/first floor; Split bedroom layout
- Flooring: Tile flooring
- Bathrooms: 2 full bathrooms; Master bath with dual sinks and shower (no tub)
- Heating & cooling: Central electric heat; Central electric air conditioning; Cable available
- Interior features: High-speed internet available; Laundry tub; Smoke detectors; Walk-in closet; Great room floor plan; Partially furnished; Screened lanai/porch; Dining area in living room and eat-in kitchen; Four ceiling fans; Six total rooms
- Laundry & utility: Washer and dryer in residence; Laundry tub
Neighborhood map
What this means for you Summary
Snapshot
- This is a 2-bed/2.0-bath condo listed at $280k. Condition is rated good.
Deal economics
- At list price, monthly cash flow is $-146 ($-2k/yr) — negative.
- To cash-flow at today's rent, offer at most $259k (7.6% below list).
- Meets the 1% rule at list price ($3k rent vs $280k).
- Recommended offer: $259k (7.6% below list) — sets the bar for cash-flow.
Location & tenants
- Location reads: area grade D — affects rentability + tenant quality, not the cash-flow math above.
- Collier (suburban): math 60% / reading 56% proficiency, ranked #16 of 73 in FL (top 22%) — acceptable for families but not a draw, mixed tenant base, ~2y average lease.
- Market conditions: Rents soft (-1.1%/yr); 436 active listings in the ZIP; 40 comparable units currently listed for rent nearby; rentals leasing fast (median 14d on market — plan ~1-2 weeks tenant-placement turnaround); 3,520 units permitted in Collier County in 2024 (959 in 5+ unit buildings).
- At $2,995/mo this rent would consume 50% of the median local household income ($72k/yr) (locally 1423% of renters already pay >50% of income on rent) — very limited rent-growth headroom before tenants either downsize or default.
Forward outlook
- Local home prices are declining (-3.0%/yr); year-one equity from $2k of loan paydown is wiped out by about $8k of value loss. Plan a longer hold.
- Collier County population projected at +30% by 2050 — long-run rental-demand tailwind backs the buy-and-hold thesis.
Negotiation context
- It's been on market 57 days — a 3% lower offer ($272k) is reasonable based on typical stale-listing flexibility.
Risks & watch-outs
- Climate carrying-cost: severe wind risk, 99% chance of damaging wind over 30y; extreme-heat days projected 7→27/yr by 2055 (HVAC capex compounding) — expect insurance premiums to compound above CPI over the hold.
Questions for the listing agent
- What do current leases actually rent for vs. the listed asking? Can we see a recent rent roll and the last 12 months of T-12 income?
- It's been on market 57 days. Have you received any prior offers? Is the seller open to a 8% concession, seller financing, or rate buy-down credit?
- What does the HOA fee cover, when was the last increase, and are there any pending special assessments or reserve-fund shortfalls?
- Any open or pending special assessments — roof, HVAC, plumbing, elevator, façade? What's the per-unit balance and payoff schedule, and is the seller paying it off at close or rolling it to the buyer?
- Is there a deadline driving the sale (1031 exchange, divorce, estate, relocation)? That informs how much negotiation room exists.
- The area grade is low — what's the realistic commute time and amenity access for the typical tenant pool here? Any planned neighborhood developments (good or bad) we should know about?
- What's the average days-on-market for RENTAL listings here right now (not sales)? A rising rental-DOM trend means longer vacancies and softer asking-rent achievability than the comps imply.
- What's the recent tenant-quality profile in this submarket — average credit score on applications, eviction rate, late-payment / NSF rate, and stable-employment percentage? A property-management company in the area should have these aggregated.
- How much new apartment / multifamily construction is in the pipeline within 1–3 miles? Heavy new supply (>2% of stock underway) typically softens rents 12–24 months out; light construction supports rent growth.
Investment metrics
- 1% rule
- 1.07% ✓
- Cap rate
- 5.67%
- Cash-on-cash
- -2.24%
- DSCR
- 0.90
- GRM
- 7.8
CMA / ARV
No comps found within radius.
Projected returns pro-forma
-3.0% appreciation · 0.0% rent growth · sell at horizon
- IRR
- -24.4%
- Equity multiple
- 0.20×
- Total profit
- $-63,036
- Equity at exit
- $41,734
- IRR
- -38.2%
- Equity multiple
- -0.27×
- Total profit
- $-99,165
- Equity at exit
- $24,201
Cash invested: $78,372 (down + closing). Projections, not guarantees.
Landlord ↔ Tenant lean methodology
- Overall (STATE)
- 87 Strongly Landlord-Friendly
- State Florida
- 87 Strongly Landlord-Friendly · R+3
- County
- — inherits STATE
- City
- — inherits STATE
ZIP-level market 34104
- Rents YoY
- -1.1%
- Active inventory
- 436
- Price-to-rent
- 7.8×
Monthly cashflow live
- Estimated rent
- $2,995 high interval (Pro) →
- Mortgage (P&I)
- −$1,468
- Tax est. 1.5%
- −$350 /mo · $4,198/yr
- Insurance
- −$117
- HOA
- −$578
- Vacancy / Maint / Mgmt
- −$629
- Net cashflow
- $-146
Break-even live
UW: 25.0% down · 7.5% · 30yr · 1.5% tax · 5.0% vac · 8.0% maint · 8.0% mgmt
Financing live
Cash to close
- Down payment
- $69,975
- Closing costs
- $8,397
- Reserves months
- —
- Total cash needed
- —
Loan-product check · same deal, 3 products live
Conventional
25% down · 7.5% · 30yr
- Down + closing
- —
- Monthly P&I
- —
- Monthly cashflow
- —
- DSCR
- —
- Eligible?
- —
Personal DTI + credit; lowest rate.
DSCR
20% down · 8.5% · 30yr
- Down + closing
- —
- Monthly P&I
- —
- Monthly cashflow
- —
- DSCR
- —
- Eligible?
- —
No personal income docs; deal must DSCR.
Hard money
10% down · 12.0% · 12mo
- Down + closing
- —
- Monthly P&I
- —
- Monthly cashflow
- —
- DSCR
- —
- Eligible?
- —
Short-term bridge; refi at stabilization.
Rent comps 40 comps
| Address | Beds | Baths | Sqft | Rent | $/sqft | DOM | Units | Dist |
|---|---|---|---|---|---|---|---|---|
| 218 Gabriel Cir Unit 3809 Naples, FL | 2.0 | 2.0 | 1200 | $3,800 | $3.17 | 13d | 1 | 0.04mi |
| 153 Gabriel Cir Unit 3003 Naples, FL | 2.0 | 2.0 | 1200 | $4,000 | $3.33 | 13d | 1 | 0.06mi |
| 120 Asaf Dr Unit 4304 Naples, FL | 2.0 | 2.0 | 1350 | $4,300 | $3.19 | 13d | 1 | 0.09mi |
| 228 Belina Dr Unit 606 Naples, FL | 2.0 | 2.0 | 1200 | $4,800 | $4.00 | 13d | 1 | 0.16mi |
| 7839 Regal Heron Cir #202 Naples, FL | 2.0 | 2.0 | 1202 | $2,000 | $1.66 | 23d | 1 | 0.26mi |
| 448 Gabriel Cir Unit 3310 Naples, FL | 2.0 | 2.0 | 1200 | $3,500 | $2.92 | 13d | 1 | 0.27mi |
| 7822 Great Heron Way #106 Naples, FL | 3.0 | 2.0 | 1431 | $2,200 | $1.54 | 23d | 1 | 0.28mi |
| 7822 Great Heron Way #106 Naples, FL | 3.0 | 2.0 | 1431 | $2,200 | $1.54 | 13d | 1 | 0.28mi |
| 388 Belina Dr Unit 1104 Naples, FL | 2.0 | 2.0 | 1200 | $4,000 | $3.33 | 13d | 1 | 0.28mi |
| 7804 Regal Heron Cir #304 Naples, FL | 2.0 | 2.0 | 1304 | $2,000 | $1.53 | 13d | 1 | 0.29mi |
| 675 Luisa Ln Unit 825 Naples, FL | 3.0 | 2.0 | 1484 | $2,300 | $1.55 | 13d | 1 | 0.30mi |
| 7835 Regal Heron Cir Naples, FL | 2.0–3.0 | 2.0 | 1316 | $1,795 | $1.36 | 23d | 2 | 0.30mi |
| 7818 Great Heron Way #303 Naples, FL | 2.0 | 2.0 | 1304 | $3,395 | $2.60 | 13d | 1 | 0.31mi |
| 7831 Regal Heron Cir Unit 1506858P Naples, FL | 3.0 | 2.0 | 1420 | $4,283 | $3.02 | 13d | 1 | 0.33mi |
| 515 Gabriel Cir Unit 1910 Naples, FL | 2.0 | 2.0 | 1200 | $4,700 | $3.92 | 13d | 1 | 0.34mi |
| 7823 Regal Heron Cir #103 Naples, FL | 2.0 | 2.0 | 1304 | $1,995 | $1.53 | 13d | 1 | 0.37mi |
| 484 Belina Dr Naples, FL | 2.0 | 1.0 | 1200 | $2,400 | $2.00 | 23d | 1 | 0.37mi |
| 620 Luisa Ct Unit 803 Naples, FL | 2.0 | 2.0 | 1200 | $2,400 | $2.00 | 13d | 1 | 0.41mi |
| 7790 Woodbrook Cir #2603 Naples, FL | 3.0 | 2.5 | 1406 | $4,500 | $3.20 | 23d | 1 | 0.48mi |
| 209 Robin Hood Cir #201 Naples, FL | 2.0 | 2.0 | 1225 | $3,500 | $2.86 | 13d | 1 | 0.49mi |
| 7725 Tara Cir Naples, FL | 1.0–3.0 | 1.0–2.0 | 929 | $1,512 | $1.63 | 13d | 1 | 0.50mi |
| 8215 Ibis Club Dr #102 Naples, FL | 2.0 | 2.0 | 1043 | $1,625 | $1.56 | 23d | 1 | 0.50mi |
| 8225 Ibis Club Dr #216 Naples, FL | 1.0 | 1.0 | 828 | $1,600 | $1.93 | 21d | 1 | 0.50mi |
| 8225 Ibis Club Dr #216 Naples, FL | 1.0 | 1.0 | 811 | $1,650 | $2.03 | 23d | 1 | 0.50mi |
| 241 Robin Hood Cir #204 Naples, FL | 2.0 | 2.0 | 1225 | $3,800 | $3.10 | 13d | 1 | 0.53mi |
| 8245 Ibis Club Dr #403 Naples, FL | 1.0 | 1.0 | 811 | $1,600 | $1.97 | 13d | 1 | 0.55mi |
| 280 Robin Hood Cir #101 Naples, FL | 3.0 | 2.0 | 1413 | $3,900 | $2.76 | 23d | 1 | 0.56mi |
| 280 Robin Hood Cir #102 Naples, FL | 3.0 | 2.0 | 1450 | $3,995 | $2.76 | 23d | 1 | 0.56mi |
| 8265 Ibis Club Dr #610 Naples, FL | 1.0 | 1.0 | 811 | $1,600 | $1.97 | 23d | 1 | 0.56mi |
| 8285 Ibis Club Dr #805 Naples, FL | 3.0 | 2.0 | 1175 | $2,450 | $2.09 | 23d | 1 | 0.57mi |
| 108 Santa Clara Dr #4 Naples, FL | 2.0 | 2.0 | 974 | $1,950 | $2.00 | 13d | 1 | 0.58mi |
| 8255 Ibis Club Dr Naples, FL | 2.0 | 2.0 | 1021 | $1,750 | $1.71 | 13d | 2 | 0.58mi |
| 321 Robin Hood Cir #201 Naples, FL | 2.0 | 2.0 | 1225 | $3,500 | $2.86 | 23d | 1 | 0.62mi |
| 116 Santa Clara Dr #12 Naples, FL | 1.0 | 1.0 | 745 | $1,600 | $2.15 | 13d | 1 | 0.62mi |
| 3536 Winifred Row Ln Naples, FL | 3.0 | 2.5 | 1300 | $2,350 | $1.81 | 13d | 10 | 0.67mi |
| 150 Santa Clara Dr #15 Naples, FL | 1.0 | 1.0 | 700 | $1,590 | $2.27 | 23d | 1 | 0.68mi |
| 169 Santa Clara Dr #11 Naples, FL | 2.0 | 2.0 | 1200 | $1,890 | $1.57 | 23d | 1 | 0.68mi |
| 161 Santa Clara Dr #14 Naples, FL | 2.0 | 2.0 | 1043 | $2,000 | $1.92 | 21d | 1 | 0.69mi |
| 180 Furse Lakes Cir Unit E8 Naples, FL | 2.0 | 2.0 | 1425 | $4,000 | $2.81 | 13d | 1 | 0.73mi |
| 1240 Wildwood Lakes Blvd Naples, FL | 2.0 | 2.0 | 1042 | $1,875 | $1.80 | 23d | 2 | 0.78mi |
HOA detail condo
- Monthly dues
- $578 · $6,936/yr
- Likely covers
- waterpoolsecurity
- Assessments
- None detected in remarks — confirm with the listing agent.
Listing history 15 events
-
2026-06-18days on market $279,900 Active 57 DOM
-
2026-06-17days on market $279,900 Active 56 DOM
-
2026-06-16days on market $279,900 Active 55 DOM
-
2026-06-15days on market $279,900 Active 54 DOM
-
2026-06-14days on market $279,900 Active 52 DOM
-
2026-06-10days on market $279,900 Active 49 DOM
-
2026-06-09days on market $279,900 Active 48 DOM
-
2026-06-08days on market $279,900 Active 47 DOM
-
2026-06-07pricedays on market $279,900 Active 46 DOM
-
2026-06-03days on market $289,900 Active 42 DOM
-
2026-06-02days on market $289,900 Active 41 DOM
-
2026-06-01days on market $289,900 Active 40 DOM
-
2026-05-31days on market $289,900 Active 39 DOM
-
2026-05-30remarks 669-char remark
-
2026-05-30$289,900 Active 38 DOM
ⓘ Source: listings_history table (triggers on properties + properties_extension) + one-shot
backfill from property_details.listing_events for pre-trigger history.
Climate risk First Street
- Flood 2/10 Low FEMA zone X (unshaded) · 5% chance over 30 yrs
- Wildfire 1/10 Low
- Heat 10/10 Extreme 7 d/yr ≥107°F today · 27 d/yr by 30 yrs out
- Wind 10/10 Extreme 99% chance of damaging wind over 30 yrs
- Air quality 2/10 Low 2 unhealthy d/yr today · 2 by 30 yrs out
Nearby sold comps map
Loading sold comps map…
Walkable amenities ~0.75 mi
Loading nearby amenities…
Taxation est. · year 1
- Rental income
- $35,943
- − Mortgage interest
- −$15,679
- − Property taxes
- −$4,198
- − Insurance
- −$1,400
- − Repairs & maintenance
- −$2,875
- − Management
- −$2,875
- − HOA
- −$6,936
- − Depreciation
- −$8,143
- Taxable loss
- −$6,163
- Est. tax savings @ 24.0%
- +$1,479
- After-tax cash flow
- $-274/yr
For passive investors: Depreciation is non-cash, so a rental often shows a tax loss while cash-flowing — sheltering income. Rental losses are passive: they offset passive income freely, and up to $25,000/yr can offset ordinary (W-2) income if you actively participate and your MAGI is under $100k (phasing out to $0 by $150k); unused losses carry forward. On sale, claimed depreciation is recaptured at up to 25%, and gains may owe capital-gains tax (a 1031 exchange can defer both). Figures are a year-1 estimate at your 24.0% rate — not tax advice; consult a CPA.
Condition & rehab AI · 12 photos
This well-maintained 2BR/2BA condo with a detached garage and beautiful water views is ready for a new owner. The property offers an inviting open floor plan and is located in a gated community with resort-style amenities.
Value-add opportunities
- Both Paint exterior walls — Enhances curb appeal and resale value
- Both Replace carpet with hardwood flooring — Improves aesthetics and increases rental value
- Both Install smart home automation — Enhances convenience and adds modern appeal
Renovation cost estimate screening
Value-add ROI direction
- Both Paint exterior walls — Enhances curb appeal and resale value ↑
- Both Replace carpet with hardwood flooring — Improves aesthetics and increases rental value ↑
- Both Install smart home automation — Enhances convenience and adds modern appeal ↑
ⓘ Cost ranges are severity-bucket heuristics (US national rule-of-thumb). Get contractor quotes + a written scope before underwriting a rehab budget.
Schools (NCES district)
- District
- Collier
- NCES district ID
- 1200330
- Math proficiency
- 60% ▼ -4.00%
- Reading proficiency
- 56% ▼ -2.00%
- Median HH income
- $58,275
- Composite
- 50.23/100
- National rank
- #1892
- State rank
- #16 of 73 in FL
Livability — Berkshire Lakes
No livability data for this city. (Only ~50 U.S. cities are tracked.)
Census & demographics
- County
- Collier County · 396,295 people
- Metro
- Naples-Marco Island, FL
- Population (ZIP)
- 26,408
- Household income
- $71,686
- Rent vs Own
- Severe rent burden
- 1423.0
Population outlook (Collier County) Hauer SSP2
- Today (2025)
- 420,858 people
- By 2030
- 450,054 · +6.9%
- By 2040
- 502,232 · +19.3%
- By 2050
- 544,932 · +29.5%
- By 2075
- 627,203 · +49.0%
- By 2100
- 659,015 · +56.6%
Race, ethnicity, and origin ACS 2023
- Neighborhood character
- Majority White (62%)
- Race & ethnicity
- White 62% Hispanic / Latino 30% Two or more races 19% Black 4% Asian 2%
- Hispanic origin (detail)
- Mexican 7% Puerto Rican 3% Cuban 6% Dominican 1%
- Common ancestry
- Lithuanian 6% Romanian 3% Hispanic 2%
- Foreign-born
- 30% · Canada, Jamaica, Dominican Republic
- Languages at home
- 66% English-only · Spanish 24% French/Haitian/Cajun 5% Russian/Polish/Slavic 1%
Political lean MEDSL · Collier
- 2024 margin
- Solid R (+33.1) · D 33.1% · R 66.2%
- 2008→2024 swing
- -10.6pp toward R · 2008: -22.5pp · 2024: -33.1pp
- All cycles
- 2024: R+33.1 2020: R+24.7 2016: R+26.0 2012: R+30.1 2008: R+22.5
Not yet ingested
- Civics
- —
Market trends
- HPI YoY
- ▼ -252.48%
- Current HPI
- 259.3498
- Rent YoY
- ▼ -1.10%
- Metro
- Naples-Marco Island, FL
- State GDP YoY
- ▲ 3.28%
- F500 in state
- 36
Industry mix (Fortune 500 HQ in FL)
| Industry | F500 HQs | Revenue |
|---|---|---|
| Industrial Technology | 2 | $29B |
|
||
| Insurance | 2 | $17B |
|
||
| Retail | 1 | $60B |
|
||
| Technology Distribution | 1 | $58B |
|
||
| Homebuilding | 1 | $35B |
|
||
| Technology Manufacturing | 1 | $35B |
|
||
Price history
1 event — show timeline
- 2026-04-22 Listed $289,900 NAPLESMLS
Cash-flow waterfall
monthlySold comps — $/sqft
last 12 mo · ≤1 miLoading sold comps…