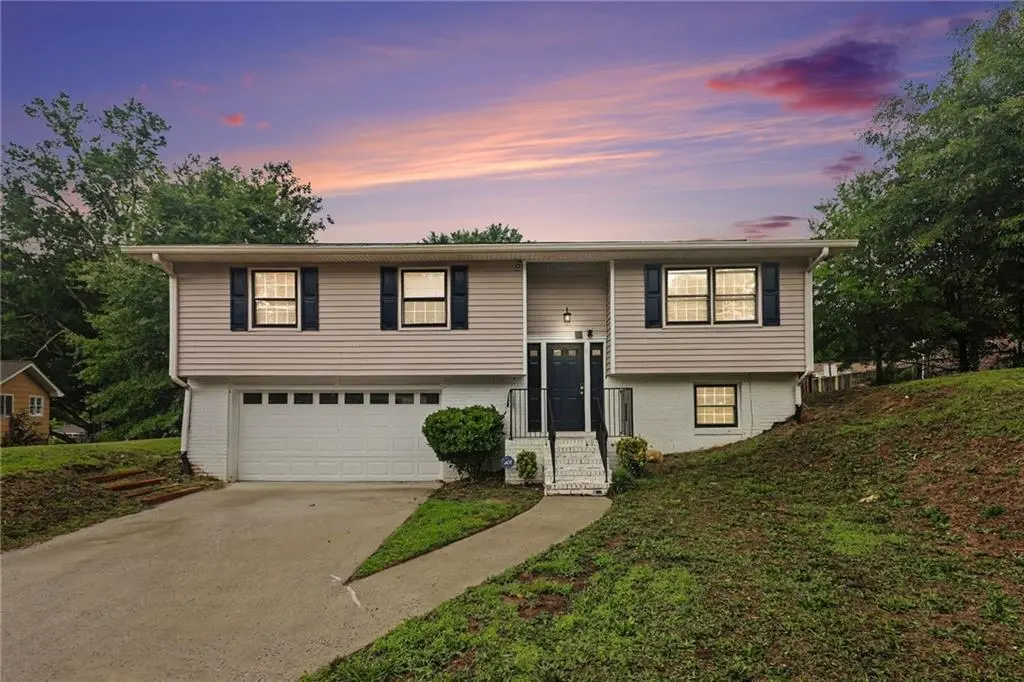
2120 Sandgate Cir · South Fulton, GA
Flood risk 1/10 · Minimal
- FEMA flood zone
- X (unshaded)
- Chance of flooding over 30 yrs
- 0.0%
- Est. flood insurance / yr
- $507 – $1,088
Fire risk 2/10 · Minimal
- Est. fire insurance / yr
- $963 – $1,789
Heat risk 6/10 · Moderate
- Hot days now (above 104°F)
- 7 days/yr
- Hot days in 30 yrs
- 18 days/yr
Wind risk 6/10 · Moderate
- Chance of severe wind over 30 yrs
- 27.0%
Air-quality risk 4/10 · Minor
- Unhealthy air days now
- 4 days/yr
- Unhealthy air days in 30 yrs
- 6 days/yr
Risk factors via First Street. Map © Google.
Why this score? — see what drove the D- grade
The composite is a weighted blend of 9 inputs, each scored 0–100. Each bar is that input's sub-score; the figure is the points it added to the 100-point composite (weight × sub-score).
- Appreciation +10.0/10.0
- Cash flow +8.5/30.0
- Schools +4.5/10.0
- Rent growth +2.7/5.0
- Livability +2.5/5.0
- Condition / age +2.5/5.0
- DSCR +2.3/10.0
- 1% rule +2.2/10.0
- ARV discount +0.0/15.0
$245,000
🖨 Deal sheet (PDF) 📄 Offer letter ✓ Due diligence
Listing remarks MLS
RECEIVED MULTIPLE OFFERS!! Recently Updated Split Level Home Under $250K Home !! 3 Bedrooms And 2.5 Bathrooms, Separate Dining Room, Large Size Family Room, Finished Basement with Half Bath, Corner Lot, Freshly Painted Inside and Outside, New Carpet, New Vanities, New Flooring, Nice Size Deck, 2 Car Garage, Fenced Back Yard. NO HOA, Must See
Key facts
- 0.27 acre lot
- 2 garage spots
- Built 1972
Property features AI
Finance
- Other: Energy-efficient appliances
Exterior
- Parking: 2-car garage; Driveway; Open parking available
- Utilities: Public water; Public sewer; Electricity available; Electric: other
- Home design: Multi/split levels; Resale property
- Construction: Vinyl siding; Shingle roof; Slab foundation; Year built: not provided
- Exterior features: Private yard; Concrete road frontage (city street)
Interior
- Kitchen: White cabinets; Dishwasher; Disposal
- Bedrooms: 3 upper-level bedrooms; Oversized master bedroom
- Flooring: Luxury vinyl
- Bathrooms: 2 full bathrooms; 1 half bathroom (main level)
- Heating & cooling: Central heating; Central air; Ceiling fans
- Interior features: Beamed ceilings; No common walls; Computer room; Great room/dining area
- Laundry & utility: Common area laundry; Dryer
Neighborhood map
What this means for you Summary
Snapshot
- This is a 3-bed/2.0-bath single-family listed at $245k.
Deal economics
- At list price, monthly cash flow is $-213 ($-3k/yr) — negative.
- To cash-flow at today's rent, offer at most $207k (15.4% below list).
- To meet the 1% rule (rent ≥ 1% of price), the offer needs to be $177k (27.6% below list).
- Recommended offer: $177k (27.6% below list) — sets the bar for 1% rule.
Location & tenants
- Location reads: area grade D — affects rentability + tenant quality, not the cash-flow math above.
- Fulton County (suburban): math 49% / reading 53% proficiency, ranked #12 of 174 in GA (top 7%) — acceptable for families but not a draw, mixed tenant base, ~2y average lease.
- Zoned schools: Amana Academy School (math 47% / reading 52%, grade D, #264 of 1,228 statewide, top 23%, 731 students, 30% FRL, charter); Mcnair Middle School (math 8% / reading 12%, grade F, #433 of 470 statewide, top 93%, 888 students, 100% FRL); Banneker High School (math 24% / reading 75%, grade D+, #28 of 424 statewide, top 7%, 1,610 students, 100% FRL) — zoned schools average 77% FRL vs 41% district-wide (35 pts higher); higher-poverty schools than district average — tighter screening recommended.
- Zoned-school proficiency averages 36% at this address vs 51% district-wide (-15 pts) — the specific schools serving this property underperform the Fulton County average; the district grade overstates school quality for this exact location.
- Market conditions: Rents flat; 655 active listings in the ZIP; 40 comparable units currently listed for rent nearby; rentals at typical pace (median 26d on market — plan ~3-4 weeks tenant-placement turnaround); 11,565 units permitted in Fulton County in 2024 (8,159 in 5+ unit buildings).
- This rent runs 32% of the median local income ($67k/yr) — at the standard rent-burdened threshold; future hikes will face affordability resistance.
Forward outlook
- In year one you build about $26k of equity ($2k loan paydown + $24k appreciation (10.0% local appreciation)).
- Fulton County population projected at +38% by 2050 — long-run rental-demand tailwind backs the buy-and-hold thesis.
- By year 2, paydown + projected appreciation supports a ~$42k cash-out refi (75% LTV) — recoverable capital for the next deal without selling this one.
Negotiation context
- It's been on market 19 days — a 2% lower offer ($241k) is reasonable based on typical stale-listing flexibility.
- 9 sale attempts since 11y ago with the ask held roughly flat each time — persistent listings suggest the price (not the market) is what's stuck; bring a comps-based counter.
Risks & watch-outs
- Climate carrying-cost: major wind risk, 27% chance of damaging wind over 30y; extreme-heat days projected 7→18/yr by 2055 (HVAC capex compounding) — expect insurance premiums to compound above CPI over the hold.
Questions for the listing agent
- What do current leases actually rent for vs. the listed asking? Can we see a recent rent roll and the last 12 months of T-12 income?
- Built in 1972 — when were the roof, HVAC, electrical panel, plumbing, and water heater last replaced?
- Is there a deadline driving the sale (1031 exchange, divorce, estate, relocation)? That informs how much negotiation room exists.
- The area grade is low — what's the realistic commute time and amenity access for the typical tenant pool here? Any planned neighborhood developments (good or bad) we should know about?
- What's the average days-on-market for RENTAL listings here right now (not sales)? A rising rental-DOM trend means longer vacancies and softer asking-rent achievability than the comps imply.
- What's the recent tenant-quality profile in this submarket — average credit score on applications, eviction rate, late-payment / NSF rate, and stable-employment percentage? A property-management company in the area should have these aggregated.
- How much new for-sale + rental construction is in the pipeline within 1–3 miles? Heavy new supply typically softens prices + rents 12–24 months out; constrained supply supports both.
Investment metrics
- 1% rule
- 0.72% ✗
- Cap rate
- 5.25%
- Cash-on-cash
- -3.73%
- DSCR
- 0.83
- GRM
- 11.5
CMA / ARV
- ARV (on-the-fly)
- $191,751
- Comps found
- 6
Show comp detail 6 sales within ~0.75 mi
| Address | Dist | Beds/Ba | Sqft | Sold | Price | $/sf | Match |
|---|---|---|---|---|---|---|---|
| 6006 Radford Dr | 0.18mi | 3/2.0 | 1,240 (+4%) | 2mo | $200,000 | $161 | 83 |
| 5998 Radford Dr | 0.22mi | 3/2.0 | 1,204 (+1%) | 13mo | $200,000 | $166 | 78 |
| 6198 Radford Dr | 0.29mi | 3/2.0 | 1,212 (+2%) | 18mo | $225,400 | $186 | 68 |
| 2065 Sandgate Cir | 0.07mi | 3/2.0 | 1,352 (+14%) | 11mo | $200,000 | $148 | 65 |
| 1969 Banks Way | 0.33mi | 3/2.5 | 1,304 (+10%) | 3mo | $194,000 | $149 | 64 |
| 2145 Sandgate Cir | 0.06mi | 3/3.0 | 1,365 (+15%) | 12mo | $190,000 | $139 | 59 |
Match score weights: distance 35% · size 25% · config 20% · recency 20%. Top-matched comps best support the ARV.
Projected returns pro-forma
10.0% appreciation · 0.95% rent growth · sell at horizon
- IRR
- 21.1%
- Equity multiple
- 2.69×
- Total profit
- $116,239
- Equity at exit
- $220,715
- IRR
- 18.7%
- Equity multiple
- 6.05×
- Total profit
- $346,265
- Equity at exit
- $475,981
Cash invested: $68,600 (down + closing). Projections, not guarantees.
Landlord ↔ Tenant lean methodology
- Overall (STATE)
- 90 Strongly Landlord-Friendly
- State Georgia
- 90 Strongly Landlord-Friendly · R+3
- County
- — inherits STATE
- City
- — inherits STATE
ZIP-level market 30349
- Home prices YoY
- 4.6%
- Rents YoY
- 0.9%
- Active inventory
- 655
- Price-to-rent
- 11.5×
Monthly cashflow live
- Estimated rent
- $1,774 high interval (Pro) →
- Mortgage (P&I)
- −$1,285
- Tax from tax record
- −$228 /mo · $2,732/yr
- Insurance
- −$102
- HOA
- −$0
- Vacancy / Maint / Mgmt
- −$372
- Net cashflow
- $-213
Break-even live
Sensitivity live
| Price | -10% $-75 | -5% $-144 | +0% $-213 | +5% $-283 | +10% $-352 |
|---|---|---|---|---|---|
| Rent | -10% $-353 | -5% $-283 | +0% $-213 | +5% $-143 | +10% $-73 |
| Rate | -1.0pp $-90 | -0.5pp $-151 | base $-213 | +0.5pp $-277 | +1.0pp $-341 |
UW: 25.0% down · 7.5% · 30yr · 1.5% tax · 5.0% vac · 8.0% maint · 8.0% mgmt
Financing live
Cash to close
- Down payment
- $61,250
- Closing costs
- $7,350
- Reserves months
- —
- Total cash needed
- —
Loan-product check · same deal, 3 products live
Conventional
25% down · 7.5% · 30yr
- Down + closing
- —
- Monthly P&I
- —
- Monthly cashflow
- —
- DSCR
- —
- Eligible?
- —
Personal DTI + credit; lowest rate.
DSCR
20% down · 8.5% · 30yr
- Down + closing
- —
- Monthly P&I
- —
- Monthly cashflow
- —
- DSCR
- —
- Eligible?
- —
No personal income docs; deal must DSCR.
Hard money
10% down · 12.0% · 12mo
- Down + closing
- —
- Monthly P&I
- —
- Monthly cashflow
- —
- DSCR
- —
- Eligible?
- —
Short-term bridge; refi at stabilization.
Rent comps 40 comps
| Address | Beds | Baths | Sqft | Rent | $/sqft | DOM | Units | Dist |
|---|---|---|---|---|---|---|---|---|
| 2014 Radford Ct Riverdale, GA | 3.0 | 1.5 | 1190 | $1,665 | $1.40 | 45d | 1 | 0.25mi |
| 6165 Radford Dr Riverdale, GA | 3.0 | 2.0 | 1232 | $1,799 | $1.46 | 45d | 1 | 0.27mi |
| 6165 Radford Dr Riverdale, GA | 3.0 | 2.0 | 1232 | $1,799 | $1.46 | 26d | 1 | 0.27mi |
| 6165 Radford Dr Riverdale, GA | 3.0 | 2.0 | 1232 | $1,695 | $1.38 | 7d | 1 | 0.27mi |
| 6165 Radford Dr Riverdale, GA | 3.0 | 2.0 | 1232 | $1,750 | $1.42 | 24d | 1 | 0.27mi |
| 5866 Summerglen Ln Atlanta, GA | 3.0 | 2.0 | 1400 | $1,450 | $1.04 | 45d | 1 | 0.32mi |
| 2300 Flat Shoals Rd Unit 2 Riverdale, GA | 2.0 | 3.0 | 1000 | $1,425 | $1.43 | 26d | 1 | 0.43mi |
| 6048 Oak Bend Ct Riverdale, GA | 3.0 | 2.5 | 1500 | $1,750 | $1.17 | 24d | 1 | 0.55mi |
| 6048 Oak Bend Ct Riverdale, GA | 3.0 | 2.5 | 1500 | $1,750 | $1.17 | 0d | 1 | 0.55mi |
| 5730 N Castlegate Dr Unit A Atlanta, GA | 2.0 | 2.5 | 1125 | $1,395 | $1.24 | 45d | 1 | 0.57mi |
| 395 Fox Trail Dr Atlanta, GA | 3.0 | 2.0 | 1400 | $1,980 | $1.41 | 13d | 1 | 0.72mi |
| 6115 Camden Forrest Dr Riverdale, GA | 2.0 | 2.5 | 1100 | $1,600 | $1.45 | 20d | 1 | 0.74mi |
| 6071 Camden Forrest Dr Riverdale, GA | 2.0 | 3.0 | 1040 | $1,650 | $1.59 | 0d | 1 | 0.76mi |
| 2555 Flat Shoals Rd #404 College Park, GA | 3.0 | 2.5 | 1408 | $1,700 | $1.21 | 26d | 1 | 0.79mi |
| 5477 Denny Dr Atlanta, GA | 4.0 | 3.0 | 1500 | $1,650 | $1.10 | 45d | 1 | 0.80mi |
| 2500 Pleasant Hill Rd Atlanta, GA | 2.0–3.0 | 1.5–2.5 | 1405 | $1,449 | $1.03 | 26d | 2 | 0.87mi |
| 6370 Olmadison Pl Atlanta, GA | 3.0 | 2.5 | 1440 | $1,795 | $1.25 | 45d | 1 | 0.87mi |
| 6368 Olmadison Pl Atlanta, GA | 3.0 | 2.5 | 1428 | $1,596 | $1.12 | 0d | 1 | 0.87mi |
| 6108 Camden Forrest Cv Riverdale, GA | 2.0 | 2.0 | 1040 | $1,360 | $1.31 | 26d | 1 | 0.88mi |
| 1875 E Pleasant Hill Rd Atlanta, GA | 1.0–2.0 | 1.0–2.0 | 942 | $1,595 | $1.69 | 0d | 21 | 0.89mi |
| 1748 Broad River Rd Atlanta, GA | 2.0 | 2.5 | 1352 | $1,800 | $1.33 | 45d | 1 | 0.93mi |
| 2184 Olmadison Vw Atlanta, GA | 2.0 | 2.0 | 1236 | $1,985 | $1.61 | 20d | 1 | 0.95mi |
| 5515 Scofield Rd Atlanta, GA | 3.0 | 2.0 | 1109 | $1,788 | $1.61 | 12d | 1 | 0.95mi |
| 1758 Broad River Rd Atlanta, GA | 2.0 | 2.5 | 1384 | $1,650 | $1.19 | 4d | 1 | 0.95mi |
| 6454 W Fayetteville Rd Riverdale, GA | 3.0 | 2.0 | 1204 | $1,950 | $1.62 | 22d | 1 | 1.01mi |
| 6090 Emerald Pointe Cir Atlanta, GA | 3.0 | 2.0 | 1200 | $1,875 | $1.56 | 20d | 1 | 1.04mi |
| 6056 Carriage Ct Atlanta, GA | 3.0 | 2.0 | 1400 | $1,549 | $1.11 | 0d | 1 | 1.08mi |
| 2592 Rocky Ct Atlanta, GA | 2.0 | 2.5 | 1424 | $2,000 | $1.40 | 45d | 1 | 1.10mi |
| 5442 Scofield Rd Atlanta, GA | 3.0 | 1.5 | 1368 | $1,775 | $1.30 | 45d | 1 | 1.13mi |
| 2667 Rocky Ct Atlanta, GA | 3.0 | 2.5 | 1432 | $2,200 | $1.54 | 45d | 1 | 1.14mi |
| 855 Old Rocky Rd Atlanta, GA | 3.0 | 2.0 | 1310 | $1,710 | $1.31 | 26d | 1 | 1.18mi |
| 5690 Hampton Ct Atlanta, GA | 2.0 | 3.0 | 1184 | $1,495 | $1.26 | 45d | 1 | 1.19mi |
| 6560 Emerald Pointe Cir Atlanta, GA | 3.0 | 2.0 | 1309 | $1,500 | $1.15 | 24d | 1 | 1.20mi |
| 1507 Pine Dr Atlanta, GA | 1.0–3.0 | 1.0–2.0 | 1050 | $1,576 | $1.50 | 4d | 9 | 1.23mi |
| 6215 Stimson Way Riverdale, GA | 3.0 | 2.0 | 1384 | $1,805 | $1.30 | 3d | 1 | 1.25mi |
| 6684 Judy Ln Riverdale, GA | 3.0 | 2.0 | 1356 | $1,705 | $1.26 | 45d | 1 | 1.27mi |
| 1561 Norman Xing Atlanta, GA | 3.0 | 2.5 | 1436 | $1,699 | $1.18 | 45d | 1 | 1.30mi |
| 1410 Willow Dr Riverdale, GA | 3.0 | 2.0 | 1365 | $1,599 | $1.17 | 45d | 1 | 1.35mi |
| 5489 Park Pl S Atlanta, GA | 2.0 | 2.5 | 1184 | $1,550 | $1.31 | 26d | 1 | 1.35mi |
| 5267 Joan of Arc Pl Atlanta, GA | 3.0 | 1.0 | 1066 | $1,743 | $1.64 | 45d | 1 | 1.37mi |
Listing history 11 events
-
2026-06-21days on market $245,000 Active 19 DOM
-
2026-06-18days on market $245,000 Active 16 DOM
-
2026-06-17days on market $245,000 Active 15 DOM
-
2026-06-16days on market $245,000 Active 14 DOM
-
2026-06-15days on market $245,000 Active 13 DOM
-
2026-06-13days on market $245,000 Active 11 DOM
-
2026-06-09days on market $245,000 Active 7 DOM
-
2026-06-08days on market $245,000 Active 6 DOM
-
2026-06-07days on market $245,000 Active 5 DOM
-
2026-06-04days on market $245,000 Active 2 DOM
-
2026-06-03$245,000 Active 1 DOM
ⓘ Source: listings_history table (triggers on properties + properties_extension) + one-shot
backfill from property_details.listing_events for pre-trigger history.
Tax reassessment forecast GA · Resets to sale price
- Current annual tax
- $2,732 · $228/mo
- Projected year-2 tax
- $2,732 · $228/mo
- Expected delta
- $0/yr ($0/mo · 0.0%)
ⓘ Screening estimate from a state-policy table — verify with the county assessor before closing.
Climate risk First Street
- Flood 1/10 Low FEMA zone X (unshaded) · 0% chance over 30 yrs
- Wildfire 2/10 Low
- Heat 6/10 Major 7 d/yr ≥104°F today · 18 d/yr by 30 yrs out
- Wind 6/10 Major 27% chance of damaging wind over 30 yrs
- Air quality 4/10 Moderate 4 unhealthy d/yr today · 6 by 30 yrs out
Nearby sold comps map
Loading sold comps map…
Walkable amenities ~0.75 mi
Loading nearby amenities…
Taxation est. · year 1
- Rental income
- $21,284
- − Mortgage interest
- −$13,724
- − Property taxes
- −$2,732
- − Insurance
- −$1,225
- − Repairs & maintenance
- −$1,703
- − Management
- −$1,703
- − Depreciation
- −$7,127
- Taxable loss
- −$6,929
- Est. tax savings @ 24.0%
- +$1,663
- After-tax cash flow
- $-897/yr
For passive investors: Depreciation is non-cash, so a rental often shows a tax loss while cash-flowing — sheltering income. Rental losses are passive: they offset passive income freely, and up to $25,000/yr can offset ordinary (W-2) income if you actively participate and your MAGI is under $100k (phasing out to $0 by $150k); unused losses carry forward. On sale, claimed depreciation is recaptured at up to 25%, and gains may owe capital-gains tax (a 1031 exchange can defer both). Figures are a year-1 estimate at your 24.0% rate — not tax advice; consult a CPA.
Schools (NCES district)
- District
- Fulton County
- NCES district ID
- 1302280
- Math proficiency
- 49% ▼ -2.00%
- Reading proficiency
- 53% ▬ 0.00%
- Median HH income
- $68,035
- Composite
- 45.33/100
- National rank
- #2640
- State rank
- #12 of 174 in GA
Livability — South Fulton
No livability data for this city. (Only ~50 U.S. cities are tracked.)
Census & demographics
- Census place
- South Fulton, GA
- County
- Fulton County · 1,094,430 people
- City population
- 127,674
- Metro
- Atlanta-Sandy Springs-Alpharetta, GA
- Population (ZIP)
- 79,872
- Household income
- $67,023
- Rent vs Own
- Severe rent burden
- 4258.0
Population outlook (Fulton County) Hauer SSP2
- Today (2025)
- 1,203,707 people
- By 2030
- 1,299,706 · +8.0%
- By 2040
- 1,488,256 · +23.6%
- By 2050
- 1,664,580 · +38.3%
- By 2075
- 2,036,072 · +69.2%
- By 2100
- 2,222,402 · +84.6%
Race, ethnicity, and origin ACS 2023
- Neighborhood character
- Predominantly Black (89%)
- Race & ethnicity
- Black 89% Hispanic / Latino 5% Two or more races 4% White 3%
- Foreign-born
- 9% · Canada
- Languages at home
- 88% English-only · Spanish 6% French/Haitian/Cajun 1%
Political lean MEDSL · Fulton
- 2024 margin
- Solid D (+44.9) · D 71.9% · R 27.0% · Other 1.1%
- 2008→2024 swing
- +9.8pp toward D · 2008: 35.0pp · 2024: 44.9pp
- All cycles
- 2024: D+44.9 2020: D+46.4 2016: D+42.1 2012: D+29.6 2008: D+35.0
Not yet ingested
- Civics
- —
Market trends
- HPI YoY
- ▲ 18.01%
- Current HPI
- 407.99
- Rent YoY
- ▲ 0.95%
- Metro
- Atlanta-Sandy Springs-Alpharetta, GA
- State GDP YoY
- ▲ 2.66%
- F500 in state
- 28
Industry mix (Fortune 500 HQ in GA)
| Industry | F500 HQs | Revenue |
|---|---|---|
| Paper / Packaging | 2 | $29B |
|
||
| Retail | 1 | $160B |
|
||
| Transportation / Logistics | 1 | $91B |
|
||
| Airlines | 1 | $62B |
|
||
| Consumer Goods | 1 | $47B |
|
||
| Utilities | 1 | $25B |
|
||
Price history
+528.2% since first listed33 events — show timeline
- 2026-06-02 Listed $245,000 FMLS
- 2024-02-07 Rental Removed $1,750 APPFOLIO
- 2024-01-07 Listed for Rent $1,750 APPFOLIO
- 2022-10-03 Sold (Public Records) $243,000 Public Records
- 2022-09-30 Sold (MLS) $243,000 GAMLS
- 2022-09-30 Sold (MLS) $243,000 FMLS
- 2022-09-07 Price Changed $260,000 GAMLS
- 2022-09-07 Price Changed $260,000 FMLS
- 2022-09-07 Contingent — FMLS
- 2022-09-07 Contingent — GAMLS
- 2022-08-31 Listed $249,900 GAMLS
- 2022-08-31 Listed $249,900 FMLS
- 2018-06-13 Sold (Public Records) $127,000 Public Records
- 2018-05-16 Listing Removed — GAMLS
- 2018-05-15 Sold (MLS) $127,000 GAMLS
- 2018-05-15 Sold (MLS) $127,000 FMLS
- 2018-04-07 Pending — GAMLS
- 2018-04-07 Pending — FMLS
- 2018-04-07 Price Changed $134,900 GAMLS
- 2018-04-06 Price Changed $134,900 FMLS
- 2018-03-23 Relisted — GAMLS
- 2018-03-23 Relisted — FMLS
- 2018-03-13 Pending — GAMLS
- 2018-03-13 Pending — FMLS
- 2018-02-09 Listed $137,900 GAMLS
- 2018-02-09 Listed $137,900 FMLS
- 2018-01-09 Sold (Public Records) $111,000 Public Records
- 2016-12-03 Pending — GAMLS
- 2016-05-19 Pending — GAMLS
- 2015-07-31 Pending — GAMLS
- 2015-07-31 Listing Removed — GAMLS
- 2015-03-24 Listed $125,800 GAMLS
- 1977-09-01 Sold (Public Records) $39,000 Public Records
Property tax history
+10.1%/yrLatest (2025): $2,732 · +3.7% YoY. Source: county tax records.
Cash-flow waterfall
monthlySold comps — $/sqft
last 12 mo · ≤1 miLoading sold comps…