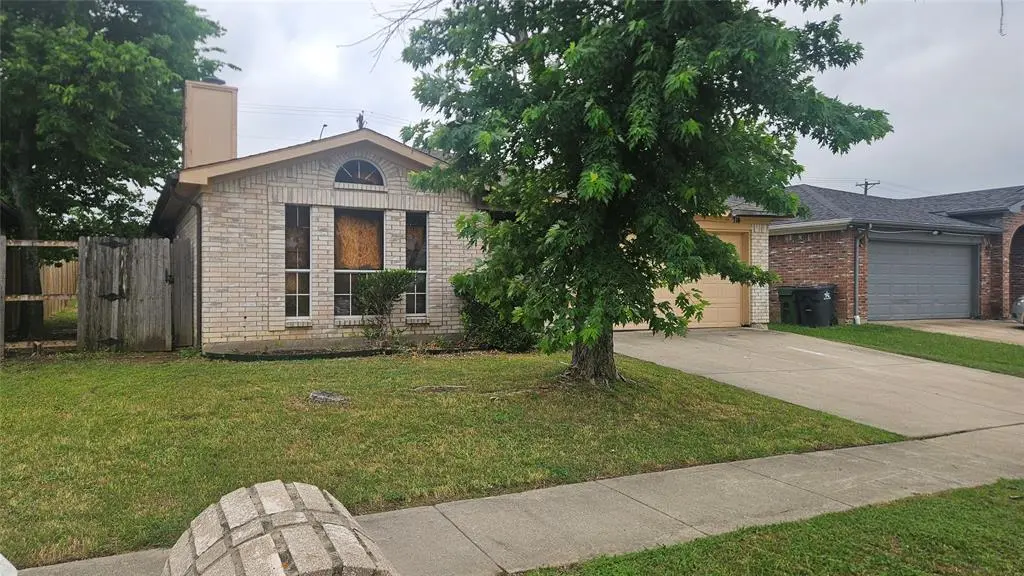
714 Charles City Dr · Arlington, TX
Flood risk 1/10 · Minimal
- FEMA flood zone
- X (unshaded)
- Chance of flooding over 30 yrs
- 0.0%
- Est. flood insurance / yr
- $507 – $1,088
Fire risk 4/10 · Minor
- Est. fire insurance / yr
- $1,222 – $2,270
Heat risk 7/10 · Major
- Hot days now (above 110°F)
- 7 days/yr
- Hot days in 30 yrs
- 23 days/yr
Wind risk 6/10 · Moderate
- Chance of severe wind over 30 yrs
- 27.0%
Air-quality risk 3/10 · Minor
- Unhealthy air days now
- 2 days/yr
- Unhealthy air days in 30 yrs
- 3 days/yr
Risk factors via First Street. Map © Google.
Why this score? — see what drove the B- grade
The composite is a weighted blend of 9 inputs, each scored 0–100. Each bar is that input's sub-score; the figure is the points it added to the 100-point composite (weight × sub-score).
- Cash flow +30.0/30.0
- 1% rule +10.0/10.0
- DSCR +10.0/10.0
- ARV discount +7.5/15.0
- Livability +3.9/5.0
- Rent growth +2.8/5.0
- Schools +2.5/10.0
- Condition / age +2.5/5.0
- Appreciation +0.7/10.0
$130,000
🖨 Deal sheet (PDF) 📄 Offer letter ✓ Due diligence
Listing remarks MLS
Home features 3 bedrooms, 2 baths and 2 car garage. Nice floor plan that is open for entertaining with large family room and good sized kitchen. New roof , flooring and fresh paint. Home is located close by schools and has easy access to I-20 for all the shopping and a large number of restaurants in the Highlands and Parks Mall of Arlington.
Key facts
- Industrial aesthetic
- Exposed rafters
- Large backyard
Tags
Property features AI
Finance
- Other: Property type: Residential (Single Family Residence); Accessibility features: none
- Financial info: Loan treated as clear; No second mortgage indicated
- HOA & community: No association
Exterior
- Parking: Attached 2-car garage with double doors; Covered parking (2 spaces); Driveway; Garage faces front
- Security: No specific security features listed
- Utilities: City water; City sewer; Not in a municipal utility district
- Home design: Single-family residence; Built in 1996; One story
- Construction: Year built 1996; Construction materials not specified; Roof and foundation details not specified
- Exterior features: Lot smaller than 0.5 acre (about 0.138 acre); Subdivision: Colonial Greens South Add
Interior
- Kitchen: Kitchen approximately 15 x 8; Includes appliances (unspecified)
- Bedrooms: Primary bedroom (1st level) approximately 15 x 12; Secondary bedroom (1st level) approximately 12 x 11; Third bedroom (1st level) approximately 13 x 10
- Flooring: Flooring details not specified
- Bathrooms: Two full bathrooms
- Heating & cooling: Central heating (electric); Central air conditioning (electric); Wood-burning fireplace
- Interior features: One-level layout; Open living area; Dining area
- Laundry & utility: Utility features not specified
Neighborhood map
What this means for you Summary
Snapshot
- This is a 3-bed/2.0-bath single-family listed at $130k.
Deal economics
- At list price, monthly cash flow is $570 ($7k/yr) — positive.
- The deal already cash-flows at list — no discount required.
- Meets the 1% rule at list price ($2k rent vs $130k).
- Cap rate 11.6% vs local median 3.6% in Arlington — top-decile yield for the area; either an underpriced asset or a hidden risk that comps aren't pricing in. Stress-test before assuming the spread holds.
Location & tenants
- Location reads 78/100 on livability (#75 in TX, #2,697 nationally) — a middle-class / working-renter tenant base. Strengths: amenities A+, cost of living A+, housing A+; Watch: crime F, commute F.
- Arlington ISD (urban): math 24% / reading 34% proficiency, ranked #629 of 826 in TX (top 76%) — low school quality limits family demand, transient renter base, plan for 1-2y turnover.
- Zoned schools: Bebensee El (math 16% / reading 22%, grade F, #3,739 of 4,322 statewide, top 87%, 789 students, 87% FRL); Ousley J H (math 37% / reading 49%, grade D-, #540 of 1,662 statewide, top 33%, 876 students, 78% FRL); Seguin H S (math 32% / reading 45%, grade F, #866 of 1,632 statewide, top 54%, 1,529 students, 72% FRL) — zoned schools average 79% FRL vs 60% district-wide (19 pts higher); higher-poverty schools than district average — tighter screening recommended.
- Market conditions: Rents rising (+1.4%/yr); 80 active listings in the ZIP; 40 comparable units currently listed for rent nearby; rentals at typical pace (median 24d on market — plan ~3-4 weeks tenant-placement turnaround); 42% of comp listings sitting > 30 days — soft ceiling on asking rent; solid renter incomes; 18,938 units permitted in Tarrant County in 2024 (8,336 in 5+ unit buildings).
- This rent runs 31% of the median local income ($88k/yr) — at the standard rent-burdened threshold; future hikes will face affordability resistance.
Forward outlook
- Local home prices are declining (-3.0%/yr); year-one equity from $899 of loan paydown is wiped out by about $4k of value loss. Plan a longer hold.
- Tarrant County population projected at +41% by 2050 — long-run rental-demand tailwind backs the buy-and-hold thesis.
- At projected returns (-3.0% appreciation + 1.4% rent growth), your $36k cash investment doubles in ~8 years — after that, you're playing with house money.
Negotiation context
- Only 10 days on market — expect competitive offers; lowballing is unlikely to land.
- 3 sale attempts since 7y ago with the ask held roughly flat each time — persistent listings suggest the price (not the market) is what's stuck; bring a comps-based counter.
Risks & watch-outs
- Watch-outs: property tax is 4.4% of price.
- Climate carrying-cost: major wind risk, 27% chance of damaging wind over 30y; extreme-heat days projected 7→23/yr by 2055 (HVAC capex compounding) — expect insurance premiums to compound above CPI over the hold.
Questions for the listing agent
- Property tax is high relative to price — has the assessment been appealed recently, and will the sale trigger a re-assessment?
- Is there a deadline driving the sale (1031 exchange, divorce, estate, relocation)? That informs how much negotiation room exists.
- Schools are D-rated, which usually means shorter tenancies and higher turnover. Who's the typical renter profile here, and what's been the actual vacancy rate?
- Crime grade is F in this area — have there been break-ins, vandalism, or insurance claims at this property in the last 3 years? What carrier currently insures it and at what premium?
- What's the average days-on-market for RENTAL listings here right now (not sales)? A rising rental-DOM trend means longer vacancies and softer asking-rent achievability than the comps imply.
- What's the recent tenant-quality profile in this submarket — average credit score on applications, eviction rate, late-payment / NSF rate, and stable-employment percentage? A property-management company in the area should have these aggregated.
- How much new for-sale + rental construction is in the pipeline within 1–3 miles? Heavy new supply typically softens prices + rents 12–24 months out; constrained supply supports both.
Investment metrics
- 1% rule
- 1.73% ✓
- Cap rate
- 11.55%
- Cash-on-cash
- 18.79%
- DSCR
- 1.84
- GRM
- 4.8
CMA / ARV
- ARV (on-the-fly)
- $301,888
- Comps found
- 12
Show comp detail 12 sales within ~0.75 mi
| Address | Dist | Beds/Ba | Sqft | Sold | Price | $/sf | Match |
|---|---|---|---|---|---|---|---|
| 6423 Rising Meadow Dr | 0.32mi | 3/2.0 | 1,435 (+1%) | 4mo | $269,900 | $188 | 80 |
| 5711 Congressional Dr | 0.46mi | 3/2.0 | 1,429 (+0%) | 4mo | $285,000 | $199 | 75 |
| 424 Benjamin Ln | 0.41mi | 3/2.0 | 1,355 (-5%) | 2mo | $279,900 | $207 | 71 |
| 615 Red Coat Ln | 0.16mi | 3/2.0 | 1,254 (-12%) | 4mo | $270,000 | $215 | 69 |
| 6418 Jennie Ln | 0.26mi | 3/2.0 | 1,276 (-10%) | 3mo | $270,000 | $212 | 68 |
| 304 Valley Forge Ln | 0.64mi | 3/2.0 | 1,393 (-2%) | 1mo | $299,500 | $215 | 66 |
| 6118 Wall St | 0.61mi | 3/2.0 | 1,468 (+3%) | 2mo | $290,000 | $198 | 64 |
| 319 Faircrest Dr | 0.59mi | 3/2.0 | 1,320 (-7%) | 3mo | $287,000 | $217 | 58 |
| 508 Valley Mills Dr | 0.38mi | 3/2.0 | 1,211 (-15%) | 2mo | $285,000 | $235 | 56 |
| 804 Castlewick Ct | 0.69mi | 3/2.0 | 1,539 (+8%) | 1mo | $285,000 | $185 | 54 |
| 6207 Patriotic Ct | 0.74mi | 3/2.0 | 1,301 (-9%) | 2mo | $285,000 | $219 | 50 |
| 1201 Eastwick Dr | 0.74mi | 3/2.0 | 1,595 (+12%) | 2mo | $289,000 | $181 | 44 |
Match score weights: distance 35% · size 25% · config 20% · recency 20%. Top-matched comps best support the ARV.
Projected returns pro-forma
-3.0% appreciation · 1.39% rent growth · sell at horizon
- IRR
- 8.5%
- Equity multiple
- 1.33×
- Total profit
- $11,871
- Equity at exit
- $19,383
- IRR
- 16.1%
- Equity multiple
- 2.20×
- Total profit
- $43,725
- Equity at exit
- $11,240
Cash invested: $36,400 (down + closing). Projections, not guarantees.
Landlord ↔ Tenant lean methodology
- Overall (STATE)
- 87 Strongly Landlord-Friendly
- State Texas
- 87 Strongly Landlord-Friendly · R+5
- County
- — inherits STATE
- City
- — inherits STATE
ZIP-level market 76018
- Home prices YoY
- -2.8%
- Rents YoY
- 1.4%
- Active inventory
- 80
- Price-to-rent
- 4.8×
Monthly cashflow live
- Estimated rent
- $2,254 high interval (Pro) →
- Mortgage (P&I)
- −$682
- Tax from tax record
- −$475 /mo · $5,700/yr
- Insurance
- −$54
- HOA
- −$0
- Vacancy / Maint / Mgmt
- −$473
- Net cashflow
- $570
Break-even live
Sensitivity live
| Price | -10% $644 | -5% $607 | +0% $570 | +5% $533 | +10% $496 |
|---|---|---|---|---|---|
| Rent | -10% $392 | -5% $481 | +0% $570 | +5% $659 | +10% $748 |
| Rate | -1.0pp $635 | -0.5pp $603 | base $570 | +0.5pp $536 | +1.0pp $502 |
UW: 25.0% down · 7.5% · 30yr · 1.5% tax · 5.0% vac · 8.0% maint · 8.0% mgmt
Financing live
Cash to close
- Down payment
- $32,500
- Closing costs
- $3,900
- Reserves months
- —
- Total cash needed
- —
Loan-product check · same deal, 3 products live
Conventional
25% down · 7.5% · 30yr
- Down + closing
- —
- Monthly P&I
- —
- Monthly cashflow
- —
- DSCR
- —
- Eligible?
- —
Personal DTI + credit; lowest rate.
DSCR
20% down · 8.5% · 30yr
- Down + closing
- —
- Monthly P&I
- —
- Monthly cashflow
- —
- DSCR
- —
- Eligible?
- —
No personal income docs; deal must DSCR.
Hard money
10% down · 12.0% · 12mo
- Down + closing
- —
- Monthly P&I
- —
- Monthly cashflow
- —
- DSCR
- —
- Eligible?
- —
Short-term bridge; refi at stabilization.
Rent comps 40 comps
| Address | Beds | Baths | Sqft | Rent | $/sqft | DOM | Units | Dist |
|---|---|---|---|---|---|---|---|---|
| 708 Port Richmond Way Arlington, TX | 3.0 | 2.0 | 1180 | $1,900 | $1.61 | 12d | 1 | 0.06mi |
| 6202 Tidewater Dr Arlington, TX | 3.0 | 2.0 | 1424 | $2,100 | $1.47 | 21d | 1 | 0.08mi |
| 734 Port Richmond Way Arlington, TX | 3.0 | 2.0 | 1424 | $2,050 | $1.44 | 45d | 1 | 0.13mi |
| 6002 Cohoke Dr Arlington, TX | 3.0 | 2.0 | 1575 | $2,050 | $1.30 | 45d | 1 | 0.17mi |
| 6403 Jennie Ln Arlington, TX | 3.0 | 2.0 | 1491 | $2,400 | $1.61 | 45d | 1 | 0.18mi |
| 6410 Juliette Run Arlington, TX | 3.0 | 2.0 | 1563 | $2,009 | $1.29 | 13d | 1 | 0.22mi |
| 6111 Inks Lake Dr Arlington, TX | 3.0 | 2.0 | 1521 | $2,165 | $1.42 | 45d | 1 | 0.23mi |
| 6101 Summerfield Dr Arlington, TX | 3.0 | 2.0 | 1575 | $2,440 | $1.55 | 8d | 1 | 0.23mi |
| 6010 Rocky Point Dr Arlington, TX | 3.0 | 2.0 | 1712 | $2,100 | $1.23 | 18d | 1 | 0.24mi |
| 6010 Rocky Point Dr Arlington, TX | 3.0 | 2.0 | 1712 | $2,100 | $1.23 | 16d | 1 | 0.24mi |
| 6002 Rising Meadow Dr Arlington, TX | 3.0 | 2.0 | 1864 | $2,750 | $1.48 | 45d | 1 | 0.28mi |
| 6101 Rising Meadow Dr Arlington, TX | 4.0 | 2.0 | 1720 | $2,720 | $1.58 | 0d | 1 | 0.29mi |
| 850 Colson Dr Arlington, TX | 3.0 | 2.0 | 1350 | $2,095 | $1.55 | 45d | 1 | 0.34mi |
| 517 Valley Mills Dr Arlington, TX | 3.0 | 2.0 | 1200 | $1,800 | $1.50 | 45d | 1 | 0.35mi |
| 420 Revolution Ln Arlington, TX | 4.0 | 2.0 | 1712 | $1,995 | $1.17 | 4d | 1 | 0.43mi |
| 700 N Emma Dr Arlington, TX | 3.0 | 2.0 | 1830 | $2,850 | $1.56 | 21d | 1 | 0.48mi |
| 1100 Mapleview Dr Arlington, TX | 3.0 | 2.0 | 1580 | $2,098 | $1.33 | 45d | 1 | 0.49mi |
| 6000 Lavaca Dr Arlington, TX | 3.0 | 2.0 | 1559 | $2,046 | $1.31 | 8d | 1 | 0.50mi |
| 325 Angelina Dr Arlington, TX | 3.0 | 2.0 | 1441 | $1,900 | $1.32 | 8d | 1 | 0.54mi |
| 6306 Pilgrim Ln Arlington, TX | 3.0 | 2.0 | 1197 | $1,885 | $1.57 | 45d | 1 | 0.55mi |
| 327 Moss Hill Dr Arlington, TX | 3.0 | 2.0 | 1575 | $2,079 | $1.32 | 45d | 1 | 0.56mi |
| 323 Moss Hill Dr Arlington, TX | 3.0 | 2.0 | 1053 | $1,900 | $1.80 | 8d | 1 | 0.58mi |
| 6516 Fairglen Dr Arlington, TX | 3.0 | 2.0 | 1789 | $3,000 | $1.68 | 0d | 1 | 0.70mi |
| 706 Langford Dr Arlington, TX | 3.0 | 2.0 | 1651 | $2,285 | $1.38 | 0d | 1 | 0.71mi |
| 318 Spanish Moss Dr Arlington, TX | 3.0 | 2.5 | 1600 | $2,050 | $1.28 | 45d | 1 | 0.75mi |
| 216 Caprock Dr Arlington, TX | 3.0 | 2.0 | 1211 | $1,850 | $1.53 | 18d | 1 | 0.76mi |
| 216 Caprock Dr Arlington, TX | 3.0 | 2.0 | 1211 | $1,850 | $1.53 | 5d | 1 | 0.76mi |
| 101 Colony Dr Arlington, TX | 3.0 | 2.0 | 1400 | $2,055 | $1.47 | 45d | 1 | 0.79mi |
| 6707 Classen Trl Arlington, TX | 3.0 | 2.0 | 1777 | $2,600 | $1.46 | 45d | 1 | 0.84mi |
| 6406 Brookglen Dr Arlington, TX | 3.0 | 2.0 | 1320 | $2,185 | $1.66 | 45d | 1 | 0.85mi |
| 734 Bonnet Trl Arlington, TX | 2.0 | 2.5 | 1636 | $2,199 | $1.34 | 23d | 1 | 0.91mi |
| 222 Mahogany Dr Arlington, TX | 3.0 | 2.0 | 1421 | $2,160 | $1.52 | 18d | 1 | 0.91mi |
| 6323 Brookbriar Ct Arlington, TX | 3.0 | 2.0 | 1575 | $2,727 | $1.73 | 46d | 1 | 0.91mi |
| 6323 Brookbriar Ct Arlington, TX | 3.0 | 2.0 | 1575 | $3,312 | $2.10 | 23d | 1 | 0.91mi |
| 529 Nightshade Dr Arlington, TX | 3.0 | 2.0 | 1208 | $1,950 | $1.61 | 45d | 1 | 0.93mi |
| 529 Nightshade Dr Arlington, TX | 3.0 | 2.0 | 1208 | $1,950 | $1.61 | 0d | 1 | 0.93mi |
| 746 Bonnet Trl Arlington, TX | 2.0 | 2.0 | 1416 | $2,175 | $1.54 | 26d | 1 | 0.96mi |
| 5907 Lovingham Ct Unit 5907 Arlington, TX | 3.0 | 2.0 | 1200 | $2,050 | $1.71 | 45d | 1 | 0.97mi |
| 6463 Blue Trl Arlington, TX | 3.0 | 2.5 | 1661 | $2,399 | $1.44 | 23d | 1 | 0.97mi |
| 760 Bonnet Trl Arlington, TX | 3.0 | 2.5 | 1624 | $2,349 | $1.45 | 23d | 1 | 0.99mi |
Listing history 11 events
-
2026-06-02status $130,000 Pending 10 DOM
-
2026-06-01days on market $130,000 Active 10 DOM
-
2026-05-31days on market $130,000 Active 9 DOM
-
2026-05-22$130,000 Active
-
2026-04-03historical $2,049
-
2026-03-25$2,049
-
2019-04-29soldstatus
-
2019-04-26soldstatus Sold 343-char remark
Show marketing remark (343 chars)
Home features 3 bedrooms, 2 baths and 2 car garage. Nice floor plan that is open for entertaining with large family room and good sized kitchen. New roof , flooring and fresh paint. Home is located close by schools and has easy access to I-20 for all the shopping and a large number of restaurants in the Highlands and Parks Mall of Arlington.
-
2019-04-22status Pending 343-char remark
Show marketing remark (343 chars)
Home features 3 bedrooms, 2 baths and 2 car garage. Nice floor plan that is open for entertaining with large family room and good sized kitchen. New roof , flooring and fresh paint. Home is located close by schools and has easy access to I-20 for all the shopping and a large number of restaurants in the Highlands and Parks Mall of Arlington.
-
2019-04-05historical Active Option Contract 343-char remark
Show marketing remark (343 chars)
Home features 3 bedrooms, 2 baths and 2 car garage. Nice floor plan that is open for entertaining with large family room and good sized kitchen. New roof , flooring and fresh paint. Home is located close by schools and has easy access to I-20 for all the shopping and a large number of restaurants in the Highlands and Parks Mall of Arlington.
-
2019-04-02$175,000 Active 343-char remark
Show marketing remark (343 chars)
Home features 3 bedrooms, 2 baths and 2 car garage. Nice floor plan that is open for entertaining with large family room and good sized kitchen. New roof , flooring and fresh paint. Home is located close by schools and has easy access to I-20 for all the shopping and a large number of restaurants in the Highlands and Parks Mall of Arlington.
ⓘ Source: listings_history table (triggers on properties + properties_extension) + one-shot
backfill from property_details.listing_events for pre-trigger history.
Tax reassessment forecast TX · Resets to sale price
- Current annual tax
- $5,700 · $475/mo
- Projected year-2 tax
- $5,700 · $475/mo
- Expected delta
- $0/yr ($0/mo · 0.0%)
ⓘ Screening estimate from a state-policy table — verify with the county assessor before closing.
Climate risk First Street
- Flood 1/10 Low FEMA zone X (unshaded) · 0% chance over 30 yrs
- Wildfire 4/10 Moderate
- Heat 7/10 Severe 7 d/yr ≥110°F today · 23 d/yr by 30 yrs out
- Wind 6/10 Major 27% chance of damaging wind over 30 yrs
- Air quality 3/10 Moderate 2 unhealthy d/yr today · 3 by 30 yrs out
Nearby sold comps map
Loading sold comps map…
Walkable amenities ~0.75 mi
Loading nearby amenities…
Taxation est. · year 1
- Rental income
- $27,053
- − Mortgage interest
- −$7,282
- − Property taxes
- −$5,700
- − Insurance
- −$650
- − Repairs & maintenance
- −$2,164
- − Management
- −$2,164
- − Depreciation
- −$3,782
- Taxable income
- $5,310
- Est. tax owed @ 24.0%
- −$1,274
- After-tax cash flow
- $5,566/yr
For passive investors: Depreciation is non-cash, so a rental often shows a tax loss while cash-flowing — sheltering income. Rental losses are passive: they offset passive income freely, and up to $25,000/yr can offset ordinary (W-2) income if you actively participate and your MAGI is under $100k (phasing out to $0 by $150k); unused losses carry forward. On sale, claimed depreciation is recaptured at up to 25%, and gains may owe capital-gains tax (a 1031 exchange can defer both). Figures are a year-1 estimate at your 24.0% rate — not tax advice; consult a CPA.
Schools (NCES district)
- District
- Arlington ISD
- NCES district ID
- 4808700
- Math proficiency
- 24% ▼ -21.00%
- Reading proficiency
- 34% ▼ -8.00%
- Median HH income
- $50,873
- Composite
- 25.42/100
- National rank
- #7458
- State rank
- #629 of 826 in TX
Livability — Arlington
- Score
- 78/100
- State rank
- #75
- US rank
- #2697
Category grades
Schools grade is shown separately in the Schools card above.
Census & demographics
- Census place
- Arlington, TX
- County
- Tarrant County · 2,033,669 people
- City population
- 366,588
- Metro
- Dallas-Fort Worth-Arlington, TX
- Population (ZIP)
- 26,834
- Household income
- $88,288
- Rent vs Own
- Severe rent burden
- 598.0
Population outlook (Tarrant County) Hauer SSP2
- Today (2025)
- 2,380,417 people
- By 2030
- 2,578,900 · +8.3%
- By 2040
- 2,974,995 · +25.0%
- By 2050
- 3,350,489 · +40.8%
- By 2075
- 4,216,909 · +77.2%
- By 2100
- 4,741,527 · +99.2%
Race, ethnicity, and origin ACS 2023
- Neighborhood character
- Highly diverse neighborhood (Simpson 0.76)
- Race & ethnicity
- Hispanic / Latino 34% Black 24% White 23% Asian 14% Two or more races 14% Native American 2%
- Hispanic origin (detail)
- Mexican 26%
- Common ancestry
- Slovak 1% Romanian 1% Lithuanian 0%
- Foreign-born
- 20% · Canada, Vietnam
- Languages at home
- 62% English-only · Spanish 22% Vietnamese 11% French/Haitian/Cajun 1%
Political lean MEDSL · Tarrant
- 2024 margin
- Lean R (+5.1) · D 46.7% · R 51.9% · Other 1.4%
- 2008→2024 swing
- +6.6pp toward D · 2008: -11.7pp · 2024: -5.1pp
- All cycles
- 2024: R+5.1 2020: D+0.2 2016: R+8.7 2012: R+15.7 2008: R+11.7
Not yet ingested
- Civics
- —
Market trends
- HPI YoY
- ▼ -8.64%
- Current HPI
- 296.8765
- Rent YoY
- ▲ 1.39%
- Metro
- Dallas-Fort Worth-Arlington, TX
- State GDP YoY
- ▲ 3.95%
- F500 in state
- 110
Industry mix (Fortune 500 HQ in TX)
| Industry | F500 HQs | Revenue |
|---|---|---|
| Energy | 16 | $1,198B |
|
||
| Technology | 5 | $198B |
|
||
| Engineering / Construction | 4 | $72B |
|
||
| Energy Services | 3 | $60B |
|
||
| Utilities | 3 | $41B |
|
||
| Healthcare | 2 | $330B |
|
||
Price history
-25.7% since first listed8 events — show timeline
- 2026-05-22 Listed $130,000 NTREIS
- 2026-04-03 Rental Removed $2,049 Tricon
- 2026-03-25 Listed for Rent $2,049 Tricon
- 2019-04-29 Sold (Public Records) — Public Records
- 2019-04-26 Sold (MLS) — NTREIS
- 2019-04-22 Pending — NTREIS
- 2019-04-05 Contingent — NTREIS
- 2019-04-02 Listed $175,000 NTREIS
Property tax history
+5.3%/yrLatest (2025): $5,700 · -10.7% YoY. Source: county tax records.
Cash-flow waterfall
monthlySold comps — $/sqft
last 12 mo · ≤1 miLoading sold comps…