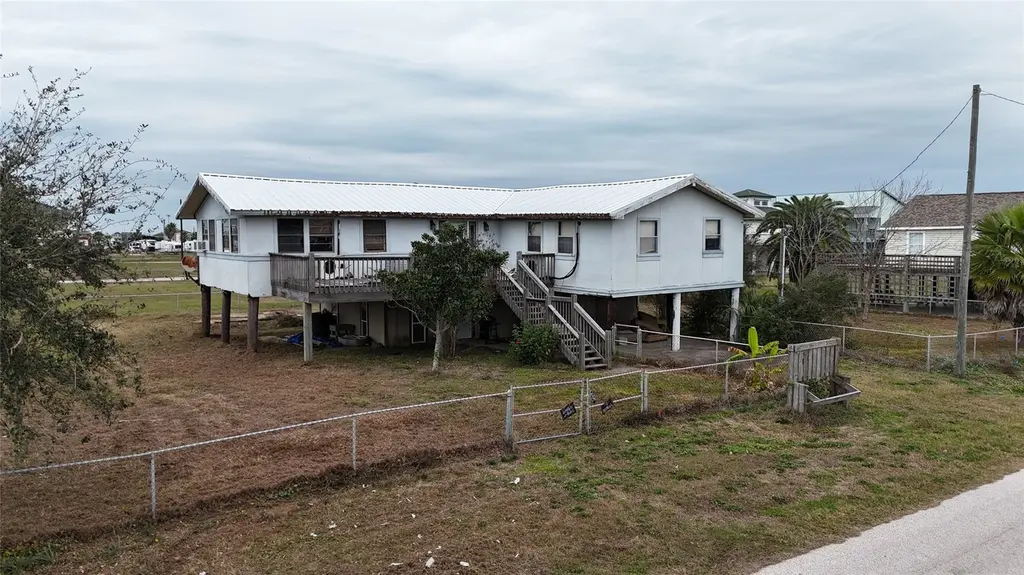
963 Gulfview Dr · Bolivar Peninsula, TX
Flood risk 9/10 · Severe
- FEMA flood zone
- VE
- Chance of flooding over 30 yrs
- 0.99%
- Est. flood insurance / yr
- $5,013 – $11,043
Fire risk 2/10 · Minimal
- Est. fire insurance / yr
- $1,222 – $2,270
Heat risk 10/10 · Severe
- Hot days now (above 107°F)
- 7 days/yr
- Hot days in 30 yrs
- 27 days/yr
Wind risk 10/10 · Severe
- Chance of severe wind over 30 yrs
- 99.0%
Air-quality risk 2/10 · Minimal
- Unhealthy air days now
- 2 days/yr
- Unhealthy air days in 30 yrs
- 2 days/yr
Risk factors via First Street. Map © Google.
Why this score? — see what drove the B grade
The composite is a weighted blend of 9 inputs, each scored 0–100. Each bar is that input's sub-score; the figure is the points it added to the 100-point composite (weight × sub-score).
- Cash flow +30.0/30.0
- 1% rule +10.0/10.0
- DSCR +10.0/10.0
- ARV discount +7.5/15.0
- Livability +3.2/5.0
- Schools +3.0/10.0
- Appreciation +2.7/10.0
- Rent growth +2.5/5.0
- Condition / age +2.5/5.0
$195,000
🖨 Deal sheet 📄 Offer letter ✓ Due diligence
Listing remarks MLS
This is not your typical beach home—this is a rare opportunity wrapped in potential and priced at lot value only. Sitting on THREE lots just a short walk or bike ride from the beach, this “handyman’s special” is your blank canvas in a rapidly growing coastal area. The existing 2,000+ sq ft elevated home features a metal roof, two oversized primary bedrooms, two en-suite baths, plus a third full bath—offering plenty of space for a bold renovation or a complete reimagining. Restore it into a unique beach retreat, rental income producer, or tear it down and unlock the full value by building up to three new homes. Whether your vision is one standout coastal escape or multiple new builds, the possibilities here are undeniable. Opportunities like this—near the beach, multiple lots, priced to sell—do not come around often. Property is being sold AS IS, WHERE IS—bring your imagination, your plans, and your contractor.
Key facts
- Metal roof
- En suite baths
- Three lots
Tags
Neighborhood map
What this means for you Summary
Snapshot
- This is a 2-bed/2.5-bath single-family listed at $195k.
Deal economics
- At list price, monthly cash flow is $123 ($1k/yr) — positive.
- The deal already cash-flows at list — no discount required.
- Meets the 1% rule at list price ($3k rent vs $195k).
- Recommended offer: $172k (12.0% below list) — sets the bar for market timing.
- Cap rate 11.2% vs local median 2.1% in Bolivar Peninsula — top-decile yield for the area; either an underpriced asset or a hidden risk that comps aren't pricing in. Stress-test before assuming the spread holds.
Location & tenants
- Location reads 65/100 on livability (#719 in TX) — a middle-class / working-renter tenant base. Strengths: crime A+, cost of living A+, housing A+; Watch: schools D+, amenities F, commute F.
- Galveston ISD (town): math 33% / reading 39% proficiency, ranked #514 of 826 in TX (top 62%) — families likely to look elsewhere, expect single-tenant / working-renter base with shorter leases; 68% free/reduced lunch — lower-income household profile, screen leases tightly.
- Market conditions: 770 active listings in the ZIP; 2 comparable units currently listed for rent nearby; 3,258 units permitted in Galveston County in 2024 (0 in 5+ unit buildings).
Forward outlook
- Local home prices are declining (-3.0%/yr); year-one equity from $1k of loan paydown is wiped out by about $6k of value loss. Plan a longer hold.
- Galveston County population projected at +43% by 2050 — long-run rental-demand tailwind backs the buy-and-hold thesis.
Negotiation context
- It's been on market 154 days — a 12% lower offer ($172k) is reasonable based on typical stale-listing flexibility.
- 2 sale attempts since 3y ago with the ask held roughly flat each time — persistent listings suggest the price (not the market) is what's stuck; bring a comps-based counter.
Risks & watch-outs
- Watch-outs: property tax is 3.7% of price; flood insurance adds $669/mo.
- Climate carrying-cost: in FEMA flood zone VE (mandatory federal flood insurance); severe wind risk, 99% chance of damaging wind over 30y; extreme-heat days projected 7→27/yr by 2055 (HVAC capex compounding) — expect insurance premiums to compound above CPI over the hold.
Questions for the listing agent
- It's been on market 154 days. Have you received any prior offers? Is the seller open to a 12% concession, seller financing, or rate buy-down credit?
- Built in 1970 — when were the roof, HVAC, electrical panel, plumbing, and water heater last replaced?
- Property tax is high relative to price — has the assessment been appealed recently, and will the sale trigger a re-assessment?
- What's the actual annual flood-insurance premium (NFIP or private), and is the property in a SFHA with mandatory coverage?
- Why hasn't it sold? Are there any deal-killer items the seller is aware of (foundation, flood, title, zoning, code violations)?
- Is there a deadline driving the sale (1031 exchange, divorce, estate, relocation)? That informs how much negotiation room exists.
- Schools are D-rated, which usually means shorter tenancies and higher turnover. Who's the typical renter profile here, and what's been the actual vacancy rate?
- What's the average days-on-market for RENTAL listings here right now (not sales)? A rising rental-DOM trend means longer vacancies and softer asking-rent achievability than the comps imply.
- What's the recent tenant-quality profile in this submarket — average credit score on applications, eviction rate, late-payment / NSF rate, and stable-employment percentage? A property-management company in the area should have these aggregated.
- How much new for-sale + rental construction is in the pipeline within 1–3 miles? Heavy new supply typically softens prices + rents 12–24 months out; constrained supply supports both.
Investment metrics
- 1% rule
- 1.62% ✓
- Cap rate
- 11.17%
- Cash-on-cash
- 17.41%
- DSCR
- 1.77
- GRM
- 5.2
CMA / ARV
- ARV (median comp)
- $513,473
- List price
- $195,000
- Delta
- -62.02%
- Verdict
- UNDERPRICED
- Comps
- 20 within 1.0 mi
Show comp detail 6 sales within ~0.75 mi
| Address | Dist | Beds/Ba | Sqft | Sold | Price | $/sf | Match |
|---|---|---|---|---|---|---|---|
| 1200 Waterways Dr | 0.73mi | 3/2.0 (+1) | 2,149 (-1%) | 5mo | $699,500 | $326 | 53 |
| 1150 Waterview Ln | 0.44mi | 3/2.0 (+1) | 1,944 (-11%) | 4mo | $585,000 | $301 | 51 |
| 1101 Fountain View Dr | 0.53mi | 3/3.0 (+1) | 1,925 (-12%) | 2mo | $749,000 | $389 | 47 |
| 1100 Lagoon Dr | 0.47mi | 3/2.0 (+1) | 1,960 (-10%) | 13mo | $529,900 | $270 | 43 |
| 1190 Lagoon Dr | 0.65mi | 3/3.0 (+1) | 2,060 (-5%) | 22mo | $569,999 | $277 | 35 |
| 1205 Lagoon Dr | 0.68mi | 3/3.0 (+1) | 2,389 (+10%) | 20mo | $949,900 | $398 | 29 |
Match score weights: distance 35% · size 25% · config 20% · recency 20%. Top-matched comps best support the ARV.
Projected returns pro-forma
-3.0% appreciation · 3.0% rent growth · sell at horizon
- IRR
- -11.6%
- Equity multiple
- 0.58×
- Total profit
- $-23,086
- Equity at exit
- $29,075
- IRR
- -1.9%
- Equity multiple
- 0.87×
- Total profit
- $-7,272
- Equity at exit
- $16,860
Cash invested: $54,600 (down + closing). Projections, not guarantees.
Landlord ↔ Tenant lean methodology
- Overall (STATE)
- 87 Strongly Landlord-Friendly
- State Texas
- 87 Strongly Landlord-Friendly · R+5
- County
- — inherits STATE
- City
- — inherits STATE
ZIP-level market 77650
- Home prices YoY
- -1.9%
- Active inventory
- 770
- Price-to-rent
- 5.2×
Monthly cashflow live
- Estimated rent
- $3,152 medium interval (Pro) →
- Mortgage (P&I)
- −$1,023
- Tax from tax record
- −$594 /mo · $7,132/yr
- Insurance
- −$81
- Flood insurance flood zone
- −$669 /mo · $8,028/yr
- HOA
- −$0
- Vacancy / Maint / Mgmt
- −$662
- Net cashflow
- $123
Break-even live
UW: 25.0% down · 7.5% · 30yr · 1.5% tax · 5.0% vac · 8.0% maint · 8.0% mgmt
Financing live
Cash to close
- Down payment
- $48,750
- Closing costs
- $5,850
- Reserves months
- —
- Total cash needed
- —
Loan-product check · same deal, 3 products live
Conventional
25% down · 7.5% · 30yr
- Down + closing
- —
- Monthly P&I
- —
- Monthly cashflow
- —
- DSCR
- —
- Eligible?
- —
Personal DTI + credit; lowest rate.
DSCR
20% down · 8.5% · 30yr
- Down + closing
- —
- Monthly P&I
- —
- Monthly cashflow
- —
- DSCR
- —
- Eligible?
- —
No personal income docs; deal must DSCR.
Hard money
10% down · 12.0% · 12mo
- Down + closing
- —
- Monthly P&I
- —
- Monthly cashflow
- —
- DSCR
- —
- Eligible?
- —
Short-term bridge; refi at stabilization.
Rent comps 2 comps
| Address | Beds | Baths | Sqft | Rent | $/sqft | DOM | Units | Dist |
|---|---|---|---|---|---|---|---|---|
| 820 Sandollar Unit 1351282P Crystal Beach, TX | 3.0 | 2.0 | 1539 | $3,189 | $2.07 | 7d | 1 | 0.39mi |
| 887 O'Neil Rd Port Bolivar, TX | 3.0 | 2.5 | 1744 | $3,100 | $1.78 | 10d | 1 | 0.63mi |
Listing history 20 events
-
2026-06-18days on market $195,000 Active 154 DOM
-
2026-06-17days on market $195,000 Active 153 DOM
-
2026-06-16days on market $195,000 Active 152 DOM
-
2026-06-15days on market $195,000 Active 151 DOM
-
2026-06-13days on market $195,000 Active 149 DOM
-
2026-06-09days on market $195,000 Active 145 DOM
-
2026-06-08days on market $195,000 Active 144 DOM
-
2026-06-07days on market $195,000 Active 143 DOM
-
2026-06-04days on market $195,000 Active 140 DOM
-
2026-06-03days on market $195,000 Active 139 DOM
-
2026-06-02days on market $195,000 Active 138 DOM
-
2026-06-01days on market $195,000 Active 137 DOM
-
2026-05-31days on market $195,000 Active 136 DOM
-
2026-01-15$195,000 Active 971-char remark
Show marketing remark (971 chars)
This is not your typical beach home—this is a rare opportunity wrapped in potential and priced at lot value only. Sitting on THREE lots just a short walk or bike ride from the beach, this “handyman’s special” is your blank canvas in a rapidly growing coastal area. The existing 2,000+ sq ft elevated home features a metal roof, two oversized primary bedrooms, two en-suite baths, plus a third full bath—offering plenty of space for a bold renovation or a complete reimagining. Restore it into a unique beach retreat, rental income producer, or tear it down and unlock the full value by building up to three new homes. Whether your vision is one standout coastal escape or multiple new builds, the possibilities here are undeniable. Opportunities like this—near the beach, multiple lots, priced to sell—do not come around often. Property is being sold AS IS, WHERE IS—bring your imagination, your plans, and your contractor.
-
2023-10-13soldstatus Sold 390-char remark
Show marketing remark (390 chars)
Fantastic location in Emerald Beach Subdivision! Clear off this older, damaged home and rebuild your dream home! You'll have 3 lots in this purchase so plenty of space for other possibilities! This existing home may or may not be able to be renovated. This property is in the heart of Crystal Beach and the growth here is booming! Come see the opportunities this 3-lot property has for you!
-
2023-10-13soldstatus
Show marketing remark (390 chars)
Fantastic location in Emerald Beach Subdivision! Clear off this older, damaged home and rebuild your dream home! You'll have 3 lots in this purchase so plenty of space for other possibilities! This existing home may or may not be able to be renovated. This property is in the heart of Crystal Beach and the growth here is booming! Come see the opportunities this 3-lot property has for you!
-
2023-10-12status Pending 390-char remark
Show marketing remark (390 chars)
Fantastic location in Emerald Beach Subdivision! Clear off this older, damaged home and rebuild your dream home! You'll have 3 lots in this purchase so plenty of space for other possibilities! This existing home may or may not be able to be renovated. This property is in the heart of Crystal Beach and the growth here is booming! Come see the opportunities this 3-lot property has for you!
-
2023-09-29status Option Pending 390-char remark
Show marketing remark (390 chars)
Fantastic location in Emerald Beach Subdivision! Clear off this older, damaged home and rebuild your dream home! You'll have 3 lots in this purchase so plenty of space for other possibilities! This existing home may or may not be able to be renovated. This property is in the heart of Crystal Beach and the growth here is booming! Come see the opportunities this 3-lot property has for you!
-
2023-06-23$289,900 Active 390-char remark
Show marketing remark (390 chars)
Fantastic location in Emerald Beach Subdivision! Clear off this older, damaged home and rebuild your dream home! You'll have 3 lots in this purchase so plenty of space for other possibilities! This existing home may or may not be able to be renovated. This property is in the heart of Crystal Beach and the growth here is booming! Come see the opportunities this 3-lot property has for you!
-
1993-09-07soldstatus
ⓘ Source: listings_history table (triggers on properties + properties_extension) + one-shot
backfill from property_details.listing_events for pre-trigger history.
Tax reassessment forecast TX · Resets to sale price
- Current annual tax
- $7,132 · $594/mo
- Projected year-2 tax
- $7,132 · $594/mo
- Expected delta
- $0/yr ($0/mo · 0.0%)
ⓘ Screening estimate from a state-policy table — verify with the county assessor before closing.
Climate risk First Street
- Flood 9/10 Extreme FEMA zone VE · 99% chance over 30 yrs
- Wildfire 2/10 Low
- Heat 10/10 Extreme 7 d/yr ≥107°F today · 27 d/yr by 30 yrs out
- Wind 10/10 Extreme 99% chance of damaging wind over 30 yrs
- Air quality 2/10 Low 2 unhealthy d/yr today · 2 by 30 yrs out
Nearby sold comps map
Loading sold comps map…
Walkable amenities ~0.75 mi
Loading nearby amenities…
Taxation est. · year 1
- Rental income
- $37,827
- − Mortgage interest
- −$10,923
- − Property taxes
- −$7,132
- − Insurance
- −$9,003
- − Repairs & maintenance
- −$3,026
- − Management
- −$3,026
- − Depreciation
- −$5,673
- Taxable loss
- −$956
- Est. tax savings @ 24.0%
- +$230
- After-tax cash flow
- $1,706/yr
For passive investors: Depreciation is non-cash, so a rental often shows a tax loss while cash-flowing — sheltering income. Rental losses are passive: they offset passive income freely, and up to $25,000/yr can offset ordinary (W-2) income if you actively participate and your MAGI is under $100k (phasing out to $0 by $150k); unused losses carry forward. On sale, claimed depreciation is recaptured at up to 25%, and gains may owe capital-gains tax (a 1031 exchange can defer both). Figures are a year-1 estimate at your 24.0% rate — not tax advice; consult a CPA.
Schools (NCES district)
- District
- Galveston ISD
- NCES district ID
- 4820280
- Math proficiency
- 33% ▼ -14.00%
- Reading proficiency
- 39% ▼ -4.00%
- Median HH income
- $40,162
- Composite
- 30.22/100
- National rank
- #6299
- State rank
- #514 of 826 in TX
Livability — Bolivar Peninsula
- Score
- 65/100
- State rank
- #719
- US rank
- #13437
Category grades
Schools grade is shown separately in the Schools card above.
Census & demographics
- Census place
- Bolivar Peninsula, TX
- City population
- 2,957
- Population (ZIP)
- 2,362
Population outlook (Galveston County) Hauer SSP2
- Today (2025)
- 390,640 people
- By 2030
- 425,226 · +8.9%
- By 2040
- 493,765 · +26.4%
- By 2050
- 559,698 · +43.3%
- By 2075
- 719,260 · +84.1%
- By 2100
- 819,628 · +109.8%
Race, ethnicity, and origin ACS 2023
- Neighborhood character
- Predominantly White (70%)
- Race & ethnicity
- White 70% Hispanic / Latino 21% Two or more races 10% Black 8%
- Hispanic origin (detail)
- Mexican 14%
- Common ancestry
- Lithuanian 6% Romanian 3% Iranian 3%
- Foreign-born
- 13% · Canada
- Languages at home
- 85% English-only · Spanish 14% German/W. Germanic 1%
Political lean MEDSL · Galveston
- 2024 margin
- Strong R (+27.4) · D 35.7% · R 63.1% · Other 1.2%
- 2008→2024 swing
- -7.9pp toward R · 2008: -19.5pp · 2024: -27.4pp
- All cycles
- 2024: R+27.4 2020: R+22.6 2016: R+22.6 2012: R+26.9 2008: R+19.5
Not yet ingested
- Civics
- —
Market trends
- HPI YoY
- ▼ -4.52%
- Current HPI
- 231.5074
- Rent YoY
- —
- Metro
- —
- State GDP YoY
- ▲ 3.95%
- F500 in state
- 110
Industry mix (Fortune 500 HQ in TX)
| Industry | F500 HQs | Revenue |
|---|---|---|
| Energy | 16 | $1,198B |
|
||
| Technology | 5 | $198B |
|
||
| Engineering / Construction | 4 | $72B |
|
||
| Energy Services | 3 | $60B |
|
||
| Utilities | 3 | $41B |
|
||
| Healthcare | 2 | $330B |
|
||
Price history
-32.7% since first listed7 events — show timeline
- 2026-01-15 Listed $195,000 HARMLS
- 2023-10-13 Sold (Public Records) — Public Records
- 2023-10-13 Sold (MLS) — HARMLS
- 2023-10-12 Pending — HARMLS
- 2023-09-29 Pending — HARMLS
- 2023-06-23 Listed $289,900 HARMLS
- 1993-09-07 Sold (Public Records) — Public Records
Property tax history
+13.9%/yrLatest (2025): $7,132 · +1.8% YoY. Source: county tax records.
Cash-flow waterfall
monthlySold comps — $/sqft
last 12 mo · ≤1 miLoading sold comps…