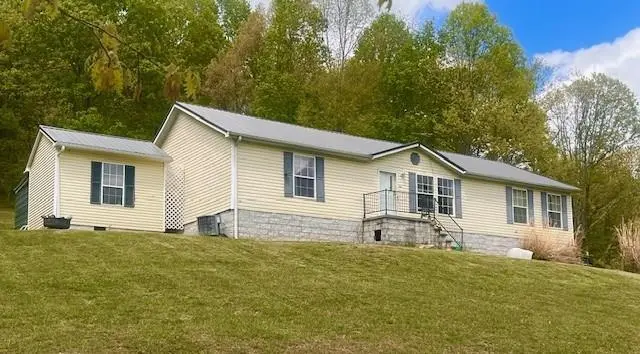
1677 Grapefield Rd · Bluefield, VA
Flood risk 1/10 · Minimal
- FEMA flood zone
- X (unshaded)
- Chance of flooding over 30 yrs
- 0.0%
- Est. flood insurance / yr
- $473 – $860
Fire risk 6/10 · Moderate
- Est. fire insurance / yr
- $666 – $1,236
Heat risk 2/10 · Minimal
- Hot days now (above 91°F)
- 8 days/yr
- Hot days in 30 yrs
- 23 days/yr
Wind risk 2/10 · Minimal
- Chance of severe wind over 30 yrs
- —
Air-quality risk 1/10 · Minimal
- Unhealthy air days now
- 0 days/yr
- Unhealthy air days in 30 yrs
- 0 days/yr
Risk factors via First Street. Map © Google.
Why this score? — see what drove the C+ grade
The composite is a weighted blend of 9 inputs, each scored 0–100. Each bar is that input's sub-score; the figure is the points it added to the 100-point composite (weight × sub-score).
- Cash flow +21.3/30.0
- Appreciation +7.8/10.0
- ARV discount +7.5/15.0
- DSCR +6.8/10.0
- Schools +6.0/10.0
- 1% rule +4.4/10.0
- Livability +3.1/5.0
- Rent growth +2.5/5.0
- Condition / age +2.5/5.0
$125,000
🖨 Deal sheet 📄 Offer letter ✓ Due diligence
Listing remarks
YOU WILL LOVE THE BEAUTIFUL COUNTRY SETTING OF THIS HOME WITH 3.04 ACRES!! PRIVACY WITH A VIEW!! INCLUDED ARE OTHER OUT BUILDINGS!! LOCATED WITHIN A FEW MILES OF TOWN OF TAZEWELL!! THIS ONE WANT LAST LONG!!
Key facts
- Privacy
- 3.04 acres
- Out buildings
Tags
Property features AI
Finance
- Other: Horses allowed; Approximately 3.04 acres
Exterior
- Security: Smoke detectors
- Utilities: Private well water; Septic tank
- Home design: Manufactured home; Single-story; Residential property; Zoned A1
- Construction: Vinyl siding; Metal roof; Unfinished basement
- Exterior features: Deck; Shed(s); Cleared lot
Interior
- Kitchen: Dishwasher; Refrigerator
- Flooring: Laminate flooring; Vinyl flooring
- Bathrooms: 2 full bathrooms
- Heating & cooling: Central heating (electric, forced air); Central air; Ceiling fans
- Interior features: Insulated windows; Wood-burning fireplace
Neighborhood map
What this means for you Summary
Snapshot
- This is a 3-bed/2.0-bath manufactured listed at $125k.
Deal economics
- At list price, monthly cash flow is $184 ($2k/yr) — positive.
- The deal already cash-flows at list — no discount required.
- To meet the 1% rule (rent ≥ 1% of price), the offer needs to be $118k (5.7% below list).
- Recommended offer: $118k (5.7% below list) — sets the bar for 1% rule.
- Cap rate 8.1% vs local median 4.1% in Bluefield — top-decile yield for the area; either an underpriced asset or a hidden risk that comps aren't pricing in. Stress-test before assuming the spread holds.
Location & tenants
- Location reads 62/100 on livability (#408 in VA) — a middle-class / working-renter tenant base. Strengths: cost of living A+, housing A+, crime B; Watch: employment C-, amenities F, commute F.
- Bland County Public School District (rural): math 62% / reading 80% proficiency, ranked #23 of 131 in VA (top 18%) — strong family-tenant draw, lease renewals of 3-5y typical.
- Zoned schools: Bland County Elementary (math 57% / reading 72%, grade B, #416 of 1,108 statewide, top 41%, 371 students, 67% FRL); Bland County High (math 62% / reading 87%, grade B+, #107 of 319 statewide, top 37%, 425 students, 68% FRL) — zoned schools average 67% FRL vs 32% district-wide (35 pts higher); higher-poverty schools than district average — tighter screening recommended.
- Market conditions: 14 active listings in the ZIP; 8 units permitted in Bland County in 2024 (0 in 5+ unit buildings).
Forward outlook
- In year one you build about $8k of equity ($864 loan paydown + $7k appreciation (5.6% local appreciation)).
- Bland County population projected at -20% by 2050 — secular population decline; favor cash flow + early exit over multi-decade hold.
- At projected returns (5.6% appreciation + 3.0% rent growth), your $35k cash investment doubles in ~4 years — after that, you're playing with house money.
- By year 5, paydown + projected appreciation supports a ~$34k cash-out refi (75% LTV) — recoverable capital for the next deal without selling this one.
Negotiation context
- It's been on market 38 days — a 3% lower offer ($121k) is reasonable based on typical stale-listing flexibility.
Risks & watch-outs
- Climate carrying-cost: major wildfire risk — expect insurance premiums to compound above CPI over the hold.
Questions for the listing agent
- It's been on market 38 days. Have you received any prior offers? Is the seller open to a 6% concession, seller financing, or rate buy-down credit?
- Is there a deadline driving the sale (1031 exchange, divorce, estate, relocation)? That informs how much negotiation room exists.
- Schools are A-rated — typically a magnet for longer-tenancy family renters. What's the average tenant stay here, and is there a school-zone premium baked into asking?
- What's the average days-on-market for RENTAL listings here right now (not sales)? A rising rental-DOM trend means longer vacancies and softer asking-rent achievability than the comps imply.
- What's the recent tenant-quality profile in this submarket — average credit score on applications, eviction rate, late-payment / NSF rate, and stable-employment percentage? A property-management company in the area should have these aggregated.
- How much new for-sale + rental construction is in the pipeline within 1–3 miles? Heavy new supply typically softens prices + rents 12–24 months out; constrained supply supports both.
Investment metrics
- 1% rule
- 0.94% ✗
- Cap rate
- 8.06%
- Cash-on-cash
- 6.31%
- DSCR
- 1.28
- GRM
- 8.8
CMA / ARV
No comps found within radius.
Projected returns pro-forma
5.6% appreciation · 3.0% rent growth · sell at horizon
- IRR
- 19.6%
- Equity multiple
- 2.28×
- Total profit
- $44,782
- Equity at exit
- $75,421
- IRR
- 19.1%
- Equity multiple
- 4.52×
- Total profit
- $123,302
- Equity at exit
- $134,125
Cash invested: $35,000 (down + closing). Projections, not guarantees.
Landlord ↔ Tenant lean methodology
- Overall (STATE)
- 55 Moderately Landlord-Leaning
- State Virginia
- 55 Moderately Landlord-Leaning · D+2
- County
- — inherits STATE
- City
- — inherits STATE
ZIP-level market 24314
- Home prices YoY
- 3.1%
- Active inventory
- 14
- Price-to-rent
- 8.8×
Monthly cashflow live
- Estimated rent
- $1,179 medium interval (Pro) →
- Mortgage (P&I)
- −$656
- Tax from tax record
- −$40 /mo · $482/yr
- Insurance
- −$52
- HOA
- −$0
- Vacancy / Maint / Mgmt
- −$248
- Net cashflow
- $184
Break-even live
UW: 25.0% down · 7.5% · 30yr · 1.5% tax · 5.0% vac · 8.0% maint · 8.0% mgmt
Financing live
Cash to close
- Down payment
- $31,250
- Closing costs
- $3,750
- Reserves months
- —
- Total cash needed
- —
Loan-product check · same deal, 3 products live
Conventional
25% down · 7.5% · 30yr
- Down + closing
- —
- Monthly P&I
- —
- Monthly cashflow
- —
- DSCR
- —
- Eligible?
- —
Personal DTI + credit; lowest rate.
DSCR
20% down · 8.5% · 30yr
- Down + closing
- —
- Monthly P&I
- —
- Monthly cashflow
- —
- DSCR
- —
- Eligible?
- —
No personal income docs; deal must DSCR.
Hard money
10% down · 12.0% · 12mo
- Down + closing
- —
- Monthly P&I
- —
- Monthly cashflow
- —
- DSCR
- —
- Eligible?
- —
Short-term bridge; refi at stabilization.
Listing history 11 events
-
2026-06-12status $125,000 Pending 38 DOM
-
2026-06-09days on market $125,000 Active 38 DOM
-
2026-06-08days on market $125,000 Active 37 DOM
-
2026-06-07pricedays on market $125,000 Active 36 DOM
-
2026-06-05days on market $172,000 Active 33 DOM
-
2026-06-03days on market $172,000 Active 32 DOM
-
2026-06-02days on market $172,000 Active 31 DOM
-
2026-06-01days on market $172,000 Active 30 DOM
-
2026-05-31days on market $172,000 Active 29 DOM
-
2026-05-30days on market $172,000 Active 28 DOM
-
2026-04-30$172,000 Active 206-char remark
ⓘ Source: listings_history table (triggers on properties + properties_extension) + one-shot
backfill from property_details.listing_events for pre-trigger history.
Tax reassessment forecast VA · Resets to sale price
- Current annual tax
- $482 · $40/mo
- Projected year-2 tax
- $1,025 · $85/mo
- Expected delta
- +$543/yr (+$45/mo · 112.7%)
ⓘ Screening estimate from a state-policy table — verify with the county assessor before closing.
Climate risk First Street
- Flood 1/10 Low FEMA zone X (unshaded) · 0% chance over 30 yrs
- Wildfire 6/10 Major
- Heat 2/10 Low 8 d/yr ≥91°F today · 23 d/yr by 30 yrs out
- Wind 2/10 Low
- Air quality 1/10 Low 0 unhealthy d/yr today · 0 by 30 yrs out
Nearby sold comps map
Loading sold comps map…
Walkable amenities ~0.75 mi
Loading nearby amenities…
Taxation est. · year 1
- Rental income
- $14,152
- − Mortgage interest
- −$7,002
- − Property taxes
- −$482
- − Insurance
- −$625
- − Repairs & maintenance
- −$1,132
- − Management
- −$1,132
- − Depreciation
- −$3,636
- Taxable income
- $143
- Est. tax owed @ 24.0%
- −$34
- After-tax cash flow
- $2,173/yr
For passive investors: Depreciation is non-cash, so a rental often shows a tax loss while cash-flowing — sheltering income. Rental losses are passive: they offset passive income freely, and up to $25,000/yr can offset ordinary (W-2) income if you actively participate and your MAGI is under $100k (phasing out to $0 by $150k); unused losses carry forward. On sale, claimed depreciation is recaptured at up to 25%, and gains may owe capital-gains tax (a 1031 exchange can defer both). Figures are a year-1 estimate at your 24.0% rate — not tax advice; consult a CPA.
Schools (NCES district)
- District
- Bland County Public School District
- NCES district ID
- 5100390
- Math proficiency
- 62% ▼ -25.00%
- Reading proficiency
- 80% ▬ 0.00%
- Median HH income
- $44,048
- Composite
- 59.56/100
- National rank
- #917
- State rank
- #23 of 131 in VA
Livability — Bluefield
- Score
- 62/100
- State rank
- #408
- US rank
- #17014
Category grades
Schools grade is shown separately in the Schools card above.
Census & demographics
- Population (ZIP)
- 1,353
Population outlook (Bland County) Hauer SSP2
- Today (2025)
- 6,172 people
- By 2030
- 5,928 · -4.0%
- By 2040
- 5,402 · -12.5%
- By 2050
- 4,926 · -20.2%
- By 2075
- 4,051 · -34.4%
- By 2100
- 3,028 · -50.9%
Race, ethnicity, and origin ACS 2023
- Neighborhood character
- Predominantly White (97%)
- Race & ethnicity
- White 97% Two or more races 2% Black 1%
- Common ancestry
- Lithuanian 4% Serbian 1% Slovak 1%
- Foreign-born
- 0%
- Languages at home
- 99% English-only · German/W. Germanic 1%
Political lean MEDSL · Bland
- 2024 margin
- Solid R (+69.7) · D 14.8% · R 84.5%
- 2008→2024 swing
- -30.3pp toward R · 2008: -39.4pp · 2024: -69.7pp
- All cycles
- 2024: R+69.7 2020: R+68.2 2016: R+67.8 2012: R+48.0 2008: R+39.4
Not yet ingested
- Civics
- —
Market trends
- HPI YoY
- ▲ 5.60%
- Current HPI
- 187.4763
- Rent YoY
- —
- Metro
- —
- State GDP YoY
- ▲ 2.40%
- F500 in state
- 50
Industry mix (Fortune 500 HQ in VA)
| Industry | F500 HQs | Revenue |
|---|---|---|
| Aerospace / Defense | 4 | $236B |
|
||
| Technology / Defense | 3 | $32B |
|
||
| Financial Services | 2 | $176B |
|
||
| Utilities | 2 | $27B |
|
||
| Insurance | 2 | $25B |
|
||
| Technology | 2 | $15B |
|
||
Price history
-27.3% since first listed3 events — show timeline
- 2026-06-09 Pending — SWVAR
- 2026-06-05 Price Changed $125,000 SWVAR
- 2026-04-30 Listed $172,000 SWVAR
Property tax history
-0.4%/yrLatest (2025): $482 · +0.0% YoY. Source: county tax records.
Cash-flow waterfall
monthlySold comps — $/sqft
last 12 mo · ≤1 miLoading sold comps…