 🏷️ Likely Rental
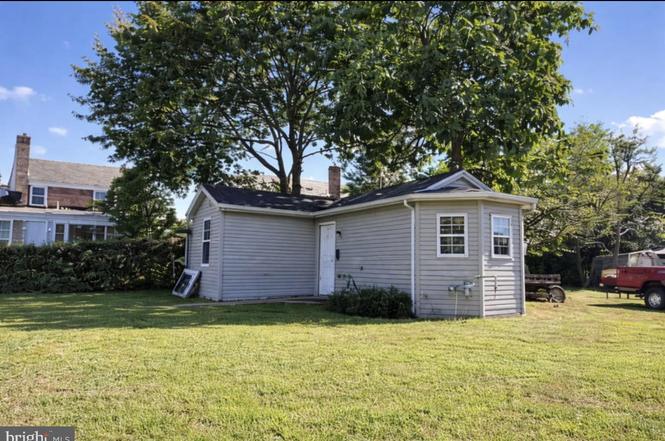
51 E Griffith St · Penns Grove, NJ
Flood risk 4/10 · Minor
- FEMA flood zone
- X (unshaded)
- Chance of flooding over 30 yrs
- 0.2%
- Est. flood insurance / yr
- $507 – $1,088
Fire risk 1/10 · Minimal
- Est. fire insurance / yr
- $526 – $976
Heat risk 8/10 · Major
- Hot days now (above 104°F)
- 7 days/yr
- Hot days in 30 yrs
- 15 days/yr
Wind risk 6/10 · Moderate
- Chance of severe wind over 30 yrs
- 27.0%
Air-quality risk 3/10 · Minor
- Unhealthy air days now
- 3 days/yr
- Unhealthy air days in 30 yrs
- 5 days/yr
Risk factors via First Street. Map © Google.
Why this score? — see what drove the B grade
The composite is a weighted blend of 9 inputs, each scored 0–100. Each bar is that input's sub-score; the figure is the points it added to the 100-point composite (weight × sub-score).
- Cash flow +30.0/30.0
- ARV discount +15.0/15.0
- DSCR +10.0/10.0
- 1% rule +8.8/10.0
- Livability +2.9/5.0
- Rent growth +2.5/5.0
- Condition / age +2.5/5.0
- Schools +1.2/10.0
- Appreciation +0.0/10.0
$110,000
🖨 Deal sheet (PDF) 📄 Offer letter ✓ Due diligence
Listing remarks
Investor special! This is a great opportunity to add a single-family rental to your portfolio with immediate income in place. The property is currently leased at $1,200 per month beginning March 1st, providing instant cash flow from day one. It was recently appraised at $140,000 on 2/1/26, offering added confidence in value. Whether you’re expanding your portfolio or purchasing your first investment property, this is a straightforward buy-and-hhold opportunity. Property is being sold strictly as-is, and the buyer will be responsible for any required certifications. Reach out today for more details.
Key facts
- 9,361 sq ft lot
- Built 1960
- Listed 71 days
Property features AI
Finance
- Other: Fee simple ownership
Exterior
- Parking: Driveway parking
- Utilities: Public water; Public sewer; Natural gas for heat and hot water
- Home design: Detached structure; Frame construction
- Construction: Frame construction; Permanent foundation; Above-grade and below-grade structures; Estimated year built
- Exterior features: Driveway
Interior
- Bedrooms: One bedroom on the main level
- Bathrooms: One full bathroom on the main level
- Heating & cooling: Wall unit heating; Natural gas heating and hot water
- Interior features: Estimated living area
Neighborhood map
What this means for you Summary
Snapshot
- This is a 1-bed/1.0-bath single-family listed at $110k.
Deal economics
- At list price, monthly cash flow is $413 ($5k/yr) — positive.
- The deal already cash-flows at list — no discount required.
- Meets the 1% rule at list price ($2k rent vs $110k).
- Recommended offer: $103k (6.0% below list) — sets the bar for market timing.
- Cap rate 10.8% vs local median 6.0% in Penns Grove — top-decile yield for the area; either an underpriced asset or a hidden risk that comps aren't pricing in. Stress-test before assuming the spread holds.
Location & tenants
- Location reads 57/100 on livability (#519 in NJ) — a working-class tenant base; expect higher turnover. Strengths: cost of living A, housing A-; Watch: crime F, amenities F, commute F.
- Penns Grove-Carneys Point Regional School District (suburban): math 6% / reading 21% proficiency, ranked #462 of 472 in NJ (top 98%) — low school quality limits family demand, transient renter base, plan for 1-2y turnover; 65% free/reduced lunch — lower-income household profile, screen leases tightly.
- Zoned schools: Field Street School (math 8% / reading 12%, grade F, #1,235 of 1,303 statewide, top 96%, 501 students, 72% FRL); Penns Grove Middle School (math 6% / reading 24%, grade F, #415 of 431 statewide, top 97%, 492 students, 73% FRL); Penns Grove High School (math 4% / reading 32%, grade F, #367 of 399 statewide, top 92%, 576 students, 60% FRL) — zoned schools at 68% FRL track the district average.
- Market conditions: 105 active listings in the ZIP; 95 units permitted in Salem County in 2024 (0 in 5+ unit buildings).
Forward outlook
- Local home prices are declining (-3.0%/yr); year-one equity from $761 of loan paydown is wiped out by about $3k of value loss. Plan a longer hold.
- Salem County population projected at -23% by 2050 — secular population decline; favor cash flow + early exit over multi-decade hold.
- At projected returns (-3.0% appreciation + 3.0% rent growth), your $31k cash investment doubles in ~8 years — after that, you're playing with house money.
Negotiation context
- It's been on market 71 days — a 6% lower offer ($103k) is reasonable based on typical stale-listing flexibility.
- 6 sale attempts since 6y ago with the ask held roughly flat each time — persistent listings suggest the price (not the market) is what's stuck; bring a comps-based counter.
- Current owner paid $55k; list at $110k implies a 100% gain — meaningful room to come down on a strong offer.
Risks & watch-outs
- Climate carrying-cost: major wind risk, 27% chance of damaging wind over 30y; extreme-heat days projected 7→15/yr by 2055 (HVAC capex compounding) — expect insurance premiums to compound above CPI over the hold.
Questions for the listing agent
- It's been on market 71 days. Have you received any prior offers? Is the seller open to a 6% concession, seller financing, or rate buy-down credit?
- Built in 1960 — when were the roof, HVAC, electrical panel, plumbing, and water heater last replaced?
- Why hasn't it sold? Are there any deal-killer items the seller is aware of (foundation, flood, title, zoning, code violations)?
- Is there a deadline driving the sale (1031 exchange, divorce, estate, relocation)? That informs how much negotiation room exists.
- Schools are F-rated, which usually means shorter tenancies and higher turnover. Who's the typical renter profile here, and what's been the actual vacancy rate?
- Crime grade is F in this area — have there been break-ins, vandalism, or insurance claims at this property in the last 3 years? What carrier currently insures it and at what premium?
- What's the average days-on-market for RENTAL listings here right now (not sales)? A rising rental-DOM trend means longer vacancies and softer asking-rent achievability than the comps imply.
- What's the recent tenant-quality profile in this submarket — average credit score on applications, eviction rate, late-payment / NSF rate, and stable-employment percentage? A property-management company in the area should have these aggregated.
- How much new for-sale + rental construction is in the pipeline within 1–3 miles? Heavy new supply typically softens prices + rents 12–24 months out; constrained supply supports both.
Investment metrics
- 1% rule
- 1.38% ✓
- Cap rate
- 10.79%
- Cash-on-cash
- 16.08%
- DSCR
- 1.72
- GRM
- 6.0
CMA / ARV
- ARV (on-the-fly)
- $138,533
- Comps found
- 1
Show comp detail 1 sale within ~0.75 mi
| Address | Dist | Beds/Ba | Sqft | Sold | Price | $/sf | Match |
|---|---|---|---|---|---|---|---|
| 89 Willis St | 0.47mi | 2/1.0 (+1) | 557 (+13%) | 14mo | $156,499 | $281 | 40 |
Match score weights: distance 35% · size 25% · config 20% · recency 20%. Top-matched comps best support the ARV.
Projected returns pro-forma
-3.0% appreciation · 3.0% rent growth · sell at horizon
- IRR
- 7.1%
- Equity multiple
- 1.28×
- Total profit
- $8,499
- Equity at exit
- $16,401
- IRR
- 16.4%
- Equity multiple
- 2.34×
- Total profit
- $41,410
- Equity at exit
- $9,511
Cash invested: $30,800 (down + closing). Projections, not guarantees.
Landlord ↔ Tenant lean methodology
- Overall (STATE)
- 21 Tenant-Leaning
- State New Jersey
- 21 Tenant-Leaning · D+6
- County
- — inherits STATE
- City
- — inherits STATE
ZIP-level market 08069
- Home prices YoY
- -18.8%
- Active inventory
- 105
- Price-to-rent
- 6.0×
Monthly cashflow live
- Estimated rent
- $1,522 medium interval (Pro) →
- Mortgage (P&I)
- −$577
- Tax from tax record
- −$167 /mo · $2,000/yr
- Insurance
- −$46
- HOA
- −$0
- Vacancy / Maint / Mgmt
- −$320
- Net cashflow
- $413
Break-even live
Sensitivity live
| Price | -10% $475 | -5% $444 | +0% $413 | +5% $382 | +10% $350 |
|---|---|---|---|---|---|
| Rent | -10% $292 | -5% $353 | +0% $413 | +5% $473 | +10% $533 |
| Rate | -1.0pp $468 | -0.5pp $441 | base $413 | +0.5pp $384 | +1.0pp $355 |
UW: 25.0% down · 7.5% · 30yr · 1.5% tax · 5.0% vac · 8.0% maint · 8.0% mgmt
Financing live
Cash to close
- Down payment
- $27,500
- Closing costs
- $3,300
- Reserves months
- —
- Total cash needed
- —
Loan-product check · same deal, 3 products live
Conventional
25% down · 7.5% · 30yr
- Down + closing
- —
- Monthly P&I
- —
- Monthly cashflow
- —
- DSCR
- —
- Eligible?
- —
Personal DTI + credit; lowest rate.
DSCR
20% down · 8.5% · 30yr
- Down + closing
- —
- Monthly P&I
- —
- Monthly cashflow
- —
- DSCR
- —
- Eligible?
- —
No personal income docs; deal must DSCR.
Hard money
10% down · 12.0% · 12mo
- Down + closing
- —
- Monthly P&I
- —
- Monthly cashflow
- —
- DSCR
- —
- Eligible?
- —
Short-term bridge; refi at stabilization.
Listing history 18 events
-
2026-05-01status Pending
-
2026-04-30historical Active Under Contract
-
2026-02-18$110,000 Active
-
2025-10-01soldstatus $55,000
-
2025-08-29historical
-
2025-07-11status Active
-
2025-06-18status Pending
-
2025-05-21price $74,999
-
2025-04-16status Active
-
2025-04-04historical Active Under Contract
-
2025-03-10$79,999 Active
-
2021-08-13soldstatus $29,000
-
2021-02-04historical
-
2021-01-31status Active
-
2020-07-27historical
-
2020-02-08$35,900 Active
-
1997-09-16soldstatus $1
-
1997-09-08soldstatus $163,000
ⓘ Source: listings_history table (triggers on properties + properties_extension) + one-shot
backfill from property_details.listing_events for pre-trigger history.
Tax reassessment forecast NJ · Partial reset (capped growth)
- Current annual tax
- $2,000 · $167/mo
- Projected year-2 tax
- $2,369 · $197/mo
- Expected delta
- +$370/yr (+$31/mo · 18.5%)
ⓘ Screening estimate from a state-policy table — verify with the county assessor before closing.
Climate risk First Street
- Flood 4/10 Moderate FEMA zone X (unshaded) · 20% chance over 30 yrs
- Wildfire 1/10 Low
- Heat 8/10 Severe 7 d/yr ≥104°F today · 15 d/yr by 30 yrs out
- Wind 6/10 Major 27% chance of damaging wind over 30 yrs
- Air quality 3/10 Moderate 3 unhealthy d/yr today · 5 by 30 yrs out
Nearby sold comps map
Loading sold comps map…
Walkable amenities ~0.75 mi
Loading nearby amenities…
Taxation est. · year 1
- Rental income
- $18,258
- − Mortgage interest
- −$6,162
- − Property taxes
- −$2,000
- − Insurance
- −$550
- − Repairs & maintenance
- −$1,461
- − Management
- −$1,461
- − Depreciation
- −$3,200
- Taxable income
- $3,425
- Est. tax owed @ 24.0%
- −$822
- After-tax cash flow
- $4,130/yr
For passive investors: Depreciation is non-cash, so a rental often shows a tax loss while cash-flowing — sheltering income. Rental losses are passive: they offset passive income freely, and up to $25,000/yr can offset ordinary (W-2) income if you actively participate and your MAGI is under $100k (phasing out to $0 by $150k); unused losses carry forward. On sale, claimed depreciation is recaptured at up to 25%, and gains may owe capital-gains tax (a 1031 exchange can defer both). Figures are a year-1 estimate at your 24.0% rate — not tax advice; consult a CPA.
Schools (NCES district)
- District
- Penns Grove-Carneys Point Regional School District
- NCES district ID
- 3412840
- Math proficiency
- 6% ▼ -16.00%
- Reading proficiency
- 21% ▼ -7.00%
- Median HH income
- $44,930
- Composite
- 11.98/100
- National rank
- #9665
- State rank
- #462 of 472 in NJ
Livability — Penns Grove
- Score
- 57/100
- State rank
- #519
- US rank
- #22190
Category grades
Schools grade is shown separately in the Schools card above.
Census & demographics
- Census place
- Penns Grove, NJ
- County
- Salem County · 24,175 people
- Metro
- Philadelphia-Camden-Wilmington, PA-NJ-DE-MD
- Population (ZIP)
- 13,413
- Household income
- $71,942
- Rent vs Own
- Severe rent burden
- 696.0
Population outlook (Salem County) Hauer SSP2
- Today (2025)
- 59,905 people
- By 2030
- 57,351 · -4.3%
- By 2040
- 51,837 · -13.5%
- By 2050
- 46,356 · -22.6%
- By 2075
- 36,452 · -39.2%
- By 2100
- 28,907 · -51.7%
Race, ethnicity, and origin ACS 2023
- Neighborhood character
- Diverse neighborhood (Simpson 0.65)
- Race & ethnicity
- White 50% Hispanic / Latino 22% Black 22% Two or more races 8% Asian 2%
- Hispanic origin (detail)
- Mexican 5% Puerto Rican 14%
- Common ancestry
- Romanian 3% Slovak 2% Lithuanian 1%
- Foreign-born
- 5% · Canada
- Languages at home
- 85% English-only · Spanish 13% Tagalog/Filipino 1%
Political lean MEDSL · Salem
- 2024 margin
- R (+19.2) · D 39.6% · R 58.8% · Other 1.6%
- 2008→2024 swing
- -23.1pp toward R · 2008: 3.9pp · 2024: -19.2pp
- All cycles
- 2024: R+19.2 2020: R+12.8 2016: R+15.4 2012: D+0.8 2008: D+3.9
Not yet ingested
- Civics
- —
Market trends
- HPI YoY
- ▼ -67.07%
- Current HPI
- 290.3853
- Rent YoY
- —
- Metro
- Philadelphia-Camden-Wilmington, PA-NJ-DE-MD
- State GDP YoY
- ▲ 2.05%
- F500 in state
- 34
Industry mix (Fortune 500 HQ in NJ)
| Industry | F500 HQs | Revenue |
|---|---|---|
| Consumer Goods | 3 | $31B |
|
||
| Pharmaceuticals | 2 | $153B |
|
||
| Technology | 2 | $21B |
|
||
| Insurance | 2 | $20B |
|
||
| Healthcare | 2 | $19B |
|
||
| Financial Services | 1 | $70B |
|
||
Price history
-32.5% since first listed18 events — show timeline
- 2026-05-01 Pending — BRIGHT MLS
- 2026-04-30 Contingent — BRIGHT MLS
- 2026-02-18 Listed $110,000 BRIGHT MLS
- 2025-10-01 Sold (Public Records) $55,000 Public Records
- 2025-08-29 Listing Removed — BRIGHT MLS
- 2025-07-11 Relisted — BRIGHT MLS
- 2025-06-18 Pending — BRIGHT MLS
- 2025-05-21 Price Changed $74,999 BRIGHT MLS
- 2025-04-16 Relisted — BRIGHT MLS
- 2025-04-04 Contingent — BRIGHT MLS
- 2025-03-10 Listed $79,999 BRIGHT MLS
- 2021-08-13 Sold (Public Records) $29,000 Public Records
- 2021-02-04 Listing Removed — BRIGHT MLS
- 2021-01-31 Relisted — BRIGHT MLS
- 2020-07-27 Listing Removed — BRIGHT MLS
- 2020-02-08 Listed $35,900 BRIGHT MLS
- 1997-09-16 Sold (Public Records) $1 Public Records
- 1997-09-08 Sold (Public Records) $163,000 Public Records
Property tax history
+0.8%/yrLatest (2025): $2,000 · +1.9% YoY. Source: county tax records.
Cash-flow waterfall
monthlySold comps — $/sqft
last 12 mo · ≤1 miLoading sold comps…