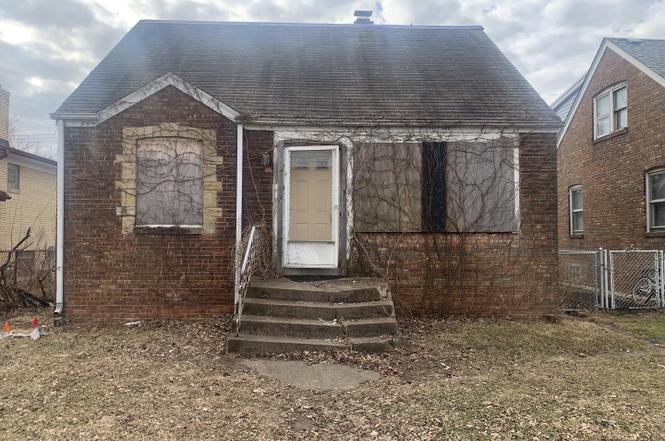
503 Webb St · Calumet City, IL
Flood risk 1/10 · Minimal
- FEMA flood zone
- X (unshaded)
- Chance of flooding over 30 yrs
- 0.0%
- Est. flood insurance / yr
- $473 – $860
Fire risk 1/10 · Minimal
- Est. fire insurance / yr
- $804 – $1,492
Heat risk 3/10 · Minor
- Hot days now (above 102°F)
- 7 days/yr
- Hot days in 30 yrs
- 15 days/yr
Wind risk 2/10 · Minimal
- Chance of severe wind over 30 yrs
- —
Air-quality risk 4/10 · Minor
- Unhealthy air days now
- 5 days/yr
- Unhealthy air days in 30 yrs
- 6 days/yr
Risk factors via First Street. Map © Google.
Why this score? — see what drove the B- grade
The composite is a weighted blend of 9 inputs, each scored 0–100. Each bar is that input's sub-score; the figure is the points it added to the 100-point composite (weight × sub-score).
- Cash flow +30.0/30.0
- 1% rule +10.0/10.0
- DSCR +10.0/10.0
- ARV discount +7.5/15.0
- Rent growth +4.0/5.0
- Livability +3.6/5.0
- Condition / age +2.5/5.0
- Schools +1.0/10.0
- Appreciation +0.0/10.0
$50,000
🖨 Deal sheet 📄 Offer letter ✓ Due diligence
Listing remarks
Welcome to 503 Webb St a prime opportunity for both savvy investors and future homeowners. This property is part of the South Suburban Land Bank program, offering a unique chance to acquire and transform a home with strong upside potential. Featuring a solid structure and functional layout, this home is ready for your vision. Whether you're an investor looking for your next rehab project or an owner occupant ready to create your dream home, the possibilities here are endless. With the right updates, this property can be brought back to life and customized to fit your goals. Located on a quiet residential street, the home is conveniently positioned near shopping, dining, schools, and major e
Key facts
- Near schools
- Near dining
- Near shopping
Tags
Neighborhood map
What this means for you Summary
Snapshot
- This is a 2-bed/1.0-bath single-family listed at $50k.
Deal economics
- At list price, monthly cash flow is $808 ($10k/yr) — positive.
- The deal already cash-flows at list — no discount required.
- Meets the 1% rule at list price ($1k rent vs $50k).
- Recommended offer: $48k (3.0% below list) — sets the bar for market timing.
- Cap rate 25.7% vs local median 8.2% in Calumet City — top-decile yield for the area; either an underpriced asset or a hidden risk that comps aren't pricing in. Stress-test before assuming the spread holds.
Location & tenants
- Location reads 71/100 on livability (#330 in IL) — a middle-class / working-renter tenant base. Strengths: commute A+, cost of living A+, housing A+; Watch: employment C-, crime D-, amenities F.
- Thornton Fractional Twp Hsd 215 (suburban): math 9% / reading 13% proficiency, ranked #563 of 620 in IL (top 91%) — low school quality limits family demand, transient renter base, plan for 1-2y turnover.
- Zoned schools: Thornton Fractnl No High School (math 6% / reading 10%, grade F, #587 of 693 statewide, top 85%, 1,383 students, 0% FRL).
- Market conditions: Rents rising fast (+6.2%/yr); 198 active listings in the ZIP; 21 comparable units currently listed for rent nearby; rentals at typical pace (median 25d on market — plan ~3-4 weeks tenant-placement turnaround); 6,272 units permitted in Cook County in 2024 (4,658 in 5+ unit buildings).
- This rent runs 32% of the median local income ($55k/yr) — at the standard rent-burdened threshold; future hikes will face affordability resistance.
Forward outlook
- Local home prices are declining (-3.0%/yr); year-one equity from $346 of loan paydown is wiped out by about $2k of value loss. Plan a longer hold.
- At projected returns (-3.0% appreciation + 6.2% rent growth), your $14k cash investment doubles in ~2 years — after that, you're playing with house money.
Negotiation context
- It's been on market 46 days — a 3% lower offer ($48k) is reasonable based on typical stale-listing flexibility.
- 2 sale attempts since 15y ago with the ask held roughly flat each time — persistent listings suggest the price (not the market) is what's stuck; bring a comps-based counter.
Risks & watch-outs
- Watch-outs: built in 1945 — expect roof / HVAC / electrical / plumbing capex.
Questions for the listing agent
- It's been on market 46 days. Have you received any prior offers? Is the seller open to a 3% concession, seller financing, or rate buy-down credit?
- Built in 1945 — when were the roof, HVAC, electrical panel, plumbing, and water heater last replaced?
- Is there a deadline driving the sale (1031 exchange, divorce, estate, relocation)? That informs how much negotiation room exists.
- Schools are F-rated, which usually means shorter tenancies and higher turnover. Who's the typical renter profile here, and what's been the actual vacancy rate?
- Crime grade is D in this area — have there been break-ins, vandalism, or insurance claims at this property in the last 3 years? What carrier currently insures it and at what premium?
- What's the average days-on-market for RENTAL listings here right now (not sales)? A rising rental-DOM trend means longer vacancies and softer asking-rent achievability than the comps imply.
- What's the recent tenant-quality profile in this submarket — average credit score on applications, eviction rate, late-payment / NSF rate, and stable-employment percentage? A property-management company in the area should have these aggregated.
- How much new for-sale + rental construction is in the pipeline within 1–3 miles? Heavy new supply typically softens prices + rents 12–24 months out; constrained supply supports both.
Investment metrics
- 1% rule
- 2.92% ✓
- Cap rate
- 25.69%
- Cash-on-cash
- 69.28%
- DSCR
- 4.08
- GRM
- 2.9
CMA / ARV
- ARV (on-the-fly)
- $148,648
- Comps found
- 12
Show comp detail 12 sales within ~0.75 mi
| Address | Dist | Beds/Ba | Sqft | Sold | Price | $/sf | Match |
|---|---|---|---|---|---|---|---|
| 503 Webb St | 0.00mi | 2/1.0 | 1,093 (0%) | 1mo | $20,000 | $18 | 99 |
| 328 156th Pl | 0.25mi | 3/1.0 (+1) | 1,095 (+0%) | 5mo | $50,177 | $46 | 79 |
| 518 156th Pl | 0.15mi | 3/2.0 (+1) | 1,165 (+7%) | 3mo | $167,000 | $143 | 70 |
| 866 Greenbay Ave | 0.19mi | 3/2.0 (+1) | 1,163 (+6%) | 3mo | $200,000 | $172 | 69 |
| 211 Waltham St | 0.43mi | 3/2.0 (+1) | 1,101 (+1%) | 1mo | $150,000 | $136 | 69 |
| 243 Waltham St | 0.38mi | 3/1.0 (+1) | 1,032 (-6%) | 3mo | $200,000 | $194 | 65 |
| 527 155th Pl | 0.25mi | 2/1.0 | 947 (-13%) | 3mo | $82,900 | $88 | 64 |
| 15 156th Pl | 0.62mi | 2/1.0 | 1,122 (+3%) | 4mo | $135,200 | $120 | 64 |
| 228 154th Pl | 0.51mi | 3/2.0 (+1) | 1,120 (+2%) | 3mo | $39,900 | $36 | 60 |
| 303 W 153rd Pl | 0.55mi | 3/1.0 (+1) | 1,188 (+9%) | 1mo | $65,000 | $55 | 54 |
| 302 153rd St | 0.63mi | 3/1.0 (+1) | 1,016 (-7%) | 2mo | $175,000 | $172 | 53 |
| 7 Highland St | 0.69mi | 3/2.0 (+1) | 1,163 (+6%) | 3mo | $172,500 | $148 | 45 |
Match score weights: distance 35% · size 25% · config 20% · recency 20%. Top-matched comps best support the ARV.
Projected returns pro-forma
-3.0% appreciation · 6.17% rent growth · sell at horizon
- IRR
- 72.3%
- Equity multiple
- 4.44×
- Total profit
- $48,203
- Equity at exit
- $7,455
- IRR
- 77.1%
- Equity multiple
- 10.24×
- Total profit
- $129,398
- Equity at exit
- $4,323
Cash invested: $14,000 (down + closing). Projections, not guarantees.
Landlord ↔ Tenant lean methodology
- Overall (STATE)
- 43 Moderately Tenant-Leaning
- State Illinois
- 43 Moderately Tenant-Leaning · D+7
- County
- — inherits STATE
- City
- — inherits STATE
ZIP-level market 60409
- Home prices YoY
- -27.6%
- Rents YoY
- 6.2%
- Active inventory
- 198
- Price-to-rent
- 2.9×
Monthly cashflow live
- Estimated rent
- $1,460 high interval (Pro) →
- Mortgage (P&I)
- −$262
- Tax est. 1.5%
- −$62 /mo · $750/yr
- Insurance
- −$21
- HOA
- −$0
- Vacancy / Maint / Mgmt
- −$307
- Net cashflow
- $808
Break-even live
UW: 25.0% down · 7.5% · 30yr · 1.5% tax · 5.0% vac · 8.0% maint · 8.0% mgmt
Financing live
Cash to close
- Down payment
- $12,500
- Closing costs
- $1,500
- Reserves months
- —
- Total cash needed
- —
Loan-product check · same deal, 3 products live
Conventional
25% down · 7.5% · 30yr
- Down + closing
- —
- Monthly P&I
- —
- Monthly cashflow
- —
- DSCR
- —
- Eligible?
- —
Personal DTI + credit; lowest rate.
DSCR
20% down · 8.5% · 30yr
- Down + closing
- —
- Monthly P&I
- —
- Monthly cashflow
- —
- DSCR
- —
- Eligible?
- —
No personal income docs; deal must DSCR.
Hard money
10% down · 12.0% · 12mo
- Down + closing
- —
- Monthly P&I
- —
- Monthly cashflow
- —
- DSCR
- —
- Eligible?
- —
Short-term bridge; refi at stabilization.
Rent comps 21 comps
| Address | Beds | Baths | Sqft | Rent | $/sqft | DOM | Units | Dist |
|---|---|---|---|---|---|---|---|---|
| 331 157th St Calumet City, IL | 1.0 | 1.0 | 900 | $1,100 | $1.22 | 24d | 1 | 0.22mi |
| 115 157th St Unit 3 Calumet City, IL | 3.0 | 1.0 | 800 | $1,350 | $1.69 | 24d | 1 | 0.52mi |
| 34 Elizabeth St Calumet City, IL | 3.0 | 1.0 | 1246 | $2,400 | $1.93 | 1d | 1 | 0.63mi |
| 3 Ruth St Hammond, IN | 2.0 | 1.0 | 900 | $1,250 | $1.39 | 24d | 1 | 0.68mi |
| 5 Ruth St Unit 2W Hammond, IN | 2.0 | 1.0 | 900 | $1,250 | $1.39 | 12d | 1 | 0.68mi |
| 3 Waltham St Hammond, IN | 3.0 | 1.0 | 1200 | $1,095 | $0.91 | 24d | 1 | 0.70mi |
| 323 Memorial Dr Unit 2 Calumet City, IL | 2.0 | 1.0 | 1000 | $1,600 | $1.60 | 24d | 1 | 0.72mi |
| 323 Memorial Dr #1 Calumet City, IL | 1.0 | 1.0 | 1000 | $1,250 | $1.25 | 24d | 1 | 0.72mi |
| 1312 Gordon Ave Calumet City, IL | 2.0 | 1.0 | 1134 | $1,600 | $1.41 | 7d | 1 | 0.85mi |
| 5940 Hyslop Pl #226 Hammond, IN | 1.0 | 1.0 | 800 | $950 | $1.19 | 1d | 1 | 0.92mi |
| 5945 Hyslop Pl Unit 204 Hammond, IN | 1.0 | 1.0 | 700 | $1,195 | $1.71 | 24d | 1 | 0.94mi |
| 486 Buffalo Ave Unit 1D Calumet City, IL | 1.0 | 1.0 | 800 | $975 | $1.22 | 24d | 1 | 0.97mi |
| 486 Buffalo Ave Unit 1C Calumet City, IL | 1.0 | 1.0 | 800 | $1,500 | $1.88 | 24d | 1 | 0.97mi |
| 634 Sibley Blvd Calumet City, IL | 1.0–2.0 | 1.0 | 710 | $1,450 | $2.04 | 4d | 2 | 0.98mi |
| 1338 Wentworth Ave Unit 1338 Calumet City, IL | 2.0 | 1.0 | 800 | $1,430 | $1.79 | 24d | 1 | 1.00mi |
| 5231 Hohman Ave Hammond, IN | 1.0 | 1.0 | 582 | $1,937 | $3.33 | 1d | 15 | 1.07mi |
| 230 Wildwood Rd Unit 103 Hammond, IN | 1.0 | 1.0 | 750 | $1,295 | $1.73 | 24d | 1 | 1.09mi |
| 671 Saginaw Ave Calumet City, IL | 3.0 | 2.0 | 1250 | $2,276 | $1.82 | 10d | 1 | 1.13mi |
| 407 Kenwood St Hammond, IN | 2.0 | 1.0 | 920 | $1,495 | $1.62 | 24d | 1 | 1.23mi |
| 407 Kenwood St Hammond, IN | 2.0 | 1.0 | 920 | $1,495 | $1.62 | 16d | 1 | 1.23mi |
| 1539 Wentworth Ave Unit 3W Calumet City, IL | 3.0 | 1.0 | 1100 | $1,700 | $1.55 | 12d | 1 | 1.46mi |
Listing history 5 events
-
2026-04-14status Pending
-
2026-02-26$50,000 Active
-
2011-12-30historical
-
2011-12-14price Price Change
-
2011-11-18New
ⓘ Source: listings_history table (triggers on properties + properties_extension) + one-shot
backfill from property_details.listing_events for pre-trigger history.
Climate risk First Street
- Flood 1/10 Low FEMA zone X (unshaded) · 0% chance over 30 yrs
- Wildfire 1/10 Low
- Heat 3/10 Moderate 7 d/yr ≥102°F today · 15 d/yr by 30 yrs out
- Wind 2/10 Low
- Air quality 4/10 Moderate 5 unhealthy d/yr today · 6 by 30 yrs out
Nearby sold comps map
Loading sold comps map…
Walkable amenities ~0.75 mi
Loading nearby amenities…
Taxation est. · year 1
- Rental income
- $17,526
- − Mortgage interest
- −$2,801
- − Property taxes
- −$750
- − Insurance
- −$250
- − Repairs & maintenance
- −$1,402
- − Management
- −$1,402
- − Depreciation
- −$1,455
- Taxable income
- $9,466
- Est. tax owed @ 24.0%
- −$2,272
- After-tax cash flow
- $7,427/yr
For passive investors: Depreciation is non-cash, so a rental often shows a tax loss while cash-flowing — sheltering income. Rental losses are passive: they offset passive income freely, and up to $25,000/yr can offset ordinary (W-2) income if you actively participate and your MAGI is under $100k (phasing out to $0 by $150k); unused losses carry forward. On sale, claimed depreciation is recaptured at up to 25%, and gains may owe capital-gains tax (a 1031 exchange can defer both). Figures are a year-1 estimate at your 24.0% rate — not tax advice; consult a CPA.
Schools (NCES district)
- District
- Thornton Fractional Twp Hsd 215
- NCES district ID
- 1738940
- Math proficiency
- 9% ▼ -3.00%
- Reading proficiency
- 13% ▼ -3.00%
- Median HH income
- $48,207
- Composite
- 10.27/100
- National rank
- #9793
- State rank
- #563 of 620 in IL
Livability — Calumet City
- Score
- 71/100
- State rank
- #330
- US rank
- #6552
Category grades
Schools grade is shown separately in the Schools card above.
Census & demographics
- Census place
- Calumet City, IL
- County
- Cook County · 4,486,803 people
- City population
- 35,100
- Metro
- Chicago-Naperville-Elgin, IL-IN-WI
- Population (ZIP)
- 35,100
- Household income
- $55,369
- Rent vs Own
- Severe rent burden
- 2415.0
Population outlook (Cook County) Hauer SSP2
- Today (2025)
- 5,347,519 people
- By 2030
- 5,357,703 · +0.2%
- By 2040
- 5,324,924 · -0.4%
- By 2050
- 5,230,762 · -2.2%
- By 2075
- 4,785,735 · -10.5%
- By 2100
- 4,188,836 · -21.7%
Race, ethnicity, and origin ACS 2023
- Neighborhood character
- Predominantly Black (74%)
- Race & ethnicity
- Black 74% Hispanic / Latino 15% White 7% Two or more races 4%
- Hispanic origin (detail)
- Mexican 14%
- Common ancestry
- Romanian 2%
- Foreign-born
- 9% · Canada
- Languages at home
- 83% English-only · Spanish 14%
Political lean MEDSL · Cook
- 2024 margin
- Solid D (+42.0) · D 70.4% · R 28.4% · Other 1.2%
- 2008→2024 swing
- -11.4pp toward R · 2008: 53.4pp · 2024: 42.0pp
- All cycles
- 2024: D+42.0 2020: D+50.3 2016: D+53.0 2012: D+49.4 2008: D+53.4
Not yet ingested
- Civics
- —
Market trends
- HPI YoY
- ▼ -75.01%
- Current HPI
- 197.2137
- Rent YoY
- ▲ 6.17%
- Metro
- Chicago-Naperville-Elgin, IL-IN-WI
- State GDP YoY
- ▲ 1.59%
- F500 in state
- 60
Industry mix (Fortune 500 HQ in IL)
| Industry | F500 HQs | Revenue |
|---|---|---|
| Insurance | 4 | $201B |
|
||
| Consumer Goods | 4 | $87B |
|
||
| Industrial Machinery | 3 | $64B |
|
||
| Healthcare | 2 | $55B |
|
||
| Retail / Pharmacy | 1 | $148B |
|
||
| Agriculture / Food | 1 | $86B |
|
||
Price history
5 events — show timeline
- 2026-04-14 Pending — MRED as Distributed by MLS Grid
- 2026-02-26 Listed $50,000 MRED as Distributed by MLS Grid
- 2011-12-30 Listing Removed — MRED as Distributed by MLS Grid
- 2011-12-14 Price Changed — MRED as Distributed by MLS Grid
- 2011-11-18 Listed — MRED as Distributed by MLS Grid
Property tax history
+0.9%/yrLatest (2023): $2,520 · -4.5% YoY. Source: county tax records.
Cash-flow waterfall
monthlySold comps — $/sqft
last 12 mo · ≤1 miLoading sold comps…