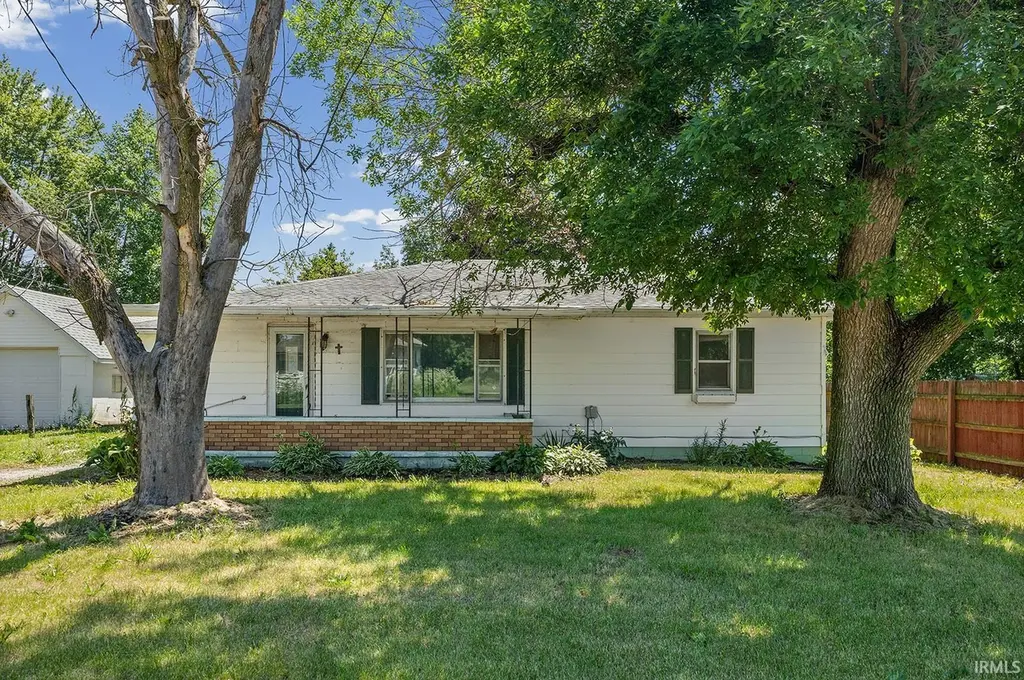
305 S Smith St · Boswell, IN
Flood risk 1/10 · Minimal
- FEMA flood zone
- X (unshaded)
- Chance of flooding over 30 yrs
- 0.0%
- Est. flood insurance / yr
- $507 – $1,088
Fire risk 1/10 · Minimal
- Est. fire insurance / yr
- $717 – $1,331
Heat risk 3/10 · Minor
- Hot days now (above 101°F)
- 7 days/yr
- Hot days in 30 yrs
- 18 days/yr
Wind risk 2/10 · Minimal
- Chance of severe wind over 30 yrs
- 1.0%
Air-quality risk 2/10 · Minimal
- Unhealthy air days now
- 1 days/yr
- Unhealthy air days in 30 yrs
- 2 days/yr
Risk factors via First Street. Map © Google.
Why this score? — see what drove the B+ grade
The composite is a weighted blend of 9 inputs, each scored 0–100. Each bar is that input's sub-score; the figure is the points it added to the 100-point composite (weight × sub-score).
- Cash flow +30.0/30.0
- DSCR +10.0/10.0
- Appreciation +10.0/10.0
- 1% rule +8.5/10.0
- ARV discount +7.5/15.0
- Schools +3.5/10.0
- Livability +3.1/5.0
- Rent growth +2.5/5.0
- Condition / age +2.5/5.0
$65,000
🖨 Deal sheet (PDF) 📄 Offer letter ✓ Due diligence
Listing remarks
Welcome to small-town living in the heart of Boswell! This 2-bedroom, 2-bath home offers nearly 1,400 square feet of comfortable living space and a functional floor plan designed for everyday convenience. The spacious living areas provide plenty of room to relax or entertain, while the attached garage adds valuable storage and parking space. Situated on a manageable lot in a quiet neighborhood, this property offers the perfect blend of comfort and simplicity. Whether you're a first-time buyer, looking to downsize, or seeking an investment opportunity, this home is full of potential. Enjoy the charm of rural Indiana living while remaining within easy reach of Lafayette and surrounding commun
Key facts
- 6,970 sq ft lot
- 2 garage spots
- Built 1963
Property features AI
Finance
- Other: Annual tax information available
Exterior
- Parking: Attached garage; Off-street parking; 2 garage spaces
- Utilities: Public water; Public sewer
- Home design: Single-family residence; Site-built home; One story
- Construction: Vinyl siding; Slab foundation; Built as site-built construction
- Exterior features: Privacy wood fencing; Level lot; Lot dimensions about 59 x 120
Interior
- Kitchen: Refrigerator; Gas range
- Bedrooms: Total of 7 rooms (bedroom count not specified)
- Bathrooms: 2 full bathrooms (both on the main level)
- Heating & cooling: Forced air heating; Central air conditioning
- Interior features: Refrigerator; Gas range; Dryer; Central air; Forced air heating; Main level laundry
- Laundry & utility: Dryer; Main level laundry
Neighborhood map
What this means for you Summary
Snapshot
- This is a 2-bed/2.0-bath single-family listed at $65k.
Deal economics
- At list price, monthly cash flow is $259 ($3k/yr) — positive.
- The deal already cash-flows at list — no discount required.
- Meets the 1% rule at list price ($876 rent vs $65k).
Location & tenants
- Location reads 62/100 on livability (#453 in IN) — a middle-class / working-renter tenant base. Strengths: cost of living A+, housing A+; Watch: crime D-, amenities F, commute F.
- Benton Community School Corporation (rural): math 38% / reading 43% proficiency, ranked #134 of 301 in IN (top 44%) — families likely to look elsewhere, expect single-tenant / working-renter base with shorter leases.
- Zoned schools: Prairie Crossing Elementary School (math 46% / reading 37%, grade F, #478 of 994 statewide, top 49%, 561 students, 65% FRL); Benton Central Jr-Sr High School (math 31% / reading 53%, grade F, #197 of 369 statewide, top 57%, 790 students, 48% FRL) — zoned schools average 57% FRL vs 38% district-wide (18 pts higher); higher-poverty schools than district average — tighter screening recommended.
- Market conditions: 9 active listings in the ZIP.
Forward outlook
- In year one you build about $7k of equity ($449 loan paydown + $6k appreciation (10.0% local appreciation)).
- Benton County population projected at -13% by 2050 — secular population decline; favor cash flow + early exit over multi-decade hold.
- At projected returns (10.0% appreciation + 3.0% rent growth), your $18k cash investment doubles in ~2 years — after that, you're playing with house money.
- By year 5, paydown + projected appreciation supports a ~$32k cash-out refi (75% LTV) — recoverable capital for the next deal without selling this one.
Negotiation context
- Only 7 days on market — expect competitive offers; lowballing is unlikely to land.
- Current owner paid $55k; 18% above their basis — modest negotiation headroom, anchor on the comps not their cost.
Questions for the listing agent
- Built in 1963 — when were the roof, HVAC, electrical panel, plumbing, and water heater last replaced?
- Is there a deadline driving the sale (1031 exchange, divorce, estate, relocation)? That informs how much negotiation room exists.
- Schools are F-rated, which usually means shorter tenancies and higher turnover. Who's the typical renter profile here, and what's been the actual vacancy rate?
- Crime grade is D in this area — have there been break-ins, vandalism, or insurance claims at this property in the last 3 years? What carrier currently insures it and at what premium?
- What's the average days-on-market for RENTAL listings here right now (not sales)? A rising rental-DOM trend means longer vacancies and softer asking-rent achievability than the comps imply.
- What's the recent tenant-quality profile in this submarket — average credit score on applications, eviction rate, late-payment / NSF rate, and stable-employment percentage? A property-management company in the area should have these aggregated.
- How much new for-sale + rental construction is in the pipeline within 1–3 miles? Heavy new supply typically softens prices + rents 12–24 months out; constrained supply supports both.
Investment metrics
- 1% rule
- 1.35% ✓
- Cap rate
- 11.07%
- Cash-on-cash
- 17.05%
- DSCR
- 1.76
- GRM
- 6.2
CMA / ARV
- ARV (on-the-fly)
- $170,312
- Comps found
- 3
Show comp detail 3 sales within ~0.75 mi
| Address | Dist | Beds/Ba | Sqft | Sold | Price | $/sf | Match |
|---|---|---|---|---|---|---|---|
| 308 N Center St | 0.41mi | 3/2.5 (+1) | 1,476 (+6%) | 3mo | $173,000 | $117 | 62 |
| 306 N Center St | 0.41mi | 3/1.0 (+1) | 1,501 (+8%) | 7mo | $183,000 | $122 | 54 |
| 303 E Spies St | 0.25mi | 2/2.0 | 1,192 (-15%) | 21mo | $150,000 | $126 | 47 |
Match score weights: distance 35% · size 25% · config 20% · recency 20%. Top-matched comps best support the ARV.
Projected returns pro-forma
10.0% appreciation · 3.0% rent growth · sell at horizon
- IRR
- 36.9%
- Equity multiple
- 3.85×
- Total profit
- $51,872
- Equity at exit
- $58,557
- IRR
- 31.8%
- Equity multiple
- 8.68×
- Total profit
- $139,812
- Equity at exit
- $126,281
Cash invested: $18,200 (down + closing). Projections, not guarantees.
Landlord ↔ Tenant lean methodology
- Overall (STATE)
- 90 Strongly Landlord-Friendly
- State Indiana
- 90 Strongly Landlord-Friendly · R+11
- County
- — inherits STATE
- City
- — inherits STATE
ZIP-level market 47921
- Home prices YoY
- 3.4%
- Active inventory
- 9
- Price-to-rent
- 6.2×
Monthly cashflow live
- Estimated rent
- $876 medium interval (Pro) →
- Mortgage (P&I)
- −$341
- Tax from tax record
- −$66 /mo · $786/yr
- Insurance
- −$27
- HOA
- −$0
- Vacancy / Maint / Mgmt
- −$184
- Net cashflow
- $259
Break-even live
Sensitivity live
| Price | -10% $295 | -5% $277 | +0% $259 | +5% $240 | +10% $222 |
|---|---|---|---|---|---|
| Rent | -10% $189 | -5% $224 | +0% $259 | +5% $293 | +10% $328 |
| Rate | -1.0pp $291 | -0.5pp $275 | base $259 | +0.5pp $242 | +1.0pp $225 |
UW: 25.0% down · 7.5% · 30yr · 1.5% tax · 5.0% vac · 8.0% maint · 8.0% mgmt
Financing live
Cash to close
- Down payment
- $16,250
- Closing costs
- $1,950
- Reserves months
- —
- Total cash needed
- —
Loan-product check · same deal, 3 products live
Conventional
25% down · 7.5% · 30yr
- Down + closing
- —
- Monthly P&I
- —
- Monthly cashflow
- —
- DSCR
- —
- Eligible?
- —
Personal DTI + credit; lowest rate.
DSCR
20% down · 8.5% · 30yr
- Down + closing
- —
- Monthly P&I
- —
- Monthly cashflow
- —
- DSCR
- —
- Eligible?
- —
No personal income docs; deal must DSCR.
Hard money
10% down · 12.0% · 12mo
- Down + closing
- —
- Monthly P&I
- —
- Monthly cashflow
- —
- DSCR
- —
- Eligible?
- —
Short-term bridge; refi at stabilization.
Listing history 8 events
-
2026-06-19days on market $65,000 Active 7 DOM
-
2026-06-18days on market $65,000 Active 6 DOM
-
2026-06-17days on market $65,000 Active 5 DOM
-
2026-06-16days on market $65,000 Active 4 DOM
-
2026-06-15price $65,000 Active 3 DOM
-
2026-06-15days on market $70,000 Active 3 DOM
-
2026-06-13remarks 699-char remark
-
2026-06-13$70,000 Active 1 DOM
ⓘ Source: listings_history table (triggers on properties + properties_extension) + one-shot
backfill from property_details.listing_events for pre-trigger history.
Tax reassessment forecast IN · Partial reset (capped growth)
- Current annual tax
- $786 · $66/mo
- Projected year-2 tax
- $786 · $66/mo
- Expected delta
- $0/yr ($0/mo · 0.0%)
ⓘ Screening estimate from a state-policy table — verify with the county assessor before closing.
Climate risk First Street
- Flood 1/10 Low FEMA zone X (unshaded) · 0% chance over 30 yrs
- Wildfire 1/10 Low
- Heat 3/10 Moderate 7 d/yr ≥101°F today · 18 d/yr by 30 yrs out
- Wind 2/10 Low 100% chance of damaging wind over 30 yrs
- Air quality 2/10 Low 1 unhealthy d/yr today · 2 by 30 yrs out
Nearby sold comps map
Loading sold comps map…
Walkable amenities ~0.75 mi
Loading nearby amenities…
Taxation est. · year 1
- Rental income
- $10,512
- − Mortgage interest
- −$3,641
- − Property taxes
- −$786
- − Insurance
- −$325
- − Repairs & maintenance
- −$841
- − Management
- −$841
- − Depreciation
- −$1,891
- Taxable income
- $2,187
- Est. tax owed @ 24.0%
- −$525
- After-tax cash flow
- $2,578/yr
For passive investors: Depreciation is non-cash, so a rental often shows a tax loss while cash-flowing — sheltering income. Rental losses are passive: they offset passive income freely, and up to $25,000/yr can offset ordinary (W-2) income if you actively participate and your MAGI is under $100k (phasing out to $0 by $150k); unused losses carry forward. On sale, claimed depreciation is recaptured at up to 25%, and gains may owe capital-gains tax (a 1031 exchange can defer both). Figures are a year-1 estimate at your 24.0% rate — not tax advice; consult a CPA.
Schools (NCES district)
- District
- Benton Community School Corporation
- NCES district ID
- 1800480
- Math proficiency
- 38% ▼ -7.00%
- Reading proficiency
- 43% ▼ -7.00%
- Median HH income
- $50,073
- Composite
- 34.9/100
- National rank
- #5076
- State rank
- #134 of 301 in IN
Livability — Boswell
- Score
- 62/100
- State rank
- #453
- US rank
- #16100
Category grades
Schools grade is shown separately in the Schools card above.
Census & demographics
- Census place
- Boswell, IN
- Population (ZIP)
- 1,131
Population outlook (Benton County) Hauer SSP2
- Today (2025)
- 8,404 people
- By 2030
- 8,234 · -2.0%
- By 2040
- 7,832 · -6.8%
- By 2050
- 7,337 · -12.7%
- By 2075
- 6,436 · -23.4%
- By 2100
- 5,139 · -38.9%
Race, ethnicity, and origin ACS 2023
- Neighborhood character
- Predominantly White (72%)
- Race & ethnicity
- White 72% Hispanic / Latino 22% Black 4% Two or more races 3%
- Hispanic origin (detail)
- Mexican 15%
- Common ancestry
- Romanian 5% Slovak 3% Portuguese 2%
- Foreign-born
- 11% · Canada, South Korea
- Languages at home
- 83% English-only · Spanish 16% Korean 1%
Political lean MEDSL · Benton
- 2024 margin
- Solid R (+47.1) · D 25.5% · R 72.7% · Other 1.8%
- 2008→2024 swing
- -30.9pp toward R · 2008: -16.3pp · 2024: -47.1pp
- All cycles
- 2024: R+47.1 2020: R+48.6 2016: R+47.0 2012: R+32.7 2008: R+16.3
Not yet ingested
- Civics
- —
Market trends
- HPI YoY
- ▲ 11.21%
- Current HPI
- 345.0506
- Rent YoY
- —
- Metro
- —
- State GDP YoY
- ▲ 2.90%
- F500 in state
- 18
Industry mix (Fortune 500 HQ in IN)
| Industry | F500 HQs | Revenue |
|---|---|---|
| Industrial Machinery | 2 | $37B |
|
||
| Healthcare | 1 | $177B |
|
||
| Pharmaceuticals | 1 | $45B |
|
||
| Metals / Steel | 1 | $18B |
|
||
| Agriculture | 1 | $17B |
|
||
| Packaging | 1 | $12B |
|
||
Price history
+27.3% since first listed2 events — show timeline
- 2026-06-12 Listed $70,000 IRMLS
- 2017-05-03 Sold (Public Records) $55,000 Public Records
Property tax history
+0.6%/yrLatest (2024): $786 · -3.8% YoY. Source: county tax records.
Cash-flow waterfall
monthlySold comps — $/sqft
last 12 mo · ≤1 miLoading sold comps…