9850 S Grayling Rd · Beaver Creek, MI
Flood risk 1/10 · Minimal
- FEMA flood zone
- X (unshaded)
- Chance of flooding over 30 yrs
- 0.0%
- Est. flood insurance / yr
- $507 – $1,088
Fire risk 5/10 · Moderate
- Est. fire insurance / yr
- $784 – $1,456
Heat risk 1/10 · Minimal
- Hot days now (above 92°F)
- 7 days/yr
- Hot days in 30 yrs
- 14 days/yr
Wind risk 1/10 · Minimal
- Chance of severe wind over 30 yrs
- —
Air-quality risk 2/10 · Minimal
- Unhealthy air days now
- 0 days/yr
- Unhealthy air days in 30 yrs
- 1 days/yr
Risk factors via First Street. Map © Google.
Why this score? — see what drove the C+ grade
The composite is a weighted blend of 9 inputs, each scored 0–100. Each bar is that input's sub-score; the figure is the points it added to the 100-point composite (weight × sub-score).
- Cash flow +23.1/30.0
- ARV discount +15.0/15.0
- DSCR +7.4/10.0
- 1% rule +4.8/10.0
- Schools +3.9/10.0
- Rent growth +2.5/5.0
- Livability +2.5/5.0
- Condition / age +2.5/5.0
- Appreciation +0.0/10.0
$79,500
🖨 Deal sheet (PDF) 📄 Offer letter ✓ Due diligence
Listing remarks
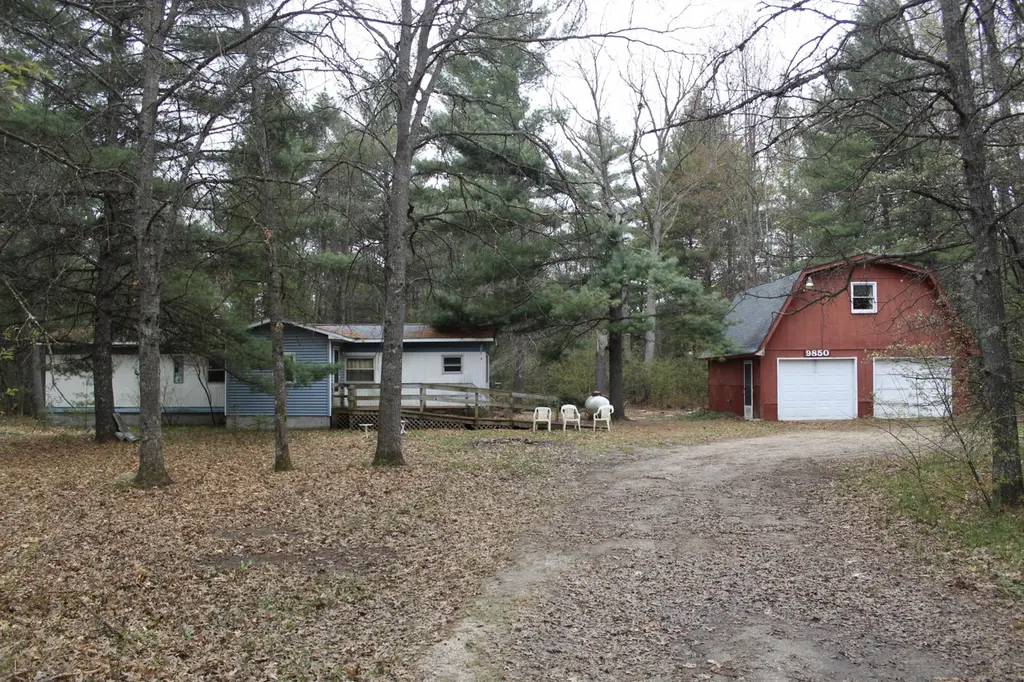
Fixer-Upper Mobile with endless potential in a quiet private neighborhood on spacious acreage. Conveniently located near beautiful Higgins Lake with easy access to I-75 and US-27 for commuting and travel. Features a uniquely designed, large detached garage with upper level offering ample storage, workshop space or room for recreational toys. Peaceful country setting with the perfect blend of privacy and accessibility. Includes all items on premises. Cash only. .. .. ..
Key facts
- Workshop space
- Spacious acreage
- Easy access to us-27
Tags
Property features AI
Exterior
- Parking: Detached 2-car garage
- Utilities: Private well water; Septic tank sewer
- Home design: Single-family residence; Residential acreage
- Construction: Crawl space basement
- Exterior features: Natural vegetation; Paved road access; Approximately 3.42-acre lot
Interior
- Kitchen: Refrigerator; Oven; Range
- Bathrooms: 1 full bathroom
- Heating & cooling: Forced air heating; Propane fuel
- Interior features: Refrigerator; Oven; Range
- Laundry & utility: Laundry on main level
Neighborhood map
What this means for you Summary
Snapshot
- This is a 2-bed/1.0-bath single-family listed at $80k.
Deal economics
- At list price, monthly cash flow is $143 ($2k/yr) — positive.
- The deal already cash-flows at list — no discount required.
- To meet the 1% rule (rent ≥ 1% of price), the offer needs to be $78k (1.6% below list).
- Recommended offer: $77k (3.0% below list) — sets the bar for market timing.
Location & tenants
- Location reads: area grade C — affects rentability + tenant quality, not the cash-flow math above.
- Crawford Ausable Schools (town): math 43% / reading 50% proficiency, ranked #140 of 540 in MI (top 26%) — families likely to look elsewhere, expect single-tenant / working-renter base with shorter leases.
- Zoned schools: Grayling Elementary School (math 42% / reading 42%, grade F, #547 of 1,397 statewide, top 41%, 638 students, 66% FRL); Grayling Middle School (math 48% / reading 52%, grade C, #117 of 493 statewide, top 25%, 461 students, 57% FRL); Grayling High School (math 47% / reading 72%, grade C+, #80 of 713 statewide, top 12%, 452 students, 50% FRL).
- Market conditions: 166 active listings in the ZIP; 75 units permitted in Crawford County in 2024 (32 in 5+ unit buildings).
Forward outlook
- Local home prices are declining (-3.0%/yr); year-one equity from $550 of loan paydown is wiped out by about $2k of value loss. Plan a longer hold.
- Crawford County population projected at -22% by 2050 — secular population decline; favor cash flow + early exit over multi-decade hold.
Negotiation context
- It's been on market 41 days — a 3% lower offer ($77k) is reasonable based on typical stale-listing flexibility.
- Current owner paid $28k; list at $80k implies a 189% gain — meaningful room to come down on a strong offer.
Risks & watch-outs
- Climate carrying-cost: moderate wildfire risk — expect insurance premiums to compound above CPI over the hold.
Questions for the listing agent
- It's been on market 41 days. Have you received any prior offers? Is the seller open to a 3% concession, seller financing, or rate buy-down credit?
- Is there a deadline driving the sale (1031 exchange, divorce, estate, relocation)? That informs how much negotiation room exists.
- What's the average days-on-market for RENTAL listings here right now (not sales)? A rising rental-DOM trend means longer vacancies and softer asking-rent achievability than the comps imply.
- What's the recent tenant-quality profile in this submarket — average credit score on applications, eviction rate, late-payment / NSF rate, and stable-employment percentage? A property-management company in the area should have these aggregated.
- How much new for-sale + rental construction is in the pipeline within 1–3 miles? Heavy new supply typically softens prices + rents 12–24 months out; constrained supply supports both.
Investment metrics
- 1% rule
- 0.98% ✗
- Cap rate
- 8.46%
- Cash-on-cash
- 7.72%
- DSCR
- 1.34
- GRM
- 8.5
CMA / ARV
- ARV (median comp)
- $137,135
- List price
- $79,500
- Delta
- -42.03%
- Verdict
- UNDERPRICED
- Comps
- 4 within 1.0 mi
Projected returns pro-forma
-3.0% appreciation · 3.0% rent growth · sell at horizon
- IRR
- -4.6%
- Equity multiple
- 0.83×
- Total profit
- $-3,790
- Equity at exit
- $11,854
- IRR
- 5.1%
- Equity multiple
- 1.37×
- Total profit
- $8,313
- Equity at exit
- $6,874
Cash invested: $22,260 (down + closing). Projections, not guarantees.
Landlord ↔ Tenant lean methodology
- Overall (STATE)
- 62 Landlord-Friendly
- State Michigan
- 62 Landlord-Friendly · EVEN
- County
- — inherits STATE
- City
- — inherits STATE
ZIP-level market 48653
- Home prices YoY
- -34.7%
- Active inventory
- 166
- Price-to-rent
- 8.5×
Monthly cashflow live
- Estimated rent
- $783 medium interval (Pro) →
- Mortgage (P&I)
- −$417
- Tax from tax record
- −$25 /mo · $300/yr
- Insurance
- −$33
- HOA
- −$0
- Vacancy / Maint / Mgmt
- −$164
- Net cashflow
- $143
Break-even live
Sensitivity live
| Price | -10% $188 | -5% $166 | +0% $143 | +5% $121 | +10% $98 |
|---|---|---|---|---|---|
| Rent | -10% $81 | -5% $112 | +0% $143 | +5% $174 | +10% $205 |
| Rate | -1.0pp $183 | -0.5pp $164 | base $143 | +0.5pp $123 | +1.0pp $102 |
UW: 25.0% down · 7.5% · 30yr · 1.5% tax · 5.0% vac · 8.0% maint · 8.0% mgmt
Financing live
Cash to close
- Down payment
- $19,875
- Closing costs
- $2,385
- Reserves months
- —
- Total cash needed
- —
Loan-product check · same deal, 3 products live
Conventional
25% down · 7.5% · 30yr
- Down + closing
- —
- Monthly P&I
- —
- Monthly cashflow
- —
- DSCR
- —
- Eligible?
- —
Personal DTI + credit; lowest rate.
DSCR
20% down · 8.5% · 30yr
- Down + closing
- —
- Monthly P&I
- —
- Monthly cashflow
- —
- DSCR
- —
- Eligible?
- —
No personal income docs; deal must DSCR.
Hard money
10% down · 12.0% · 12mo
- Down + closing
- —
- Monthly P&I
- —
- Monthly cashflow
- —
- DSCR
- —
- Eligible?
- —
Short-term bridge; refi at stabilization.
Listing history 20 events
-
2026-06-22days on market $79,500 Active 41 DOM
-
2026-06-21days on market $79,500 Active 40 DOM
-
2026-06-21days on market $79,500 Active 39 DOM
-
2026-06-18days on market $79,500 Active 37 DOM
-
2026-06-17days on market $79,500 Active 36 DOM
-
2026-06-16days on market $79,500 Active 35 DOM
-
2026-06-15days on market $79,500 Active 34 DOM
-
2026-06-13days on market $79,500 Active 32 DOM
-
2026-06-12days on market $79,500 Active 31 DOM
-
2026-06-09days on market $79,500 Active 28 DOM
-
2026-06-08days on market $79,500 Active 27 DOM
-
2026-06-07days on market $79,500 Active 26 DOM
-
2026-06-07days on market $79,500 Active 25 DOM
-
2026-06-04days on market $79,500 Active 22 DOM
-
2026-06-02days on market $79,500 Active 21 DOM
-
2026-06-01days on market $79,500 Active 20 DOM
-
2026-05-31days on market $79,500 Active 19 DOM
-
2026-05-31days on market $79,500 Active 18 DOM
-
2026-05-11$79,500 Active 473-char remark
-
2014-04-05soldstatus $27,500
ⓘ Source: listings_history table (triggers on properties + properties_extension) + one-shot
backfill from property_details.listing_events for pre-trigger history.
Tax reassessment forecast MI · Partial reset (capped growth)
- Current annual tax
- $300 · $25/mo
- Projected year-2 tax
- $762 · $63/mo
- Expected delta
- +$462/yr (+$39/mo · 154.3%)
ⓘ Screening estimate from a state-policy table — verify with the county assessor before closing.
Climate risk First Street
- Flood 1/10 Low FEMA zone X (unshaded) · 0% chance over 30 yrs
- Wildfire 5/10 Major
- Heat 1/10 Low 7 d/yr ≥92°F today · 14 d/yr by 30 yrs out
- Wind 1/10 Low
- Air quality 2/10 Low 0 unhealthy d/yr today · 1 by 30 yrs out
Nearby sold comps map
Loading sold comps map…
Walkable amenities ~0.75 mi
Loading nearby amenities…
Taxation est. · year 1
- Rental income
- $9,392
- − Mortgage interest
- −$4,453
- − Property taxes
- −$300
- − Insurance
- −$398
- − Repairs & maintenance
- −$751
- − Management
- −$751
- − Depreciation
- −$2,313
- Taxable income
- $426
- Est. tax owed @ 24.0%
- −$102
- After-tax cash flow
- $1,617/yr
For passive investors: Depreciation is non-cash, so a rental often shows a tax loss while cash-flowing — sheltering income. Rental losses are passive: they offset passive income freely, and up to $25,000/yr can offset ordinary (W-2) income if you actively participate and your MAGI is under $100k (phasing out to $0 by $150k); unused losses carry forward. On sale, claimed depreciation is recaptured at up to 25%, and gains may owe capital-gains tax (a 1031 exchange can defer both). Figures are a year-1 estimate at your 24.0% rate — not tax advice; consult a CPA.
Schools (NCES district)
- District
- Crawford Ausable Schools
- NCES district ID
- 2611030
- Math proficiency
- 43% ▼ -10.00%
- Reading proficiency
- 50% ▬ 0.00%
- Median HH income
- $40,396
- Composite
- 38.94/100
- National rank
- #4086
- State rank
- #140 of 540 in MI
Livability — Beaver Creek
No livability data for this city. (Only ~50 U.S. cities are tracked.)
Census & demographics
- Population (ZIP)
- 9,638
Population outlook (Crawford County) Hauer SSP2
- Today (2025)
- 13,042 people
- By 2030
- 12,520 · -4.0%
- By 2040
- 11,292 · -13.4%
- By 2050
- 10,157 · -22.1%
- By 2075
- 8,338 · -36.1%
- By 2100
- 6,765 · -48.1%
Race, ethnicity, and origin ACS 2023
- Neighborhood character
- Predominantly White (90%)
- Race & ethnicity
- White 90% Two or more races 7% Hispanic / Latino 3%
- Common ancestry
- Romanian 8% Lithuanian 7% Slovak 3%
- Foreign-born
- 1% · Canada, Vietnam
Political lean MEDSL · Crawford
- 2024 margin
- Solid R (+33.8) · D 32.5% · R 66.2% · Other 1.3%
- 2008→2024 swing
- -32.1pp toward R · 2008: -1.7pp · 2024: -33.8pp
- All cycles
- 2024: R+33.8 2020: R+30.7 2016: R+32.8 2012: R+11.0 2008: R+1.7
Not yet ingested
- Civics
- —
Market trends
- HPI YoY
- ▼ -118.03%
- Current HPI
- 222.4014
- Rent YoY
- —
- Metro
- —
- State GDP YoY
- ▲ 1.37%
- F500 in state
- 28
Industry mix (Fortune 500 HQ in MI)
| Industry | F500 HQs | Revenue |
|---|---|---|
| Automotive Parts | 3 | $48B |
|
||
| Automotive | 2 | $372B |
|
||
| Chemicals | 1 | $45B |
|
||
| Automotive Retail | 1 | $29B |
|
||
| Healthcare / Medical Devices | 1 | $23B |
|
||
| Automotive Technology | 1 | $20B |
|
||
Price history
+189.1% since first listed2 events — show timeline
- 2026-05-11 Listed $79,500 WWMLS
- 2014-04-05 Sold (Public Records) $27,500 Public Records
Property tax history
-4.5%/yrLatest (2025): $300 · -45.3% YoY. Source: county tax records.
Cash-flow waterfall
monthlySold comps — $/sqft
last 12 mo · ≤1 miLoading sold comps…