 🌊 Lakefront
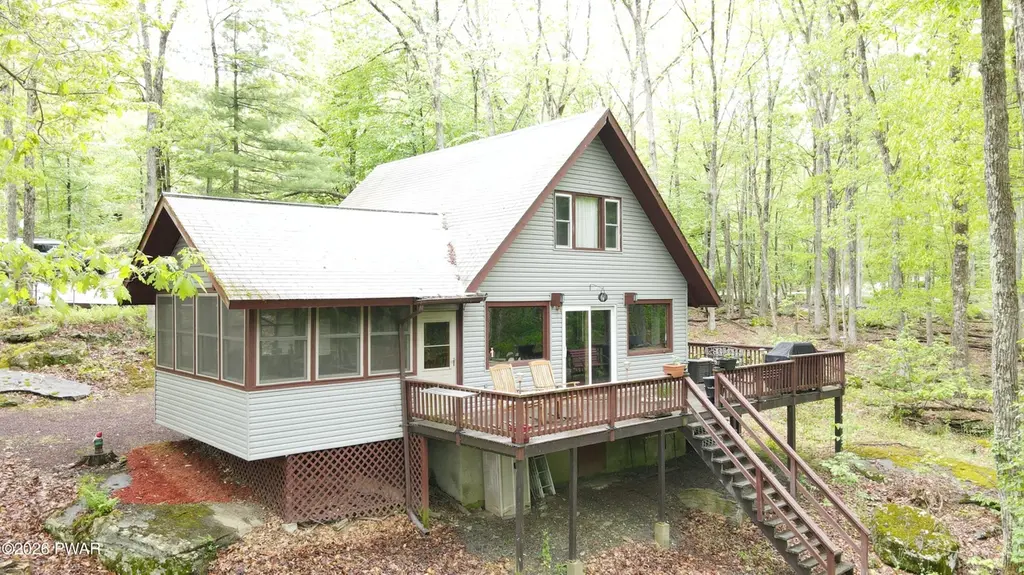
232 Basswood Dr · Hemlock Farms, PA
Flood risk 5/10 · Moderate
- FEMA flood zone
- X (unshaded)
- Chance of flooding over 30 yrs
- 0.65%
- Est. flood insurance / yr
- $473 – $860
Fire risk 4/10 · Minor
- Est. fire insurance / yr
- $511 – $949
Heat risk 2/10 · Minimal
- Hot days now (above 91°F)
- 7 days/yr
- Hot days in 30 yrs
- 15 days/yr
Wind risk 3/10 · Minor
- Chance of severe wind over 30 yrs
- 7.0%
Air-quality risk 2/10 · Minimal
- Unhealthy air days now
- 1 days/yr
- Unhealthy air days in 30 yrs
- 2 days/yr
Risk factors via First Street. Map © Google.
Why this score? — see what drove the C+ grade
The composite is a weighted blend of 9 inputs, each scored 0–100. Each bar is that input's sub-score; the figure is the points it added to the 100-point composite (weight × sub-score).
- Cash flow +22.3/30.0
- Appreciation +10.0/10.0
- DSCR +7.2/10.0
- 1% rule +6.2/10.0
- ARV discount +6.0/15.0
- Schools +4.2/10.0
- Livability +3.4/5.0
- Rent growth +2.5/5.0
- Condition / age +2.5/5.0
$295,000
🖨 Deal sheet 📄 Offer letter ✓ Due diligence
Listing remarks
Mountain Chalet Living in Hemlock Farms Community AssociationEscape to the beauty of the Poconos in this charming 3-bedroom, 2-bath chalet nestled on over a half-acre wooded lot. Priced at $295,000, this inviting home features a recently updated kitchen, soaring windows with peaceful forest views, and a spacious screened porch perfect for relaxing and enjoying nature year-round. Located just minutes from the community clubhouse, you'll enjoy resort-style amenities including an indoor pool, outdoor pools, fitness center, hot tub, steam room, sauna, pickleball and tennis courts, ball fields, lakefront beaches, and more. Whether you're looking for a full-time residence, vacation getaway, or in
Key facts
- Fitness center
- Outdoor pools
- Indoor pool
Tags
Property features AI
Finance
- Other: Subdivision: Hemlock Farms; Lot dimensions approximately 100' x 272' x 107' x 240' (0.57 acres); Private road frontage, 100' frontage length
- HOA & community: Homeowners association membership; Annual association fee; Association amenities include clubhouse, indoor pool, pool, tennis courts, basketball court, trails, playground, park, fitness center, spa/hot tub, sauna, game/billiard room, recreation room, recreation facilities, gated community, security, fitness/exercise course, dog park, picnic area, beach access/rights, pond year-round, fishing
Exterior
- Parking: Driveway; On-site parking
- Security: Smoke detectors
- Utilities: Public water; Septic tank; Electricity connected; Cable available and connected; Phone available; Water connected
- Home design: Single family house; Two levels; Entry from a screen porch; Updated/remodeled; Entry level: 1
- Construction: Frame construction with vinyl siding; Block foundation; Asphalt shingle roof; Built area above grade: 1,200 (finished area)
- Exterior features: Balcony; Private yard; Wooded and many trees; Sloped lot with views; Rock outcropping; Close to clubhouse; Private maintained asphalt road frontage; Has view
Interior
- Kitchen: Dishwasher; Microwave; Electric range; Refrigerator; Granite counters
- Bedrooms: Master downstairs
- Flooring: Tile; Wood; Vinyl
- Bathrooms: 1 full bathroom; 1 half bathroom
- Heating & cooling: Baseboard heating; Electric heating; Fireplace heating; Ceiling fans for cooling; Has cooling
- Interior features: Beamed ceilings; Granite counters; Ceiling fans; Master bedroom on main level; Living room wood-burning fireplace
- Laundry & utility: Washer; Dryer; Laundry closet; Electric water heater; Water heater
Neighborhood map
What this means for you Summary
Snapshot
- This is a 3-bed/1.5-bath single-family listed at $295k.
Deal economics
- At list price, monthly cash flow is $488 ($6k/yr) — positive.
- The deal already cash-flows at list — no discount required.
- Meets the 1% rule at list price ($3k rent vs $295k).
- Recommended offer: $291k (1.5% below list) — sets the bar for market timing.
Location & tenants
- Location reads 68/100 on livability (#884 in PA) — a middle-class / working-renter tenant base. Strengths: crime A+, housing A+, health & safety A+; Watch: schools C-, amenities F, commute F.
- Wallenpaupack Area SD (rural): math 39% / reading 59% proficiency, ranked #192 of 539 in PA (top 36%) — families likely to look elsewhere, expect single-tenant / working-renter base with shorter leases.
- Market conditions: 371 active listings in the ZIP; 2 comparable units currently listed for rent nearby; 213 units permitted in Pike County in 2024 (0 in 5+ unit buildings).
Forward outlook
- In year one you build about $32k of equity ($2k loan paydown + $30k appreciation (10.0% local appreciation)).
- Pike County population projected at -25% by 2050 — secular population decline; favor cash flow + early exit over multi-decade hold.
- At projected returns (10.0% appreciation + 3.0% rent growth), your $83k cash investment doubles in ~3 years — after that, you're playing with house money.
- By year 2, paydown + projected appreciation supports a ~$51k cash-out refi (75% LTV) — recoverable capital for the next deal without selling this one.
Negotiation context
- It's been on market 28 days — a 2% lower offer ($291k) is reasonable based on typical stale-listing flexibility.
- Current owner paid $86k; list at $295k implies a 243% gain — meaningful room to come down on a strong offer.
Risks & watch-outs
- Climate carrying-cost: moderate flood risk — expect insurance premiums to compound above CPI over the hold.
Questions for the listing agent
- Built in 1967 — when were the roof, HVAC, electrical panel, plumbing, and water heater last replaced?
- What does the HOA fee cover, when was the last increase, and are there any pending special assessments or reserve-fund shortfalls?
- Is there a deadline driving the sale (1031 exchange, divorce, estate, relocation)? That informs how much negotiation room exists.
- This sits on a lake — are riparian / water-frontage rights deeded with the parcel? Any dock permits, shoreline easements, or HOA water-use restrictions?
- What's the documented flood / surge / shoreline-erosion history here (FEMA AND non-FEMA — e.g., storm surge, creek backup, septic-field saturation)?
- Any water-quality or seasonal algae-bloom issues that affect tenant satisfaction or short-term-rental demand?
- What's the average days-on-market for RENTAL listings here right now (not sales)? A rising rental-DOM trend means longer vacancies and softer asking-rent achievability than the comps imply.
- What's the recent tenant-quality profile in this submarket — average credit score on applications, eviction rate, late-payment / NSF rate, and stable-employment percentage? A property-management company in the area should have these aggregated.
- How much new for-sale + rental construction is in the pipeline within 1–3 miles? Heavy new supply typically softens prices + rents 12–24 months out; constrained supply supports both.
Investment metrics
- 1% rule
- 1.12% ✓
- Cap rate
- 8.28%
- Cash-on-cash
- 7.09%
- DSCR
- 1.32
- GRM
- 7.4
CMA / ARV
- ARV (on-the-fly)
- $285,600
- Comps found
- 12
Show comp detail 12 sales within ~0.75 mi
| Address | Dist | Beds/Ba | Sqft | Sold | Price | $/sf | Match |
|---|---|---|---|---|---|---|---|
| 105 Tupelo Dr | 0.21mi | 3/2.0 | 1,215 (+1%) | 0mo | $360,000 | $296 | 86 |
| 800 Bluestone Ct N Unit 800 Bluestone Court North | 0.30mi | 3/2.0 | 1,202 (+0%) | 1mo | $276,000 | $230 | 83 |
| 111 Blueridge Ln | 0.31mi | 3/1.0 | 1,176 (-2%) | 9mo | $215,000 | $183 | 73 |
| 123 Basswood Ln E | 0.26mi | 3/2.0 | 1,320 (+10%) | 8mo | $512,500 | $388 | 62 |
| 806 Rimrock Ct | 0.63mi | 3/2.0 | 1,142 (-5%) | 4mo | $300,000 | $263 | 58 |
| 104 Ironwood Ln | 0.14mi | 3/2.0 | 1,032 (-14%) | 14mo | $260,000 | $252 | 56 |
| 304 Forest Dr | 0.48mi | 3/1.5 | 1,344 (+12%) | 2mo | $280,000 | $208 | 56 |
| 404 Forest Dr | 0.54mi | 3/1.0 | 1,085 (-10%) | 6mo | $270,000 | $249 | 52 |
| 801 Granite Ct S | 0.62mi | 3/2.0 | 1,305 (+9%) | 4mo | $283,000 | $217 | 51 |
| 304 Forest Drive Dr | 0.48mi | 3/1.5 | 1,344 (+12%) | 11mo | $181,000 | $135 | 48 |
| 807 Woodland Ct | 0.60mi | 2/1.5 (-1) | 1,058 (-12%) | 10mo | $215,000 | $203 | 39 |
| 107 Ridgeway Dr | 0.73mi | 3/2.0 | 1,083 (-10%) | 10mo | $257,500 | $238 | 39 |
Match score weights: distance 35% · size 25% · config 20% · recency 20%. Top-matched comps best support the ARV.
Projected returns pro-forma
10.0% appreciation · 3.0% rent growth · sell at horizon
- IRR
- 29.4%
- Equity multiple
- 3.32×
- Total profit
- $191,870
- Equity at exit
- $265,759
- IRR
- 25.6%
- Equity multiple
- 7.55×
- Total profit
- $540,776
- Equity at exit
- $573,120
Cash invested: $82,600 (down + closing). Projections, not guarantees.
Landlord ↔ Tenant lean methodology
- Overall (STATE)
- 62 Landlord-Friendly
- State Pennsylvania
- 62 Landlord-Friendly · EVEN
- County
- — inherits STATE
- City
- — inherits STATE
ZIP-level market 18428
- Home prices YoY
- 9.2%
- Active inventory
- 371
- Price-to-rent
- 7.4×
Monthly cashflow live
- Estimated rent
- $3,311 medium interval (Pro) →
- Mortgage (P&I)
- −$1,547
- Tax from tax record
- −$207 /mo · $2,489/yr
- Insurance
- −$123
- HOA
- −$250
- Vacancy / Maint / Mgmt
- −$695
- Net cashflow
- $488
Break-even live
UW: 25.0% down · 7.5% · 30yr · 1.5% tax · 5.0% vac · 8.0% maint · 8.0% mgmt
Financing live
Cash to close
- Down payment
- $73,750
- Closing costs
- $8,850
- Reserves months
- —
- Total cash needed
- —
Loan-product check · same deal, 3 products live
Conventional
25% down · 7.5% · 30yr
- Down + closing
- —
- Monthly P&I
- —
- Monthly cashflow
- —
- DSCR
- —
- Eligible?
- —
Personal DTI + credit; lowest rate.
DSCR
20% down · 8.5% · 30yr
- Down + closing
- —
- Monthly P&I
- —
- Monthly cashflow
- —
- DSCR
- —
- Eligible?
- —
No personal income docs; deal must DSCR.
Hard money
10% down · 12.0% · 12mo
- Down + closing
- —
- Monthly P&I
- —
- Monthly cashflow
- —
- DSCR
- —
- Eligible?
- —
Short-term bridge; refi at stabilization.
Rent comps 2 comps
| Address | Beds | Baths | Sqft | Rent | $/sqft | DOM | Units | Dist |
|---|---|---|---|---|---|---|---|---|
| 811 Hickory Ct Hawley, PA | 3.0 | 2.0 | 1100 | $2,500 | $2.27 | 1d | 1 | 0.23mi |
| 313 Forest Dr Blooming Grove, PA | 3.0 | 2.0 | 1200 | $5,000 | $4.17 | 1d | 1 | 0.51mi |
HOA detail
- Monthly dues
- $250 · $3,000/yr
- Likely covers
- poolgym
Listing history 17 events
-
2026-06-18days on market $295,000 Active 28 DOM
-
2026-06-17days on market $295,000 Active 27 DOM
-
2026-06-16days on market $295,000 Active 26 DOM
-
2026-06-15days on market $295,000 Active 25 DOM
-
2026-06-13days on market $295,000 Active 23 DOM
-
2026-06-13days on market $295,000 Active 22 DOM
-
2026-06-09days on market $295,000 Active 19 DOM
-
2026-06-08days on market $295,000 Active 18 DOM
-
2026-06-07days on market $295,000 Active 17 DOM
-
2026-06-04days on market $295,000 Active 14 DOM
-
2026-06-03days on market $295,000 Active 13 DOM
-
2026-06-02days on market $295,000 Active 12 DOM
-
2026-06-01days on market $295,000 Active 11 DOM
-
2026-05-31days on market $295,000 Active 10 DOM
-
2026-05-19$295,000 Active
-
2009-06-18soldstatus $86,000
-
1999-11-08soldstatus $66,000
ⓘ Source: listings_history table (triggers on properties + properties_extension) + one-shot
backfill from property_details.listing_events for pre-trigger history.
Tax reassessment forecast PA · Partial reset (capped growth)
- Current annual tax
- $2,489 · $207/mo
- Projected year-2 tax
- $3,575 · $298/mo
- Expected delta
- +$1,086/yr (+$91/mo · 43.6%)
ⓘ Screening estimate from a state-policy table — verify with the county assessor before closing.
Climate risk First Street
- Flood 5/10 Major FEMA zone X (unshaded) · 65% chance over 30 yrs
- Wildfire 4/10 Moderate
- Heat 2/10 Low 7 d/yr ≥91°F today · 15 d/yr by 30 yrs out
- Wind 3/10 Moderate 7% chance of damaging wind over 30 yrs
- Air quality 2/10 Low 1 unhealthy d/yr today · 2 by 30 yrs out
Nearby sold comps map
Loading sold comps map…
Walkable amenities ~0.75 mi
Loading nearby amenities…
Taxation est. · year 1
- Rental income
- $39,731
- − Mortgage interest
- −$16,525
- − Property taxes
- −$2,489
- − Insurance
- −$1,475
- − Repairs & maintenance
- −$3,178
- − Management
- −$3,178
- − HOA
- −$3,000
- − Depreciation
- −$8,582
- Taxable income
- $1,304
- Est. tax owed @ 24.0%
- −$313
- After-tax cash flow
- $5,547/yr
For passive investors: Depreciation is non-cash, so a rental often shows a tax loss while cash-flowing — sheltering income. Rental losses are passive: they offset passive income freely, and up to $25,000/yr can offset ordinary (W-2) income if you actively participate and your MAGI is under $100k (phasing out to $0 by $150k); unused losses carry forward. On sale, claimed depreciation is recaptured at up to 25%, and gains may owe capital-gains tax (a 1031 exchange can defer both). Figures are a year-1 estimate at your 24.0% rate — not tax advice; consult a CPA.
Schools (NCES district)
- District
- Wallenpaupack Area SD
- NCES district ID
- 4224750
- Math proficiency
- 39% ▼ -10.00%
- Reading proficiency
- 59% ▼ -5.00%
- Median HH income
- $51,027
- Composite
- 41.97/100
- National rank
- #3345
- State rank
- #192 of 539 in PA
Livability — Hemlock Farms
- Score
- 68/100
- State rank
- #884
- US rank
- #9421
Category grades
Schools grade is shown separately in the Schools card above.
Census & demographics
- Census place
- Hemlock Farms, PA
- Population (ZIP)
- 12,446
Population outlook (Pike County) Hauer SSP2
- Today (2025)
- 53,548 people
- By 2030
- 51,622 · -3.6%
- By 2040
- 46,490 · -13.2%
- By 2050
- 40,372 · -24.6%
- By 2075
- 31,951 · -40.3%
- By 2100
- 26,821 · -49.9%
Race, ethnicity, and origin ACS 2023
- Neighborhood character
- Predominantly White (85%)
- Race & ethnicity
- White 85% Hispanic / Latino 8% Two or more races 6% Black 1% Asian 1%
- Hispanic origin (detail)
- Puerto Rican 5%
- Common ancestry
- Romanian 5% Portuguese 3% Italian 2%
- Foreign-born
- 5% · Canada
- Languages at home
- 91% English-only · Spanish 5% Russian/Polish/Slavic 1% Other Asian/Pacific 1%
Political lean MEDSL · Pike
- 2024 margin
- Strong R (+24.1) · D 37.6% · R 61.6%
- 2008→2024 swing
- -19.8pp toward R · 2008: -4.2pp · 2024: -24.1pp
- All cycles
- 2024: R+24.1 2020: R+19.0 2016: R+26.0 2012: R+11.0 2008: R+4.2
Not yet ingested
- Civics
- —
Market trends
- HPI YoY
- ▲ 28.60%
- Current HPI
- 340.8254
- Rent YoY
- —
- Metro
- —
- State GDP YoY
- ▲ 1.68%
- F500 in state
- 34
Industry mix (Fortune 500 HQ in PA)
| Industry | F500 HQs | Revenue |
|---|---|---|
| Healthcare | 2 | $309B |
|
||
| Insurance | 2 | $27B |
|
||
| Telecommunications / Media | 1 | $124B |
|
||
| Industrial Distribution | 1 | $22B |
|
||
| Financial Services | 1 | $20B |
|
||
| Chemicals / Materials | 1 | $18B |
|
||
Price history
+347.0% since first listed3 events — show timeline
- 2026-05-19 Listed $295,000 PWMLS
- 2009-06-18 Sold (Public Records) $86,000 Public Records
- 1999-11-08 Sold (Public Records) $66,000 Public Records
Property tax history
+2.8%/yrLatest (2026): $2,489 · +3.0% YoY. Source: county tax records.
Cash-flow waterfall
monthlySold comps — $/sqft
last 12 mo · ≤1 miLoading sold comps…