141 E 3rd St Unit 3A · New York, NY
Flood risk 1/10 · Minimal
- FEMA flood zone
- X (unshaded)
- Chance of flooding over 30 yrs
- 0.0%
- Est. flood insurance / yr
- $507 – $1,088
Fire risk 1/10 · Minimal
- Est. fire insurance / yr
- $691 – $1,283
Heat risk 7/10 · Major
- Hot days now (above 99°F)
- 7 days/yr
- Hot days in 30 yrs
- 15 days/yr
Wind risk 6/10 · Moderate
- Chance of severe wind over 30 yrs
- 27.0%
Air-quality risk 4/10 · Minor
- Unhealthy air days now
- 5 days/yr
- Unhealthy air days in 30 yrs
- 7 days/yr
Risk factors via First Street. Map © Google.
Why this score? — see what drove the D grade
The composite is a weighted blend of 9 inputs, each scored 0–100. Each bar is that input's sub-score; the figure is the points it added to the 100-point composite (weight × sub-score).
- Appreciation +10.0/10.0
- ARV discount +7.5/15.0
- Schools +5.0/10.0
- Cash flow +4.6/30.0
- Rent growth +4.4/5.0
- Livability +3.8/5.0
- 1% rule +3.6/10.0
- Condition / age +2.5/5.0
- DSCR +0.0/10.0
$525,000
🖨 Deal sheet 📄 Offer letter ✓ Due diligence
Listing remarks
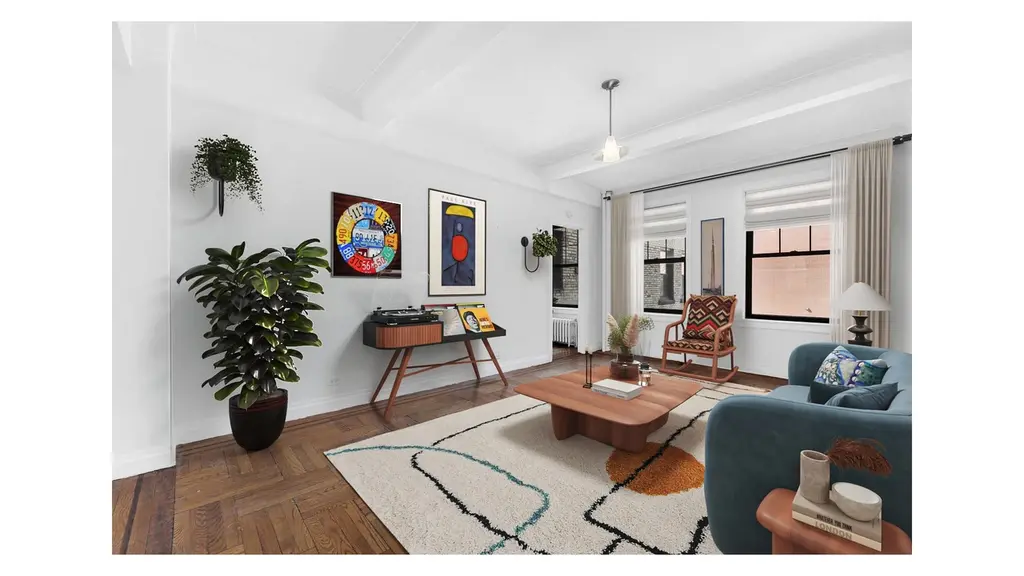
PLEASE REACH OUT AND LET ME KNOW YOU'RE COMING BY. Welcome to Residence 3A at 341 East 3rd Street, a one-bedroom co-op in Ageloff Towers, a pre-war building with a striking Art Deco lobby. The apartment features oversized west-facing windows, 9.5-foot ceilings, and Art Deco inlay floors. The living area accommodates both seating and dining. Beyond the entry foyer, the living space includes a vintage Pullman kitchen with a new stainless steel refrigerator and stove, plus a seating island with added storage. The bedroom fits a king-size bed and includes Jack-and-Jill closets. There are three closets total. The bathroom includes a soaking tub and is ready for your personal touch. Ageloff T
Key facts
- Roof deck
- Soaking tub
- Courtyard garden
Tags
Property features AI
Finance
- Other: Pets allowed in the building
- HOA & community: Monthly association fee
Exterior
- Home design: Located in a 12-story building; Entry on level 3; Building name: Ageloff Towers
- Exterior features: No notable exterior features listed; Zoned R7A
Interior
- Bedrooms: 3 total rooms (includes living space and bedrooms)
- Bathrooms: 1 full bathroom
- Interior features: Has a basement; Building offers storage, bike storage, common playroom, and game room; Has a view
- Laundry & utility: Building laundry
Neighborhood map
What this means for you Summary
Snapshot
- This is a 1-bed/1.0-bath condo listed at $525k.
Deal economics
- At list price, monthly cash flow is $-1k ($-16k/yr) — negative.
- To cash-flow at today's rent, offer at most $332k (36.7% below list).
- To meet the 1% rule (rent ≥ 1% of price), the offer needs to be $451k (14.1% below list).
- Recommended offer: $332k (36.7% below list) — sets the bar for cash-flow.
- Cap rate 3.3% vs local median 2.6% in New York — meaningfully above typical; check what's discounted (condition, days-on-market, listing class) to confirm the premium yield is real.
Location & tenants
- Location reads 75/100 on livability (#268 in NY, #4,188 nationally) — a middle-class / working-renter tenant base. Strengths: amenities A+, commute A+, health & safety A; Watch: crime F, cost of living F.
- Market conditions: Rents rising fast (+7.5%/yr); 87 active listings in the ZIP; 40 comparable units currently listed for rent nearby; rentals leasing fast (median 6d on market — plan ~1-2 weeks tenant-placement turnaround); solid renter incomes; 4,467 units permitted in New York County in 2024 (4,463 in 5+ unit buildings).
- At $4,510/mo this rent would consume 58% of the median local household income ($93k/yr) (locally 5275% of renters already pay >50% of income on rent) — very limited rent-growth headroom before tenants either downsize or default.
Forward outlook
- In year one you build about $56k of equity ($4k loan paydown + $52k appreciation (10.0% local appreciation)).
- New York County population projected at +21% by 2050 — long-run rental-demand tailwind backs the buy-and-hold thesis.
- By year 2, paydown + projected appreciation supports a ~$90k cash-out refi (75% LTV) — recoverable capital for the next deal without selling this one.
Negotiation context
- It's been on market 83 days — a 6% lower offer ($494k) is reasonable based on typical stale-listing flexibility.
Risks & watch-outs
- Watch-outs: HOA is 28% of rent; built in 1929 — expect roof / HVAC / electrical / plumbing capex.
- Climate carrying-cost: major wind risk, 27% chance of damaging wind over 30y; extreme-heat days projected 7→15/yr by 2055 (HVAC capex compounding) — expect insurance premiums to compound above CPI over the hold.
Questions for the listing agent
- What do current leases actually rent for vs. the listed asking? Can we see a recent rent roll and the last 12 months of T-12 income?
- It's been on market 83 days. Have you received any prior offers? Is the seller open to a 37% concession, seller financing, or rate buy-down credit?
- Built in 1929 — when were the roof, HVAC, electrical panel, plumbing, and water heater last replaced?
- What does the HOA fee cover, when was the last increase, and are there any pending special assessments or reserve-fund shortfalls?
- Any open or pending special assessments — roof, HVAC, plumbing, elevator, façade? What's the per-unit balance and payoff schedule, and is the seller paying it off at close or rolling it to the buyer?
- Why hasn't it sold? Are there any deal-killer items the seller is aware of (foundation, flood, title, zoning, code violations)?
- Is there a deadline driving the sale (1031 exchange, divorce, estate, relocation)? That informs how much negotiation room exists.
- Schools are B-rated — typically a magnet for longer-tenancy family renters. What's the average tenant stay here, and is there a school-zone premium baked into asking?
- Crime grade is F in this area — have there been break-ins, vandalism, or insurance claims at this property in the last 3 years? What carrier currently insures it and at what premium?
- The area grade is low — what's the realistic commute time and amenity access for the typical tenant pool here? Any planned neighborhood developments (good or bad) we should know about?
- What's the average days-on-market for RENTAL listings here right now (not sales)? A rising rental-DOM trend means longer vacancies and softer asking-rent achievability than the comps imply.
- What's the recent tenant-quality profile in this submarket — average credit score on applications, eviction rate, late-payment / NSF rate, and stable-employment percentage? A property-management company in the area should have these aggregated.
- How much new apartment / multifamily construction is in the pipeline within 1–3 miles? Heavy new supply (>2% of stock underway) typically softens rents 12–24 months out; light construction supports rent growth.
Investment metrics
- 1% rule
- 0.86% ✗
- Cap rate
- 3.25%
- Cash-on-cash
- -10.86%
- DSCR
- 0.52
- GRM
- 9.7
CMA / ARV
No comps found within radius.
Projected returns pro-forma
10.0% appreciation · 7.48% rent growth · sell at horizon
- IRR
- 18.3%
- Equity multiple
- 2.52×
- Total profit
- $223,281
- Equity at exit
- $472,962
- IRR
- 18.4%
- Equity multiple
- 6.29×
- Total profit
- $777,421
- Equity at exit
- $1,019,960
Cash invested: $147,000 (down + closing). Projections, not guarantees.
Landlord ↔ Tenant lean methodology
- Overall (CITY)
- 0 Strongly Tenant-Friendly
- State New York
- 15 Strongly Tenant-Friendly · D+10
- County
- — inherits STATE
- City New York
- 0 Strongly Tenant-Friendly · D+34
ZIP-level market 10009
- Home prices YoY
- 2.2%
- Rents YoY
- 7.5%
- Active inventory
- 87
- Price-to-rent
- 9.7×
Monthly cashflow live
- Estimated rent
- $4,510 medium interval (Pro) →
- Mortgage (P&I)
- −$2,753
- Tax est. 1.5%
- −$656 /mo · $7,875/yr
- Insurance
- −$219
- HOA
- −$1,265
- Vacancy / Maint / Mgmt
- −$947
- Net cashflow
- $-1,330
Break-even live
UW: 25.0% down · 7.5% · 30yr · 1.5% tax · 5.0% vac · 8.0% maint · 8.0% mgmt
Financing live
Cash to close
- Down payment
- $131,250
- Closing costs
- $15,750
- Reserves months
- —
- Total cash needed
- —
Loan-product check · same deal, 3 products live
Conventional
25% down · 7.5% · 30yr
- Down + closing
- —
- Monthly P&I
- —
- Monthly cashflow
- —
- DSCR
- —
- Eligible?
- —
Personal DTI + credit; lowest rate.
DSCR
20% down · 8.5% · 30yr
- Down + closing
- —
- Monthly P&I
- —
- Monthly cashflow
- —
- DSCR
- —
- Eligible?
- —
No personal income docs; deal must DSCR.
Hard money
10% down · 12.0% · 12mo
- Down + closing
- —
- Monthly P&I
- —
- Monthly cashflow
- —
- DSCR
- —
- Eligible?
- —
Short-term bridge; refi at stabilization.
Rent comps 40 comps
| Address | Beds | Baths | Sqft | Rent | $/sqft | DOM | Units | Dist |
|---|---|---|---|---|---|---|---|---|
| 171 Suffolk St #1265 New York, NY | 1.0–2.0 | 1.0 | 650 | $6,950 | $10.69 | 7d | 2 | 0.18mi |
| 93 1/2 E 7th St Unit 1054297P New York, NY | 2.0 | 1.0 | 495 | $10,000 | $20.20 | 22d | 1 | 0.20mi |
| 229 Chrystie St New York, NY | 1.0–2.0 | 1.0–2.0 | 810 | $6,120 | $7.56 | 4d | 3 | 0.34mi |
| 11 E 1st St New York, NY | 2.0 | 1.0–2.0 | 1060 | $8,078 | $7.62 | 1d | 1 | 0.36mi |
| 125 Delancey St #1523 New York, NY | 1.0–2.0 | 1.0–2.0 | 850 | $7,860 | $9.25 | 1d | 2 | 0.43mi |
| 209 1st Ave Unit 1370708P New York, NY | 1.0 | 1.0 | 602 | $12,000 | $19.93 | 24d | 1 | 0.46mi |
| 112 E 10th St Unit 1021937P New York, NY | 1.0–3.0 | 1.0–2.5 | 1296 | $5,772 | $4.45 | 3d | 2 | 0.47mi |
| 180 Broome St #1521 New York, NY | 1.0–2.0 | 1.0–2.0 | 850 | $7,970 | $9.38 | 1d | 2 | 0.48mi |
| 101 E 10th St #1153 New York, NY | 1.0–2.0 | 1.0–2.0 | 575 | $6,740 | $11.72 | 1d | 2 | 0.51mi |
| 346 E 18th St Unit 1254596P New York, NY | 2.0 | 2.0 | 699 | $12,979 | $18.57 | 22d | 1 | 0.71mi |
| 815 Broadway #204 New York, NY | 1.0 | 1.0 | 522 | $8,250 | $15.80 | 7d | 1 | 0.71mi |
| 1 Union Sq S #1174 New York, NY | 2.0 | 1.0–2.0 | 775 | $10,120 | $13.06 | 10d | 3 | 0.75mi |
| 120 Mulberry St Unit 1257050P New York, NY | 2.0 | 1.0 | 645 | $12,372 | $19.18 | 24d | 1 | 0.80mi |
| 250 E 21st St Unit 8D New York, NY | 1.0 | 1.0 | 688 | $9,525 | $13.84 | 2d | 1 | 0.88mi |
| 104 MacDougal St Unit 1056263P New York, NY | 2.0 | 1.0 | 441 | $9,375 | $21.26 | 22d | 1 | 0.91mi |
| 364 6th Ave Unit 1023432P New York, NY | 1.0 | 1.0 | 441 | $9,135 | $20.71 | 22d | 1 | 0.99mi |
| 10 Downing St #131 New York, NY | 1.0 | 1.0 | 731 | $9,050 | $12.38 | 4d | 2 | 1.00mi |
| 290 3rd Ave #279 New York, NY | 1.0 | 1.0 | 607 | $9,740 | $16.03 | 3d | 2 | 1.01mi |
| 20 Waterside Plz #978 New York, NY | 1.0 | 1.0 | 682 | $4,760 | $6.98 | 6d | 1 | 1.08mi |
| 177 Waverly Pl Unit 1075286P New York, NY | 1.0 | 1.0 | 452 | $10,000 | $22.12 | 24d | 1 | 1.10mi |
| 111 Worth St New York, NY | 1.0–2.0 | 1.0–2.0 | 747 | $6,077 | $8.14 | 7d | 7 | 1.11mi |
| 88 Leonard St New York, NY | 1.0 | 1.0 | 598 | $7,966 | $13.32 | 7d | 13 | 1.14mi |
| 30 Waterside Plz New York, NY | 2.0 | 1.0–2.0 | 743 | $5,218 | $7.02 | 1d | 33 | 1.15mi |
| 108 W 15th St #205 New York, NY | 1.0–2.0 | 1.0 | 697 | $6,050 | $8.67 | 3d | 2 | 1.16mi |
| 101 W 15th St New York, NY | 1.0 | 1.0 | 562 | $9,550 | $16.98 | 1d | 2 | 1.17mi |
| 187 Kent Ave #1730 Brooklyn, NY | 1.0 | 1.0 | 500 | $5,750 | $11.50 | 6d | 1 | 1.17mi |
| 52 Barrow St #2123 New York, NY | 1.0–2.0 | 1.0 | 547 | $6,420 | $11.73 | 10d | 3 | 1.17mi |
| 130 W 15th St #1383 New York, NY | 1.0–2.0 | 1.0–2.0 | 844 | $9,200 | $10.90 | 1d | 2 | 1.19mi |
| 105 Duane St #183 New York, NY | 2.0 | 1.0–2.0 | 821 | $9,000 | $10.96 | 1d | 3 | 1.24mi |
| 120 Christopher St #1886 New York, NY | 1.0–2.0 | 1.0 | 574 | $5,680 | $9.89 | 1d | 3 | 1.25mi |
| 87 Perry St New York, NY | 2.0 | 2.0 | 748 | $18,500 | $24.73 | 24d | 1 | 1.30mi |
| 139 Christopher St Unit 1021914P New York, NY | 1.0–2.0 | 1.0 | 667 | $5,340 | $8.01 | 7d | 2 | 1.32mi |
| 120 W 21st St New York, NY | 2.0 | 1.0–2.0 | 676 | $7,070 | $10.46 | 4d | 14 | 1.34mi |
| 535 Hudson St #1032 New York, NY | 1.0–2.0 | 1.0 | 550 | $6,030 | $10.96 | 7d | 2 | 1.34mi |
| 68 Gold St New York, NY | 1.0–2.0 | 1.0 | 700 | $3,610 | $5.16 | 24d | 2 | 1.35mi |
| 290 W 12th St #1592 New York, NY | 1.0–2.0 | 1.0–2.0 | 515 | $7,110 | $13.81 | 7d | 2 | 1.37mi |
| 180 W 20th St #1202 New York, NY | 2.0 | 1.0–2.0 | 791 | $9,505 | $12.01 | 1d | 3 | 1.38mi |
| 140 Charles St Unit 14A New York, NY | 1.0 | 1.0 | 648 | $8,000 | $12.35 | 7d | 1 | 1.38mi |
| 11 Wharf Way Brooklyn, NY | 1.0 | 1.0 | 610 | $4,870 | $7.98 | 1d | 2 | 1.39mi |
| 478 Kent Ave Brooklyn, NY | 2.0 | 1.0–2.0 | 775 | $5,920 | $7.64 | 2d | 3 | 1.41mi |
HOA detail condo
- Monthly dues
- $1,265 · $15,180/yr
- Assessments
- None detected in remarks — confirm with the listing agent.
Listing history 13 events
-
2026-06-18days on market $525,000 Active 83 DOM
-
2026-06-17days on market $525,000 Active 82 DOM
-
2026-06-15days on market $525,000 Active 80 DOM
-
2026-06-13days on market $525,000 Active 78 DOM
-
2026-06-10days on market $525,000 Active 74 DOM
-
2026-06-08days on market $525,000 Active 73 DOM
-
2026-06-08days on market $525,000 Active 72 DOM
-
2026-06-04days on market $525,000 Active 69 DOM
-
2026-06-03days on market $525,000 Active 68 DOM
-
2026-06-01days on market $525,000 Active 66 DOM
-
2026-05-31days on market $525,000 Active 65 DOM
-
2026-03-27$525,000 Active
-
2025-07-08price $599,000
ⓘ Source: listings_history table (triggers on properties + properties_extension) + one-shot
backfill from property_details.listing_events for pre-trigger history.
Climate risk First Street
- Flood 1/10 Low FEMA zone X (unshaded) · 0% chance over 30 yrs
- Wildfire 1/10 Low
- Heat 7/10 Severe 7 d/yr ≥99°F today · 15 d/yr by 30 yrs out
- Wind 6/10 Major 27% chance of damaging wind over 30 yrs
- Air quality 4/10 Moderate 5 unhealthy d/yr today · 7 by 30 yrs out
Nearby sold comps map
Loading sold comps map…
Walkable amenities ~0.75 mi
Loading nearby amenities…
Taxation est. · year 1
- Rental income
- $54,117
- − Mortgage interest
- −$29,408
- − Property taxes
- −$7,875
- − Insurance
- −$2,625
- − Repairs & maintenance
- −$4,329
- − Management
- −$4,329
- − HOA
- −$15,180
- − Depreciation
- −$15,273
- Taxable loss
- −$24,903
- Est. tax savings @ 24.0%
- +$5,977
- After-tax cash flow
- $-9,989/yr
For passive investors: Depreciation is non-cash, so a rental often shows a tax loss while cash-flowing — sheltering income. Rental losses are passive: they offset passive income freely, and up to $25,000/yr can offset ordinary (W-2) income if you actively participate and your MAGI is under $100k (phasing out to $0 by $150k); unused losses carry forward. On sale, claimed depreciation is recaptured at up to 25%, and gains may owe capital-gains tax (a 1031 exchange can defer both). Figures are a year-1 estimate at your 24.0% rate — not tax advice; consult a CPA.
Schools (NCES district)
No district data.
Livability — New York
- Score
- 75/100
- State rank
- #268
- US rank
- #4188
Category grades
Schools grade is shown separately in the Schools card above.
Census & demographics
- Census place
- New York, NY
- County
- New York County · 1,599,927 people
- City population
- 7,731,280
- Metro
- New York-Newark-Jersey City, NY-NJ-PA
- Population (ZIP)
- 60,209
- Household income
- $92,876
- Rent vs Own
- Severe rent burden
- 5275.0
Population outlook (New York County) Hauer SSP2
- Today (2025)
- 1,825,725 people
- By 2030
- 1,904,611 · +4.3%
- By 2040
- 2,052,719 · +12.4%
- By 2050
- 2,206,601 · +20.9%
- By 2075
- 2,509,427 · +37.4%
- By 2100
- 2,702,933 · +48.0%
Race, ethnicity, and origin ACS 2023
- Neighborhood character
- Diverse neighborhood (Simpson 0.66)
- Race & ethnicity
- White 51% Hispanic / Latino 24% Asian 13% Two or more races 11% Black 8%
- Hispanic origin (detail)
- Mexican 1% Puerto Rican 11% Cuban 2% Dominican 5%
- Common ancestry
- Romanian 3% Subsaharan African 2% Scotch-Irish 2%
- Foreign-born
- 25% · China, Canada, Jamaica
- Languages at home
- 64% English-only · Spanish 18% Chinese 8% Other Indo-European 3%
Political lean MEDSL · New York
- 2024 margin
- Solid D (+64.8) · D 82.4% · R 17.6%
- 2008→2024 swing
- -7.4pp toward R · 2008: 72.2pp · 2024: 64.8pp
- All cycles
- 2024: D+64.8 2020: D+74.5 2016: D+77.2 2012: D+69.6 2008: D+72.2
Not yet ingested
- Civics
- —
Market trends
- HPI YoY
- ▲ 10.20%
- Current HPI
- 473.6656
- Rent YoY
- ▲ 7.48%
- Metro
- New York-Newark-Jersey City, NY-NJ-PA
- State GDP YoY
- ▲ 2.60%
- F500 in state
- 92
Industry mix (Fortune 500 HQ in NY)
| Industry | F500 HQs | Revenue |
|---|---|---|
| Financial Services | 10 | $950B |
|
||
| Consumer Goods | 9 | $162B |
|
||
| Insurance | 4 | $225B |
|
||
| Telecommunications | 2 | $144B |
|
||
| Pharmaceuticals | 2 | $112B |
|
||
| Media / Entertainment | 2 | $69B |
|
||
Price history
-12.4% since first listed2 events — show timeline
- 2026-03-27 Listed $525,000 RLS at REBNY
- 2025-07-08 Price Changed $599,000 RLS at REBNY
Cash-flow waterfall
monthlySold comps — $/sqft
last 12 mo · ≤1 miLoading sold comps…