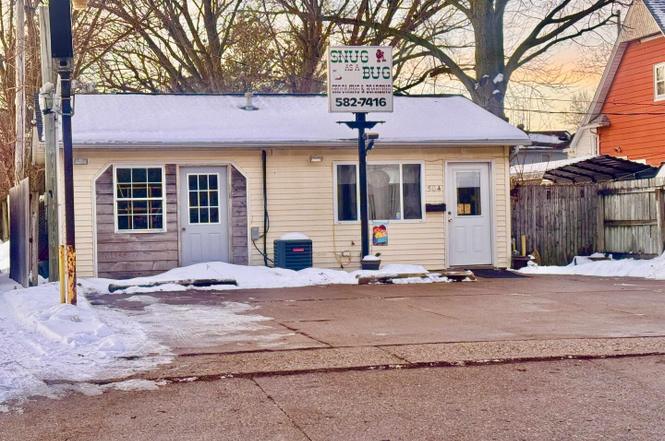
504 SE 3rd St St · Aledo, IL
Flood risk 1/10 · Minimal
- FEMA flood zone
- X (unshaded)
- Chance of flooding over 30 yrs
- 0.0%
- Est. flood insurance / yr
- $507 – $1,088
Fire risk 1/10 · Minimal
- Est. fire insurance / yr
- $804 – $1,492
Heat risk 3/10 · Minor
- Hot days now (above 105°F)
- 7 days/yr
- Hot days in 30 yrs
- 16 days/yr
Wind risk 2/10 · Minimal
- Chance of severe wind over 30 yrs
- —
Air-quality risk 2/10 · Minimal
- Unhealthy air days now
- 2 days/yr
- Unhealthy air days in 30 yrs
- 2 days/yr
Risk factors via First Street. Map © Google.
Why this score? — see what drove the C grade
The composite is a weighted blend of 9 inputs, each scored 0–100. Each bar is that input's sub-score; the figure is the points it added to the 100-point composite (weight × sub-score).
- Cash flow +28.5/30.0
- DSCR +10.0/10.0
- 1% rule +7.9/10.0
- Livability +3.5/5.0
- Rent growth +2.5/5.0
- Condition / age +2.5/5.0
- Schools +1.7/10.0
- ARV discount +1.6/15.0
- Appreciation +0.0/10.0
$55,000
🖨 Deal sheet 📄 Offer letter ✓ Due diligence
Listing remarks
This adorable building has been home to many different businesses over the years. This property is full of potential and looking for a new owner! While this building is currently set up as a dog groomer, it could easily be converted into any type of business or ever converted back into a residential home. Let your imagination explore the possibilities! Schedule a private showing today!
Key facts
- 2,400 sq ft lot
- Built 2003
- Listed 89 days
Property features AI
Finance
- Financial info: No special service area
Exterior
- Parking: No garage
- Utilities: Public water; Public sewer; 100 amp electric service
- Home design: Detached single-family home; One-story
- Construction: Vinyl siding; Other foundation; Built approximately 21–25 years ago
- Exterior features: Level lot; Lot dimensions approximately 60 x 40; Lot smaller than 0.25 acre
Interior
- Kitchen: Main-level kitchen
- Bedrooms: 1 bedroom (Main level)
- Flooring: Other flooring (kitchen and bedroom)
- Bathrooms: 1 full bathroom
- Heating & cooling: Forced air heating; Central air conditioning
- Interior features: Basement with egress window; School bus service
Neighborhood map
What this means for you Summary
Snapshot
- This is a 1-bed/1.0-bath single-family listed at $55k.
Deal economics
- At list price, monthly cash flow is $179 ($2k/yr) — positive.
- The deal already cash-flows at list — no discount required.
- Meets the 1% rule at list price ($708 rent vs $55k).
- Recommended offer: $52k (6.0% below list) — sets the bar for market timing.
Location & tenants
- Location reads 69/100 on livability (#390 in IL) — a middle-class / working-renter tenant base. Strengths: crime A+, cost of living A+, housing A+; Watch: schools D-, amenities F, commute F.
- Mercer County School District 404 (town): math 14% / reading 24% proficiency, ranked #439 of 620 in IL (top 71%) — low school quality limits family demand, transient renter base, plan for 1-2y turnover.
- Market conditions: 41 active listings in the ZIP; 5 comparable units currently listed for rent nearby; rentals lingering (median 44d on market — plan ~5-8 weeks vacancy on turnover, expect pricing pressure); 60% of comp listings sitting > 30 days — soft ceiling on asking rent; 15 units permitted in Mercer County in 2024 (0 in 5+ unit buildings).
Forward outlook
- Local home prices are declining (-3.0%/yr); year-one equity from $380 of loan paydown is wiped out by about $2k of value loss. Plan a longer hold.
- Mercer County population projected at -25% by 2050 — secular population decline; favor cash flow + early exit over multi-decade hold.
- At projected returns (-3.0% appreciation + 3.0% rent growth), your $15k cash investment doubles in ~9 years — after that, you're playing with house money.
Negotiation context
- It's been on market 89 days — a 6% lower offer ($52k) is reasonable based on typical stale-listing flexibility.
- 3 sale attempts with the ask held roughly flat each time — persistent listings suggest the price (not the market) is what's stuck; bring a comps-based counter.
Questions for the listing agent
- It's been on market 89 days. Have you received any prior offers? Is the seller open to a 6% concession, seller financing, or rate buy-down credit?
- Why hasn't it sold? Are there any deal-killer items the seller is aware of (foundation, flood, title, zoning, code violations)?
- Is there a deadline driving the sale (1031 exchange, divorce, estate, relocation)? That informs how much negotiation room exists.
- Schools are D-rated, which usually means shorter tenancies and higher turnover. Who's the typical renter profile here, and what's been the actual vacancy rate?
- What's the average days-on-market for RENTAL listings here right now (not sales)? A rising rental-DOM trend means longer vacancies and softer asking-rent achievability than the comps imply.
- What's the recent tenant-quality profile in this submarket — average credit score on applications, eviction rate, late-payment / NSF rate, and stable-employment percentage? A property-management company in the area should have these aggregated.
- How much new for-sale + rental construction is in the pipeline within 1–3 miles? Heavy new supply typically softens prices + rents 12–24 months out; constrained supply supports both.
Investment metrics
- 1% rule
- 1.29% ✓
- Cap rate
- 10.21%
- Cash-on-cash
- 13.98%
- DSCR
- 1.62
- GRM
- 6.5
CMA / ARV
- ARV (on-the-fly)
- $48,664
- Comps found
- 1
Show comp detail 1 sale within ~0.75 mi
| Address | Dist | Beds/Ba | Sqft | Sold | Price | $/sf | Match |
|---|---|---|---|---|---|---|---|
| 504 SE 3rd St St | 0.00mi | 1/1.0 | 616 (0%) | 3mo | $48,500 | $79 | 97 |
Match score weights: distance 35% · size 25% · config 20% · recency 20%. Top-matched comps best support the ARV.
Projected returns pro-forma
-3.0% appreciation · 3.0% rent growth · sell at horizon
- IRR
- 4.2%
- Equity multiple
- 1.16×
- Total profit
- $2,525
- Equity at exit
- $8,201
- IRR
- 13.7%
- Equity multiple
- 2.10×
- Total profit
- $16,957
- Equity at exit
- $4,755
Cash invested: $15,400 (down + closing). Projections, not guarantees.
Landlord ↔ Tenant lean methodology
- Overall (STATE)
- 43 Moderately Tenant-Leaning
- State Illinois
- 43 Moderately Tenant-Leaning · D+7
- County
- — inherits STATE
- City
- — inherits STATE
ZIP-level market 61231
- Home prices YoY
- -33.0%
- Active inventory
- 41
- Price-to-rent
- 6.5×
Monthly cashflow live
- Estimated rent
- $708 high interval (Pro) →
- Mortgage (P&I)
- −$288
- Tax est. 1.5%
- −$69 /mo · $825/yr
- Insurance
- −$23
- HOA
- −$0
- Vacancy / Maint / Mgmt
- −$149
- Net cashflow
- $179
Break-even live
UW: 25.0% down · 7.5% · 30yr · 1.5% tax · 5.0% vac · 8.0% maint · 8.0% mgmt
Financing live
Cash to close
- Down payment
- $13,750
- Closing costs
- $1,650
- Reserves months
- —
- Total cash needed
- —
Loan-product check · same deal, 3 products live
Conventional
25% down · 7.5% · 30yr
- Down + closing
- —
- Monthly P&I
- —
- Monthly cashflow
- —
- DSCR
- —
- Eligible?
- —
Personal DTI + credit; lowest rate.
DSCR
20% down · 8.5% · 30yr
- Down + closing
- —
- Monthly P&I
- —
- Monthly cashflow
- —
- DSCR
- —
- Eligible?
- —
No personal income docs; deal must DSCR.
Hard money
10% down · 12.0% · 12mo
- Down + closing
- —
- Monthly P&I
- —
- Monthly cashflow
- —
- DSCR
- —
- Eligible?
- —
Short-term bridge; refi at stabilization.
Rent comps 5 comps
| Address | Beds | Baths | Sqft | Rent | $/sqft | DOM | Units | Dist |
|---|---|---|---|---|---|---|---|---|
| 107 N College Ave Unit 109 A Aledo, IL | 2.0 | 1.0 | 611 | $850 | $1.39 | 21d | 1 | 0.32mi |
| 127 W Main St Unit Main Aledo, IL | — | 1.0 | 600 | $575 | $0.96 | 43d | 1 | 0.33mi |
| 607 NE 3rd Ave Apt 5 Aledo, IL | 1.0 | 1.0 | 415 | $685 | $1.65 | 43d | 1 | 0.49mi |
| 407 SW 8th St Unit 405 Aledo, IL | 2.0 | 1.0 | 550 | $685 | $1.25 | 13d | 1 | 0.59mi |
| 804 SW 4th St Apt 6 Aledo, IL | 2.0 | 1.0 | 750 | $725 | $0.97 | 43d | 1 | 0.73mi |
Listing history 7 events
-
2026-05-23$55,000 Active
-
2026-03-18soldstatus Closed
-
2026-02-04historical Contingent - Continue to Show
-
2026-01-08status Active
-
2026-01-06historical
-
2026-01-05historical
-
2025-12-17Active
ⓘ Source: listings_history table (triggers on properties + properties_extension) + one-shot
backfill from property_details.listing_events for pre-trigger history.
Climate risk First Street
- Flood 1/10 Low FEMA zone X (unshaded) · 0% chance over 30 yrs
- Wildfire 1/10 Low
- Heat 3/10 Moderate 7 d/yr ≥105°F today · 16 d/yr by 30 yrs out
- Wind 2/10 Low
- Air quality 2/10 Low 2 unhealthy d/yr today · 2 by 30 yrs out
Nearby sold comps map
Loading sold comps map…
Walkable amenities ~0.75 mi
Loading nearby amenities…
Taxation est. · year 1
- Rental income
- $8,499
- − Mortgage interest
- −$3,081
- − Property taxes
- −$825
- − Insurance
- −$275
- − Repairs & maintenance
- −$680
- − Management
- −$680
- − Depreciation
- −$1,600
- Taxable income
- $1,358
- Est. tax owed @ 24.0%
- −$326
- After-tax cash flow
- $1,827/yr
For passive investors: Depreciation is non-cash, so a rental often shows a tax loss while cash-flowing — sheltering income. Rental losses are passive: they offset passive income freely, and up to $25,000/yr can offset ordinary (W-2) income if you actively participate and your MAGI is under $100k (phasing out to $0 by $150k); unused losses carry forward. On sale, claimed depreciation is recaptured at up to 25%, and gains may owe capital-gains tax (a 1031 exchange can defer both). Figures are a year-1 estimate at your 24.0% rate — not tax advice; consult a CPA.
Schools (NCES district)
- District
- Mercer County School District 404
- NCES district ID
- 1701395
- Math proficiency
- 14% ▼ -5.00%
- Reading proficiency
- 24% ▼ -9.00%
- Median HH income
- $46,980
- Composite
- 16.76/100
- National rank
- #9158
- State rank
- #439 of 620 in IL
Livability — Aledo
- Score
- 69/100
- State rank
- #390
- US rank
- #8198
Category grades
Schools grade is shown separately in the Schools card above.
Census & demographics
- Census place
- Aledo, IL
- Population (ZIP)
- 4,958
Population outlook (Mercer County) Hauer SSP2
- Today (2025)
- 14,595 people
- By 2030
- 13,846 · -5.1%
- By 2040
- 12,335 · -15.5%
- By 2050
- 10,893 · -25.4%
- By 2075
- 8,238 · -43.6%
- By 2100
- 6,111 · -58.1%
Race, ethnicity, and origin ACS 2023
- Neighborhood character
- Predominantly White (93%)
- Race & ethnicity
- White 93% Hispanic / Latino 4% Two or more races 3% Black 1%
- Common ancestry
- Lithuanian 2% Danish 2% Iranian 1%
- Foreign-born
- 1% · Canada
- Languages at home
- 96% English-only · Spanish 3% Arabic 1%
Political lean MEDSL · Mercer
- 2024 margin
- Strong R (+27.1) · D 35.4% · R 62.5% · Other 2.2%
- 2008→2024 swing
- -39.0pp toward R · 2008: 11.9pp · 2024: -27.1pp
- All cycles
- 2024: R+27.1 2020: R+24.0 2016: R+20.7 2012: D+7.4 2008: D+11.9
Not yet ingested
- Civics
- —
Market trends
- HPI YoY
- ▼ -69.03%
- Current HPI
- 140.0
- Rent YoY
- —
- Metro
- —
- State GDP YoY
- ▲ 1.59%
- F500 in state
- 60
Industry mix (Fortune 500 HQ in IL)
| Industry | F500 HQs | Revenue |
|---|---|---|
| Insurance | 4 | $201B |
|
||
| Consumer Goods | 4 | $87B |
|
||
| Industrial Machinery | 3 | $64B |
|
||
| Healthcare | 2 | $55B |
|
||
| Retail / Pharmacy | 1 | $148B |
|
||
| Agriculture / Food | 1 | $86B |
|
||
Price history
7 events — show timeline
- 2026-05-23 Listed $55,000 MRED as Distributed by MLS Grid
- 2026-03-18 Sold (MLS) — MRED as Distributed by MLS Grid
- 2026-02-04 Contingent — MRED as Distributed by MLS Grid
- 2026-01-08 Relisted — MRED as Distributed by MLS Grid
- 2026-01-06 Listing Removed — RMLSA as Distributed by MLS Grid
- 2026-01-05 Listing Removed — MRED as Distributed by MLS Grid
- 2025-12-17 Listed — RMLSA as Distributed by MLS Grid
Cash-flow waterfall
monthlySold comps — $/sqft
last 12 mo · ≤1 miLoading sold comps…