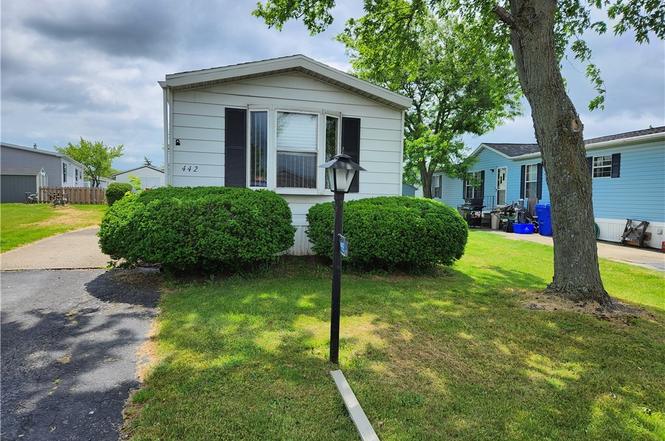
442 Chestnut Dr · South Lockport, NY
Flood risk 6/10 · Moderate
- FEMA flood zone
- X (unshaded)
- Chance of flooding over 30 yrs
- 0.72%
- Est. flood insurance / yr
- $507 – $1,088
Fire risk 3/10 · Minor
- Est. fire insurance / yr
- $691 – $1,283
Heat risk 2/10 · Minimal
- Hot days now (above 94°F)
- 7 days/yr
- Hot days in 30 yrs
- 15 days/yr
Wind risk 1/10 · Minimal
- Chance of severe wind over 30 yrs
- —
Air-quality risk 2/10 · Minimal
- Unhealthy air days now
- 2 days/yr
- Unhealthy air days in 30 yrs
- 2 days/yr
Risk factors via First Street. Map © Google.
Why this score? — see what drove the C+ grade
The composite is a weighted blend of 9 inputs, each scored 0–100. Each bar is that input's sub-score; the figure is the points it added to the 100-point composite (weight × sub-score).
- Cash flow +30.0/30.0
- 1% rule +10.0/10.0
- DSCR +10.0/10.0
- Schools +3.9/10.0
- Condition / age +3.8/5.0
- Rent growth +3.4/5.0
- Livability +3.3/5.0
- ARV discount +0.2/15.0
- Appreciation +0.0/10.0
$39,900
🖨 Deal sheet 📄 Offer letter ✓ Due diligence
Listing remarks
Welcome to this charming 3-bedroom, 1 full bath manufactured home offering comfort, value, and practical updates throughout. Step inside to find a bright and inviting interior, highlighted by new carpeting in select areas, adding a fresh and cozy feel to the living spaces. The home features a functional layout with three bedrooms, providing flexibility for family, guests, or a home office. The kitchen and living areas flow naturally, creating a comfortable space for everyday living and entertaining. The full bathroom is centrally located and easily accessible from all bedrooms. Outside, you'll appreciate the new shed roof, offering added durability and protection, along with extra storage s
Key facts
- Built 1988
- Listed 3 days
Property features AI
Finance
- HOA & community: Community clubhouse; Land lease of $855
Exterior
- Parking: No garage
- Utilities: Public water connected; Sewer connected; Circuit breaker electrical; Cable available; High-speed internet available
- Home design: Single-story single wide mobile home (Skyline); Resale condition; Shingle roof
- Construction: Vinyl siding; Copper and PEX plumbing
- Exterior features: Blacktop driveway; Shed(s) and storage; Lot is rectangular and near public transit
Interior
- Kitchen: Eat-in kitchen; Gas oven; Gas range; Refrigerator
- Bedrooms: Three bedrooms on the main level; Bedroom sizes: 12 x 10, 7 x 10, 9 x 9; Main level bedrooms
- Flooring: Carpet; Varies
- Bathrooms: One full bathroom on the main level
- Heating & cooling: Gas forced-air heating
- Interior features: Ceiling fan(s); Eat-in kitchen; Separate/formal living room; Accessible bedroom; Main level primary; Programmable thermostat; Storm windows with wood frames
- Laundry & utility: Washer and dryer on the main level; Gas water heater
Neighborhood map
What this means for you Summary
Snapshot
- This is a 3-bed/1.0-bath manufactured listed at $40k. Condition is rated good.
Deal economics
- At list price, monthly cash flow is $811 ($10k/yr) — positive.
- The deal already cash-flows at list — no discount required.
- Meets the 1% rule at list price ($1k rent vs $40k).
- Cap rate 30.7% vs local median 1.5% in South Lockport — top-decile yield for the area; either an underpriced asset or a hidden risk that comps aren't pricing in. Stress-test before assuming the spread holds.
Location & tenants
- Location reads 66/100 on livability (#633 in NY) — a middle-class / working-renter tenant base. Strengths: cost of living A+, health & safety A+; Watch: employment D+, schools F, crime F.
- Lockport City School District (town): math 44% / reading 49% proficiency, ranked #452 of 590 in NY (top 77%) — families likely to look elsewhere, expect single-tenant / working-renter base with shorter leases.
- Market conditions: Rents rising (+3.7%/yr); 357 active listings in the ZIP; solid renter incomes; 167 units permitted in Niagara County in 2024 (0 in 5+ unit buildings).
Forward outlook
- Local home prices are declining (-3.0%/yr); year-one equity from $276 of loan paydown is wiped out by about $1k of value loss. Plan a longer hold.
- Niagara County population projected at -19% by 2050 — secular population decline; favor cash flow + early exit over multi-decade hold.
- At projected returns (-3.0% appreciation + 3.7% rent growth), your $11k cash investment doubles in ~2 years — after that, you're playing with house money.
Negotiation context
- Only 3 days on market — expect competitive offers; lowballing is unlikely to land.
Risks & watch-outs
- Climate carrying-cost: major flood risk — expect insurance premiums to compound above CPI over the hold.
Questions for the listing agent
- Is there a deadline driving the sale (1031 exchange, divorce, estate, relocation)? That informs how much negotiation room exists.
- Schools are F-rated, which usually means shorter tenancies and higher turnover. Who's the typical renter profile here, and what's been the actual vacancy rate?
- Crime grade is F in this area — have there been break-ins, vandalism, or insurance claims at this property in the last 3 years? What carrier currently insures it and at what premium?
- What's the average days-on-market for RENTAL listings here right now (not sales)? A rising rental-DOM trend means longer vacancies and softer asking-rent achievability than the comps imply.
- What's the recent tenant-quality profile in this submarket — average credit score on applications, eviction rate, late-payment / NSF rate, and stable-employment percentage? A property-management company in the area should have these aggregated.
- How much new for-sale + rental construction is in the pipeline within 1–3 miles? Heavy new supply typically softens prices + rents 12–24 months out; constrained supply supports both.
Investment metrics
- 1% rule
- 3.45% ✓
- Cap rate
- 30.69%
- Cash-on-cash
- 87.14%
- DSCR
- 4.88
- GRM
- 2.4
CMA / ARV
- ARV (on-the-fly)
- $34,300
- Comps found
- 12
Show comp detail 12 sales within ~0.75 mi
| Address | Dist | Beds/Ba | Sqft | Sold | Price | $/sf | Match |
|---|---|---|---|---|---|---|---|
| 337 Applewood Dr | 0.10mi | 2/1.0 (-1) | 980 (0%) | 16mo | $32,900 | $34 | 77 |
| 533 Applewood Dr | 0.22mi | 2/2.0 (-1) | 1,008 (+3%) | 5mo | $35,000 | $35 | 72 |
| 378 Birchwood | 0.15mi | 3/2.0 | 1,095 (+12%) | 2mo | $35,000 | $32 | 68 |
| 349 S Brookside | 0.35mi | 3/1.0 | 1,100 (+12%) | 0mo | $37,500 | $34 | 63 |
| 1108 Lockwood Dr | 0.52mi | 2/2.0 (-1) | 1,008 (+3%) | 0mo | $30,000 | $30 | 62 |
| 306 Dogwood Dr | 0.31mi | 2/2.0 (-1) | 1,035 (+6%) | 7mo | $43,000 | $42 | 62 |
| 125 Sherwood Dr | 0.63mi | 2/1.0 (-1) | 1,056 (+8%) | 2mo | $55,500 | $53 | 52 |
| 1158 Timberwood Ct | 0.50mi | 2/2.0 (-1) | 1,064 (+9%) | 6mo | $60,000 | $56 | 49 |
| 1062 Fernwood Dr | 0.60mi | 2/2.0 (-1) | 964 (-2%) | 14mo | $16,500 | $17 | 48 |
| 1289 Norwood Dr | 0.68mi | 3/2.0 | 1,064 (+9%) | 5mo | $37,000 | $35 | 46 |
| 1327 Willowbrook Dr | 0.45mi | 2/2.0 (-1) | 1,056 (+8%) | 14mo | $48,000 | $45 | 45 |
| 1347 Fernwood Dr | 0.49mi | 3/2.0 | 1,120 (+14%) | 11mo | $100,000 | $89 | 40 |
Match score weights: distance 35% · size 25% · config 20% · recency 20%. Top-matched comps best support the ARV.
Projected returns pro-forma
-3.0% appreciation · 3.67% rent growth · sell at horizon
- IRR
- 88.4%
- Equity multiple
- 5.13×
- Total profit
- $46,162
- Equity at exit
- $5,949
- IRR
- 91.6%
- Equity multiple
- 10.91×
- Total profit
- $110,702
- Equity at exit
- $3,450
Cash invested: $11,172 (down + closing). Projections, not guarantees.
Landlord ↔ Tenant lean methodology
- Overall (STATE)
- 15 Strongly Tenant-Friendly
- State New York
- 15 Strongly Tenant-Friendly · D+10
- County
- — inherits STATE
- City
- — inherits STATE
ZIP-level market 14094
- Rents YoY
- 3.7%
- Active inventory
- 357
- Price-to-rent
- 2.4×
Monthly cashflow live
- Estimated rent
- $1,376 medium interval (Pro) →
- Mortgage (P&I)
- −$209
- Tax est. 1.5%
- −$50 /mo · $598/yr
- Insurance
- −$17
- HOA
- −$0
- Vacancy / Maint / Mgmt
- −$289
- Net cashflow
- $811
Break-even live
UW: 25.0% down · 7.5% · 30yr · 1.5% tax · 5.0% vac · 8.0% maint · 8.0% mgmt
Financing live
Cash to close
- Down payment
- $9,975
- Closing costs
- $1,197
- Reserves months
- —
- Total cash needed
- —
Loan-product check · same deal, 3 products live
Conventional
25% down · 7.5% · 30yr
- Down + closing
- —
- Monthly P&I
- —
- Monthly cashflow
- —
- DSCR
- —
- Eligible?
- —
Personal DTI + credit; lowest rate.
DSCR
20% down · 8.5% · 30yr
- Down + closing
- —
- Monthly P&I
- —
- Monthly cashflow
- —
- DSCR
- —
- Eligible?
- —
No personal income docs; deal must DSCR.
Hard money
10% down · 12.0% · 12mo
- Down + closing
- —
- Monthly P&I
- —
- Monthly cashflow
- —
- DSCR
- —
- Eligible?
- —
Short-term bridge; refi at stabilization.
Listing history 4 events
-
2026-06-18days on market $39,900 Active 3 DOM
-
2026-06-17days on market $39,900 Active 2 DOM
-
2026-06-15remarks 699-char remark
-
2026-06-15$39,900 Active 1 DOM
ⓘ Source: listings_history table (triggers on properties + properties_extension) + one-shot
backfill from property_details.listing_events for pre-trigger history.
Climate risk First Street
- Flood 6/10 Major FEMA zone X (unshaded) · 72% chance over 30 yrs
- Wildfire 3/10 Moderate
- Heat 2/10 Low 7 d/yr ≥94°F today · 15 d/yr by 30 yrs out
- Wind 1/10 Low
- Air quality 2/10 Low 2 unhealthy d/yr today · 2 by 30 yrs out
Nearby sold comps map
Loading sold comps map…
Walkable amenities ~0.75 mi
Loading nearby amenities…
Taxation est. · year 1
- Rental income
- $16,512
- − Mortgage interest
- −$2,235
- − Property taxes
- −$598
- − Insurance
- −$200
- − Repairs & maintenance
- −$1,321
- − Management
- −$1,321
- − Depreciation
- −$1,161
- Taxable income
- $9,676
- Est. tax owed @ 24.0%
- −$2,322
- After-tax cash flow
- $7,413/yr
For passive investors: Depreciation is non-cash, so a rental often shows a tax loss while cash-flowing — sheltering income. Rental losses are passive: they offset passive income freely, and up to $25,000/yr can offset ordinary (W-2) income if you actively participate and your MAGI is under $100k (phasing out to $0 by $150k); unused losses carry forward. On sale, claimed depreciation is recaptured at up to 25%, and gains may owe capital-gains tax (a 1031 exchange can defer both). Figures are a year-1 estimate at your 24.0% rate — not tax advice; consult a CPA.
Condition & rehab AI · 1 photo
This charming 3-bedroom manufactured home is in good condition with recent updates, including a new shed roof and carpeting. It offers a good investment opportunity with potential for further value enhancement through exterior painting and other updates.
Value-add opportunities
- Both Paint exterior walls — Enhances curb appeal and can increase both resale and rental value.
- Both Replace carpeting — Fresh carpeting can make the home more appealing to buyers and renters.
- Both Upgrade kitchen appliances — Modern appliances can improve the home's functionality and attract more buyers and renters.
- Both Install smart home features — Smart home features can increase the home's value by making it more energy-efficient and convenient for potential buyers and renters.
Renovation cost estimate screening
Value-add ROI direction
- Both Paint exterior walls — Enhances curb appeal and can increase both resale and rental value. ↑
- Both Replace carpeting — Fresh carpeting can make the home more appealing to buyers and renters. ↑
- Both Upgrade kitchen appliances — Modern appliances can improve the home's functionality and attract more buyers and renters. ↑
- Both Install smart home features — Smart home features can increase the home's value by making it more energy-efficient and convenient for potential buyers and renters. ↑
ⓘ Cost ranges are severity-bucket heuristics (US national rule-of-thumb). Get contractor quotes + a written scope before underwriting a rehab budget.
Schools (NCES district)
- District
- Lockport City School District
- NCES district ID
- 3617670
- Math proficiency
- 44% ▼ -7.00%
- Reading proficiency
- 49% ▲ 3.00%
- Median HH income
- $43,793
- Composite
- 39.28/100
- National rank
- #3997
- State rank
- #452 of 590 in NY
Livability — South Lockport
- Score
- 66/100
- State rank
- #633
- US rank
- #11642
Category grades
Schools grade is shown separately in the Schools card above.
Census & demographics
- Census place
- South Lockport, NY
- County
- Niagara County · 157,377 people
- Metro
- Buffalo-Cheektowaga, NY
- Population (ZIP)
- 50,153
- Household income
- $75,427
- Rent vs Own
- Severe rent burden
- 1112.0
Population outlook (Niagara County) Hauer SSP2
- Today (2025)
- 204,149 people
- By 2030
- 197,900 · -3.1%
- By 2040
- 182,239 · -10.7%
- By 2050
- 165,198 · -19.1%
- By 2075
- 129,416 · -36.6%
- By 2100
- 96,222 · -52.9%
Race, ethnicity, and origin ACS 2023
- Neighborhood character
- Predominantly White (84%)
- Race & ethnicity
- White 84% Two or more races 6% Black 6% Hispanic / Latino 3%
- Common ancestry
- Romanian 9% Slovak 2% Lithuanian 2%
- Foreign-born
- 3% · Canada
- Languages at home
- 96% English-only · Spanish 1% Russian/Polish/Slavic 1% Other Indo-European 1%
Political lean MEDSL · Niagara
- 2024 margin
- R (+14.9) · D 42.5% · R 57.5%
- 2008→2024 swing
- -15.9pp toward R · 2008: 1.0pp · 2024: -14.9pp
- All cycles
- 2024: R+14.9 2020: R+9.7 2016: R+19.0 2012: D+0.6 2008: D+1.0
Not yet ingested
- Civics
- —
Market trends
- HPI YoY
- ▼ -262.57%
- Current HPI
- 303.6109
- Rent YoY
- ▲ 3.67%
- Metro
- Buffalo-Cheektowaga, NY
- State GDP YoY
- ▲ 2.60%
- F500 in state
- 92
Industry mix (Fortune 500 HQ in NY)
| Industry | F500 HQs | Revenue |
|---|---|---|
| Financial Services | 10 | $950B |
|
||
| Consumer Goods | 9 | $162B |
|
||
| Insurance | 4 | $225B |
|
||
| Telecommunications | 2 | $144B |
|
||
| Pharmaceuticals | 2 | $112B |
|
||
| Media / Entertainment | 2 | $69B |
|
||
Price history
1 event — show timeline
- 2026-06-15 Listed $39,900 WNYREIS
Cash-flow waterfall
monthlySold comps — $/sqft
last 12 mo · ≤1 miLoading sold comps…