 Duplex
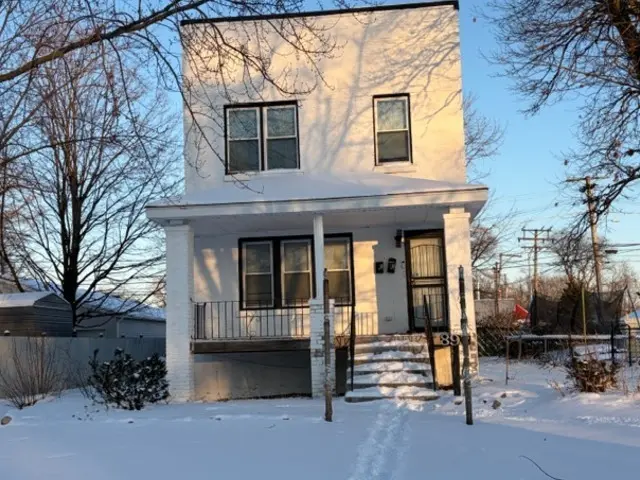
893 Greenbay Ave · Calumet City, IL
Flood risk 1/10 · Minimal
- FEMA flood zone
- X (unshaded)
- Chance of flooding over 30 yrs
- 0.0%
- Est. flood insurance / yr
- $473 – $860
Fire risk 1/10 · Minimal
- Est. fire insurance / yr
- $804 – $1,492
Heat risk 3/10 · Minor
- Hot days now (above 102°F)
- 7 days/yr
- Hot days in 30 yrs
- 15 days/yr
Wind risk 2/10 · Minimal
- Chance of severe wind over 30 yrs
- —
Air-quality risk 4/10 · Minor
- Unhealthy air days now
- 5 days/yr
- Unhealthy air days in 30 yrs
- 6 days/yr
Risk factors via First Street. Map © Google.
Why this score? — see what drove the C+ grade
The composite is a weighted blend of 9 inputs, each scored 0–100. Each bar is that input's sub-score; the figure is the points it added to the 100-point composite (weight × sub-score).
- Cash flow +25.9/30.0
- DSCR +8.7/10.0
- ARV discount +7.5/15.0
- 1% rule +6.9/10.0
- Rent growth +4.0/5.0
- Condition / age +4.0/5.0
- Livability +3.6/5.0
- Schools +1.0/10.0
- Appreciation +0.0/10.0
$245,000
🖨 Deal sheet 📄 Offer letter ✓ Due diligence
Multi-family units
County records classify this as Multi-Family (2-4 Unit). Listing-text estimate: 2 units. confirmed
Listing remarks
Approved Short Sale with fast closing!!! Live in one unit and let rent the other out in this beautifully renovated asset to your portfolio. This stunning duplex in Calumet City has been completely remodeled from top to bottom, including all new plumbing and electrical, offering peace of mind and long-term value. Each unit features 2 bedrooms and 1 bathroom with impressive 10-foot ceilings, creating a bright, open, and modern feel throughout. The kitchens are thoughtfully designed with 42-inch blue cabinetry, quartz countertops, elegant tile backsplashes, striking gold hardware, and a peninsula with seating for two-perfect for both everyday living and entertaining. The primary bedrooms are g
Key facts
- New plumbing
- Completely remodeled
- New electrical
Tags
Property features AI
Finance
- Other: Lot dimensions approximately 74 x 135 (less than 0.25 acre)
- Financial info: Special service area: No; Possession: Immediate; Building contains 2 units; Unit 1 rent $1,400, security deposit $1,400; tenant pays electric and gas; lease expires April 1, 2026; Unit 2 rent $1,400, security deposit $1,400; tenant pays electric and gas; lease expires March 1, 2026
Exterior
- Parking: 2 parking spaces (total)
- Utilities: Public water; Public sewer
- Home design: Two- to four-unit building (2 units); Fee simple ownership; Rehab completed in 2022; Built 91-100 years ago; Built before 1978
- Construction: Brick construction
- Exterior features: Commuter bus access
Interior
- Kitchen: Each unit includes stove, refrigerator, and microwave
- Bedrooms: 4 bedrooms total; Each unit has 2 bedrooms (Unit 1 on 1st floor, Unit 2 on 2nd floor)
- Bathrooms: 2 full bathrooms total; Each unit has 1 full bathroom
- Heating & cooling: Natural gas heating
- Interior features: 6 total rooms; Unfinished full basement
Neighborhood map
What this means for you Summary
Snapshot
- This is a 2 × 2-bed/1.0-bath units multifamily listed at $245k. Condition is rated good.
Deal economics
- At list price, monthly cash flow is $603 ($7k/yr) — positive. Per door: $301/mo.
- The deal already cash-flows at list — no discount required.
- Meets the 1% rule at list price ($3k rent vs $245k).
- Recommended offer: $238k (3.0% below list) — sets the bar for market timing.
Location & tenants
- Location reads 71/100 on livability (#330 in IL) — a middle-class / working-renter tenant base. Strengths: commute A+, cost of living A+, housing A+; Watch: employment C-, schools F, crime D-.
- Thornton Fractional Twp Hsd 215 (suburban): math 9% / reading 13% proficiency, ranked #563 of 620 in IL (top 91%) — low school quality limits family demand, transient renter base, plan for 1-2y turnover.
- Market conditions: Rents rising fast (+6.2%/yr); 198 active listings in the ZIP; 11 comparable units currently listed for rent nearby; rentals leasing fast (median 10d on market — plan ~1-2 weeks tenant-placement turnaround); 6,272 units permitted in Cook County in 2024 (4,658 in 5+ unit buildings).
- At $2,906/mo this rent would consume 63% of the median local household income ($55k/yr) (locally 2415% of renters already pay >50% of income on rent) — very limited rent-growth headroom before tenants either downsize or default.
Forward outlook
- Local home prices are declining (-3.0%/yr); year-one equity from $2k of loan paydown is wiped out by about $7k of value loss. Plan a longer hold.
- At projected returns (-3.0% appreciation + 6.2% rent growth), your $69k cash investment doubles in ~8 years — after that, you're playing with house money.
Negotiation context
- It's been on market 53 days — a 3% lower offer ($238k) is reasonable based on typical stale-listing flexibility.
- 4 sale attempts since 4y ago; this cycle's ask is 104% above the opening price — seller raised mid-cycle; expect resistance to lowballs.
- Current owner paid $125k; list at $245k implies a 96% gain — meaningful room to come down on a strong offer.
Risks & watch-outs
- Watch-outs: built in 1926 — expect roof / HVAC / electrical / plumbing capex.
Questions for the listing agent
- It's been on market 53 days. Have you received any prior offers? Is the seller open to a 3% concession, seller financing, or rate buy-down credit?
- Can we see the unit-by-unit rent roll, current vacancy, and any below-market leases? What's the average tenancy length?
- What capital expenditures (roof, boiler, parking lot, exteriors) have been made in the last 5 years, and what's planned in the next 2?
- Built in 1926 — when were the roof, HVAC, electrical panel, plumbing, and water heater last replaced?
- Is there a deadline driving the sale (1031 exchange, divorce, estate, relocation)? That informs how much negotiation room exists.
- Schools are F-rated, which usually means shorter tenancies and higher turnover. Who's the typical renter profile here, and what's been the actual vacancy rate?
- Crime grade is D in this area — have there been break-ins, vandalism, or insurance claims at this property in the last 3 years? What carrier currently insures it and at what premium?
- What's the average days-on-market for RENTAL listings here right now (not sales)? A rising rental-DOM trend means longer vacancies and softer asking-rent achievability than the comps imply.
- What's the recent tenant-quality profile in this submarket — average credit score on applications, eviction rate, late-payment / NSF rate, and stable-employment percentage? A property-management company in the area should have these aggregated.
- How much new apartment / multifamily construction is in the pipeline within 1–3 miles? Heavy new supply (>2% of stock underway) typically softens rents 12–24 months out; light construction supports rent growth.
Investment metrics
- 1% rule
- 1.19% ✓
- Cap rate
- 9.24%
- Cash-on-cash
- 10.54%
- DSCR
- 1.47
- GRM
- 7.0
CMA / ARV
No comps found within radius.
Show comp detail 10 sales within ~0.75 mi
| Address | Dist | Beds/Ba | Sqft | Sold | Price | $/sf | Match |
|---|---|---|---|---|---|---|---|
| 804 Mackinaw Ave | 0.18mi | 4/2.0 | — | 5mo | $185,000 | — | 74 |
| 812 Mackinaw Ave | 0.17mi | 4/2.0 | — | 18mo | $105,000 | — | 65 |
| 735 May St | 0.38mi | 4/2.0 | — | 9mo | $230,000 | — | 63 |
| 764 May St | 0.28mi | 4/2.0 | — | 20mo | $201,000 | — | 58 |
| 502 154th Pl | 0.47mi | 4/4.0 | — | 4mo | $225,000 | — | 54 |
| 611 Hirsch Ave | 0.66mi | 4/2.0 | — | 8mo | $40,000 | — | 50 |
| 300 Waltham St | 0.44mi | 5/5.0 (+1) | — | 2mo | $180,000 | — | 48 |
| 218 157th St | 0.52mi | 5/3.0 (+1) | — | 9mo | $310,000 | — | 47 |
| 447 154th Pl | 0.45mi | 4/4.0 | — | 16mo | $297,900 | — | 45 |
| 112 Webb St | 0.65mi | 5/3.0 (+1) | — | 7mo | $200,000 | — | 42 |
Match score weights: distance 35% · size 25% · config 20% · recency 20%. Top-matched comps best support the ARV.
Projected returns pro-forma
-3.0% appreciation · 6.17% rent growth · sell at horizon
- IRR
- 3.0%
- Equity multiple
- 1.12×
- Total profit
- $8,286
- Equity at exit
- $36,530
- IRR
- 15.4%
- Equity multiple
- 2.44×
- Total profit
- $98,698
- Equity at exit
- $21,183
Cash invested: $68,600 (down + closing). Projections, not guarantees.
Landlord ↔ Tenant lean methodology
- Overall (STATE)
- 43 Moderately Tenant-Leaning
- State Illinois
- 43 Moderately Tenant-Leaning · D+7
- County
- — inherits STATE
- City
- — inherits STATE
ZIP-level market 60409
- Home prices YoY
- -27.6%
- Rents YoY
- 6.2%
- Active inventory
- 198
- Price-to-rent
- 14.1×
Monthly cashflow live
- Estimated rent
- $2,906 high interval (Pro) →
- Mortgage (P&I)
- −$1,285
- Tax est. 1.5%
- −$306 /mo · $3,675/yr
- Insurance
- −$102
- HOA
- −$0
- Vacancy / Maint / Mgmt
- −$610
- Net cashflow
- $603
Break-even live
2-unit breakdown (identical units grouped — click to expand)
| Units | Beds | Baths | Est. rent |
|---|---|---|---|
| 2× units | 2 | 1 | $2,906 |
| #1 | 2 | 1 | $1,453 |
| #2 | 2 | 1 | $1,453 |
| Total (2 units) | $2,906 | ||
UW: 25.0% down · 7.5% · 30yr · 1.5% tax · 5.0% vac · 8.0% maint · 8.0% mgmt
Financing live
Cash to close
- Down payment
- $61,250
- Closing costs
- $7,350
- Reserves months
- —
- Total cash needed
- —
Loan-product check · same deal, 3 products live
Conventional
25% down · 7.5% · 30yr
- Down + closing
- —
- Monthly P&I
- —
- Monthly cashflow
- —
- DSCR
- —
- Eligible?
- —
Personal DTI + credit; lowest rate.
DSCR
20% down · 8.5% · 30yr
- Down + closing
- —
- Monthly P&I
- —
- Monthly cashflow
- —
- DSCR
- —
- Eligible?
- —
No personal income docs; deal must DSCR.
Hard money
10% down · 12.0% · 12mo
- Down + closing
- —
- Monthly P&I
- —
- Monthly cashflow
- —
- DSCR
- —
- Eligible?
- —
Short-term bridge; refi at stabilization.
Rent comps 11 comps
| Address | Beds | Baths | Sqft | Rent | $/sqft | DOM | Units | Dist |
|---|---|---|---|---|---|---|---|---|
| 115 157th St Unit 3 Calumet City, IL | 3.0 | 1.0 | 800 | $1,350 | $1.69 | 24d | 1 | 0.63mi |
| 34 Elizabeth St Calumet City, IL | 3.0 | 1.0 | 1246 | $2,400 | $1.93 | 1d | 1 | 0.70mi |
| 6 Webb St Calumet City, IL | 3.0 | 1.0 | — | $2,700 | — | 1d | 1 | 0.74mi |
| 3 Waltham St Hammond, IN | 3.0 | 1.0 | 1200 | $1,095 | $0.91 | 24d | 1 | 0.78mi |
| 1310 Imperial Ave Calumet City, IL | 4.0 | 1.5 | — | $2,175 | — | 1d | 1 | 0.82mi |
| 23 Mason St Unit 1 Hammond, IN | 3.0 | 1.0 | — | $1,950 | — | 21d | 1 | 0.82mi |
| 1335 Mackinaw Ave Calumet City, IL | 3.0 | 1.0 | — | $2,500 | — | 19d | 1 | 0.83mi |
| 671 Saginaw Ave Calumet City, IL | 3.0 | 2.0 | 1250 | $2,276 | $1.82 | 10d | 1 | 1.07mi |
| 1539 Wentworth Ave Unit 3W Calumet City, IL | 3.0 | 1.0 | 1100 | $1,700 | $1.55 | 12d | 1 | 1.43mi |
| 617 Kane St Hammond, IN | 4.0 | 2.0 | 2146 | $2,300 | $1.07 | 1d | 1 | 1.49mi |
| 1565 Wentworth Ave Calumet City, IL | 4.0 | 2.0 | — | $1,950 | — | 1d | 1 | 1.49mi |
Listing history 22 events
-
2026-06-18days on market $245,000 Active 53 DOM
-
2026-06-17days on market $245,000 Active 52 DOM
-
2026-06-16days on market $245,000 Active 51 DOM
-
2026-06-15days on market $245,000 Active 50 DOM
-
2026-06-13days on market $245,000 Active 48 DOM
-
2026-06-09days on market $245,000 Active 44 DOM
-
2026-06-08days on market $245,000 Active 43 DOM
-
2026-06-07days on market $245,000 Active 42 DOM
-
2026-06-04days on market $245,000 Active 39 DOM
-
2026-06-03days on market $245,000 Active 38 DOM
-
2026-06-02days on market $245,000 Active 37 DOM
-
2026-06-01days on market $245,000 Active 36 DOM
-
2026-05-31days on market $245,000 Active 35 DOM
-
2026-04-26historical
-
2026-03-12status Active
-
2026-03-06historical Contingent - Continue to Show
-
2026-01-28Active
-
2026-01-28historical
-
2026-01-19Active
-
2022-08-09soldstatus $125,000 Closed
-
2022-05-25historical Contingent - Continue to Show
-
2022-05-20$119,900 Active
ⓘ Source: listings_history table (triggers on properties + properties_extension) + one-shot
backfill from property_details.listing_events for pre-trigger history.
Climate risk First Street
- Flood 1/10 Low FEMA zone X (unshaded) · 0% chance over 30 yrs
- Wildfire 1/10 Low
- Heat 3/10 Moderate 7 d/yr ≥102°F today · 15 d/yr by 30 yrs out
- Wind 2/10 Low
- Air quality 4/10 Moderate 5 unhealthy d/yr today · 6 by 30 yrs out
Nearby sold comps map
Loading sold comps map…
Walkable amenities ~0.75 mi
Loading nearby amenities…
Taxation est. · year 1
- Rental income
- $34,872
- − Mortgage interest
- −$13,724
- − Property taxes
- −$3,675
- − Insurance
- −$1,225
- − Repairs & maintenance
- −$2,790
- − Management
- −$2,790
- − Depreciation
- −$7,127
- Taxable income
- $3,541
- Est. tax owed @ 24.0%
- −$850
- After-tax cash flow
- $6,381/yr
For passive investors: Depreciation is non-cash, so a rental often shows a tax loss while cash-flowing — sheltering income. Rental losses are passive: they offset passive income freely, and up to $25,000/yr can offset ordinary (W-2) income if you actively participate and your MAGI is under $100k (phasing out to $0 by $150k); unused losses carry forward. On sale, claimed depreciation is recaptured at up to 25%, and gains may owe capital-gains tax (a 1031 exchange can defer both). Figures are a year-1 estimate at your 24.0% rate — not tax advice; consult a CPA.
Condition & rehab AI · 9 photos
This well-maintained and recently renovated two-unit property in Calumet City is move-in ready and offers a good return on investment.
Value-add opportunities
- Both Landscaping — Enhances curb appeal and adds value for both resale and rental.
- Both Painting exterior — Fresh paint can improve the home's appearance and value.
- Both Landscaping improvements — Better landscaping can attract more potential buyers/renters and increase property value.
Renovation cost estimate screening
Value-add ROI direction
- Both Landscaping — Enhances curb appeal and adds value for both resale and rental. ↑
- Both Painting exterior — Fresh paint can improve the home's appearance and value. ↑
- Both Landscaping improvements — Better landscaping can attract more potential buyers/renters and increase property value. ↑
ⓘ Cost ranges are severity-bucket heuristics (US national rule-of-thumb). Get contractor quotes + a written scope before underwriting a rehab budget.
Schools (NCES district)
- District
- Thornton Fractional Twp Hsd 215
- NCES district ID
- 1738940
- Math proficiency
- 9% ▼ -3.00%
- Reading proficiency
- 13% ▼ -3.00%
- Median HH income
- $48,207
- Composite
- 10.27/100
- National rank
- #9793
- State rank
- #563 of 620 in IL
Livability — Calumet City
- Score
- 71/100
- State rank
- #330
- US rank
- #6552
Category grades
Schools grade is shown separately in the Schools card above.
Census & demographics
- Census place
- Calumet City, IL
- County
- Cook County · 4,486,803 people
- City population
- 35,100
- Metro
- Chicago-Naperville-Elgin, IL-IN-WI
- Population (ZIP)
- 35,100
- Household income
- $55,369
- Rent vs Own
- Severe rent burden
- 2415.0
Population outlook (Cook County) Hauer SSP2
- Today (2025)
- 5,347,519 people
- By 2030
- 5,357,703 · +0.2%
- By 2040
- 5,324,924 · -0.4%
- By 2050
- 5,230,762 · -2.2%
- By 2075
- 4,785,735 · -10.5%
- By 2100
- 4,188,836 · -21.7%
Race, ethnicity, and origin ACS 2023
- Neighborhood character
- Predominantly Black (74%)
- Race & ethnicity
- Black 74% Hispanic / Latino 15% White 7% Two or more races 4%
- Hispanic origin (detail)
- Mexican 14%
- Common ancestry
- Romanian 2%
- Foreign-born
- 9% · Canada
- Languages at home
- 83% English-only · Spanish 14%
Political lean MEDSL · Cook
- 2024 margin
- Solid D (+42.0) · D 70.4% · R 28.4% · Other 1.2%
- 2008→2024 swing
- -11.4pp toward R · 2008: 53.4pp · 2024: 42.0pp
- All cycles
- 2024: D+42.0 2020: D+50.3 2016: D+53.0 2012: D+49.4 2008: D+53.4
Not yet ingested
- Civics
- —
Market trends
- HPI YoY
- ▼ -75.01%
- Current HPI
- 197.2137
- Rent YoY
- ▲ 6.17%
- Metro
- Chicago-Naperville-Elgin, IL-IN-WI
- State GDP YoY
- ▲ 1.59%
- F500 in state
- 60
Industry mix (Fortune 500 HQ in IL)
| Industry | F500 HQs | Revenue |
|---|---|---|
| Insurance | 4 | $201B |
|
||
| Consumer Goods | 4 | $87B |
|
||
| Industrial Machinery | 3 | $64B |
|
||
| Healthcare | 2 | $55B |
|
||
| Retail / Pharmacy | 1 | $148B |
|
||
| Agriculture / Food | 1 | $86B |
|
||
Price history
+4.3% since first listed9 events — show timeline
- 2026-04-26 Listing Removed — MRED as Distributed by MLS Grid
- 2026-03-12 Relisted — MRED as Distributed by MLS Grid
- 2026-03-06 Contingent — MRED as Distributed by MLS Grid
- 2026-01-28 Listing Removed — MRED as Distributed by MLS Grid
- 2026-01-28 Listed — MRED as Distributed by MLS Grid
- 2026-01-19 Listed — MRED as Distributed by MLS Grid
- 2022-08-09 Sold (MLS) $125,000 MRED as Distributed by MLS Grid
- 2022-05-25 Contingent — MRED as Distributed by MLS Grid
- 2022-05-20 Listed $119,900 MRED as Distributed by MLS Grid
Cash-flow waterfall
monthlySold comps — $/sqft
last 12 mo · ≤1 miLoading sold comps…