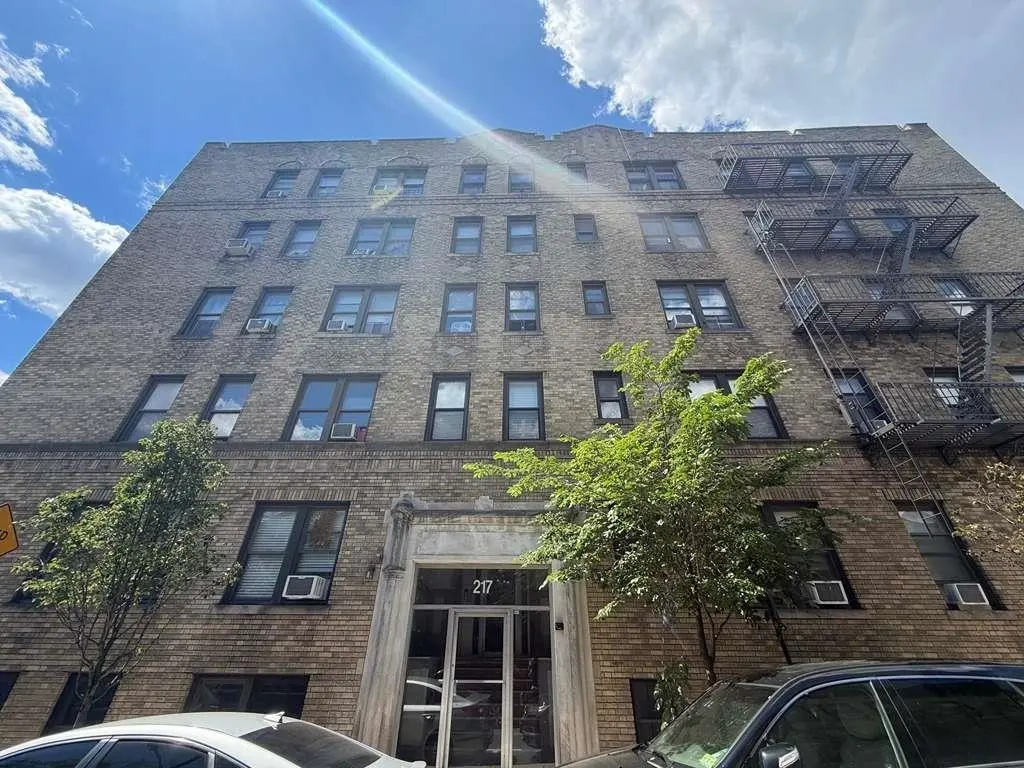
217 44TH St #12 · Union City, NJ
Flood risk 1/10 · Minimal
- FEMA flood zone
- X (unshaded)
- Chance of flooding over 30 yrs
- 0.0%
- Est. flood insurance / yr
- $507 – $1,088
Fire risk 1/10 · Minimal
- Est. fire insurance / yr
- $526 – $976
Heat risk 7/10 · Major
- Hot days now (above 98°F)
- 7 days/yr
- Hot days in 30 yrs
- 15 days/yr
Wind risk 6/10 · Moderate
- Chance of severe wind over 30 yrs
- 27.0%
Air-quality risk 4/10 · Minor
- Unhealthy air days now
- 5 days/yr
- Unhealthy air days in 30 yrs
- 6 days/yr
Risk factors via First Street. Map © Google.
Why this score? — see what drove the B grade
The composite is a weighted blend of 9 inputs, each scored 0–100. Each bar is that input's sub-score; the figure is the points it added to the 100-point composite (weight × sub-score).
- Cash flow +26.0/30.0
- Appreciation +10.0/10.0
- 1% rule +9.9/10.0
- DSCR +8.8/10.0
- ARV discount +7.5/15.0
- Livability +3.9/5.0
- Rent growth +2.7/5.0
- Schools +2.2/10.0
- Condition / age +2.2/5.0
$162,000
🖨 Deal sheet 📄 Offer letter ✓ Due diligence
Listing remarks
Located in the heart of Union City, this spacious 1-bedroom, 1-bath condo offers an excellent opportunity for investors, renovators, or buyers looking to customize a home to their own taste. The unit features a living room and kitchen/dining room combo layout with solid potential, and is in need of rehabilitation and updating. Maintenance includes Heat, Water, Hot Water and Laundry in Basement shared. Conveniently situated near Bergenline Avenue shopping, local restaurants, cafés, parks, schools, and public transportation, with easy access to Jersey City, Hoboken, and New York City. Enjoy being just minutes from buses, light rail connections, major highways, and everyday essentials.
Key facts
- $377 HOA
- Built 1930
- Listed 12 days
Tags
Property features AI
Finance
- HOA & community: Managed by Anthony Real Estate; Monthly maintenance fee of $340 covering heat and water
Exterior
- Parking: No parking
- Utilities: Water included in maintenance; Heat included in maintenance
- Home design: Built in 1930; Approximate 595 total square feet
- Construction: Brick construction; Built in 1930
- Exterior features: Brick exterior; Near train, shopping, bus, parks, and schools
Interior
- Kitchen: 1 kitchen
- Bedrooms: 1 bedroom (level 2)
- Flooring: Hardwood
- Bathrooms: 1 full bathroom
- Heating & cooling: Gas heating; Radiators; Window A/C
- Interior features: Hardwood floors; Radiator heating; Window air conditioning
- Laundry & utility: Shared washer/dryer room
Neighborhood map
What this means for you Summary
Snapshot
- This is a 1-bed/1.0-bath condo listed at $162k. Condition is rated fair.
Deal economics
- At list price, monthly cash flow is $405 ($5k/yr) — positive.
- The deal already cash-flows at list — no discount required.
- Meets the 1% rule at list price ($2k rent vs $162k).
- Cap rate 9.3% vs local median 2.3% in Union City — top-decile yield for the area; either an underpriced asset or a hidden risk that comps aren't pricing in. Stress-test before assuming the spread holds.
Location & tenants
- Location reads 77/100 on livability (#117 in NJ, #2,998 nationally) — a middle-class / working-renter tenant base. Strengths: amenities A+, commute A+, health & safety A; Watch: cost of living F.
- Union City School District (suburban): math 15% / reading 36% proficiency, ranked #399 of 472 in NJ (top 84%) — low school quality limits family demand, transient renter base, plan for 1-2y turnover; 85% free/reduced lunch — lower-income household profile, screen leases tightly.
- Market conditions: Rents flat; 226 active listings in the ZIP; 40 comparable units currently listed for rent nearby; rentals at typical pace (median 18d on market — plan ~3-4 weeks tenant-placement turnaround); 5,310 units permitted in Hudson County in 2024 (4,154 in 5+ unit buildings).
- This rent runs 45% of the median local income ($64k/yr) — at the standard rent-burdened threshold; future hikes will face affordability resistance.
Forward outlook
- In year one you build about $17k of equity ($1k loan paydown + $16k appreciation (10.0% local appreciation)).
- Hudson County population projected at +29% by 2050 — long-run rental-demand tailwind backs the buy-and-hold thesis.
- At projected returns (10.0% appreciation + 0.9% rent growth), your $45k cash investment doubles in ~2 years — after that, you're playing with house money.
- By year 3, paydown + projected appreciation supports a ~$44k cash-out refi (75% LTV) — recoverable capital for the next deal without selling this one.
Negotiation context
- Only 12 days on market — expect competitive offers; lowballing is unlikely to land.
Risks & watch-outs
- Watch-outs: built in 1930 — expect roof / HVAC / electrical / plumbing capex.
- Climate carrying-cost: major wind risk, 27% chance of damaging wind over 30y; extreme-heat days projected 7→15/yr by 2055 (HVAC capex compounding) — expect insurance premiums to compound above CPI over the hold.
Questions for the listing agent
- Have any recent inspections been done? Can we get a copy of the seller's disclosures and any deferred-maintenance estimates?
- Built in 1930 — when were the roof, HVAC, electrical panel, plumbing, and water heater last replaced?
- What does the HOA fee cover, when was the last increase, and are there any pending special assessments or reserve-fund shortfalls?
- Any open or pending special assessments — roof, HVAC, plumbing, elevator, façade? What's the per-unit balance and payoff schedule, and is the seller paying it off at close or rolling it to the buyer?
- Is there a deadline driving the sale (1031 exchange, divorce, estate, relocation)? That informs how much negotiation room exists.
- What's the average days-on-market for RENTAL listings here right now (not sales)? A rising rental-DOM trend means longer vacancies and softer asking-rent achievability than the comps imply.
- What's the recent tenant-quality profile in this submarket — average credit score on applications, eviction rate, late-payment / NSF rate, and stable-employment percentage? A property-management company in the area should have these aggregated.
- How much new apartment / multifamily construction is in the pipeline within 1–3 miles? Heavy new supply (>2% of stock underway) typically softens rents 12–24 months out; light construction supports rent growth.
Investment metrics
- 1% rule
- 1.49% ✓
- Cap rate
- 9.29%
- Cash-on-cash
- 10.70%
- DSCR
- 1.48
- GRM
- 5.6
CMA / ARV
No comps found within radius.
Projected returns pro-forma
10.0% appreciation · 0.89% rent growth · sell at horizon
- IRR
- 31.0%
- Equity multiple
- 3.41×
- Total profit
- $109,262
- Equity at exit
- $145,942
- IRR
- 26.1%
- Equity multiple
- 7.45×
- Total profit
- $292,724
- Equity at exit
- $314,730
Cash invested: $45,360 (down + closing). Projections, not guarantees.
Landlord ↔ Tenant lean methodology
- Overall (STATE)
- 21 Tenant-Leaning
- State New Jersey
- 21 Tenant-Leaning · D+6
- County
- — inherits STATE
- City
- — inherits STATE
ZIP-level market 07087
- Home prices YoY
- 9.6%
- Rents YoY
- 0.9%
- Active inventory
- 226
- Price-to-rent
- 5.6×
Monthly cashflow live
- Estimated rent
- $2,406 high interval (Pro) →
- Mortgage (P&I)
- −$850
- Tax est. 1.5%
- −$202 /mo · $2,430/yr
- Insurance
- −$68
- HOA
- −$377
- Vacancy / Maint / Mgmt
- −$505
- Net cashflow
- $405
Break-even live
UW: 25.0% down · 7.5% · 30yr · 1.5% tax · 5.0% vac · 8.0% maint · 8.0% mgmt
Financing live
Cash to close
- Down payment
- $40,500
- Closing costs
- $4,860
- Reserves months
- —
- Total cash needed
- —
Loan-product check · same deal, 3 products live
Conventional
25% down · 7.5% · 30yr
- Down + closing
- —
- Monthly P&I
- —
- Monthly cashflow
- —
- DSCR
- —
- Eligible?
- —
Personal DTI + credit; lowest rate.
DSCR
20% down · 8.5% · 30yr
- Down + closing
- —
- Monthly P&I
- —
- Monthly cashflow
- —
- DSCR
- —
- Eligible?
- —
No personal income docs; deal must DSCR.
Hard money
10% down · 12.0% · 12mo
- Down + closing
- —
- Monthly P&I
- —
- Monthly cashflow
- —
- DSCR
- —
- Eligible?
- —
Short-term bridge; refi at stabilization.
Rent comps 40 comps
| Address | Beds | Baths | Sqft | Rent | $/sqft | DOM | Units | Dist |
|---|---|---|---|---|---|---|---|---|
| 121 41st St #1 Union City, NJ | 2.0 | 1.0 | 553 | $2,300 | $4.16 | 17d | 1 | 0.14mi |
| 213 48th St Unit 4A Union City, NJ | 1.0 | 1.0 | 360 | $1,825 | $5.07 | 44d | 1 | 0.27mi |
| 4701 Park Ave Unit 2B Union City, NJ | 1.0 | 1.0 | 600 | $1,725 | $2.88 | 24d | 1 | 0.30mi |
| 210 36th St Unit 3L Union City, NJ | 1.0 | 1.0 | 750 | $2,100 | $2.80 | 7d | 1 | 0.32mi |
| 115 37th St Unit 102 Union City, NJ | 1.0 | 1.0 | 600 | $2,500 | $4.17 | 5d | 1 | 0.33mi |
| 4901 Bergenline Ave West New York, NJ | 1.0–2.0 | 1.0–2.0 | 930 | $2,744 | $2.95 | 3d | 8 | 0.37mi |
| 4914 Park Ave Unit 2F Weehawken, NJ | 1.0 | 1.0 | 550 | $1,990 | $3.62 | 24d | 1 | 0.45mi |
| 29 51st St Unit D4 Weehawken Township, NJ | 1.0 | 1.0 | 750 | $2,350 | $3.13 | 24d | 1 | 0.51mi |
| 1300 Avenue At Port Imperial Weehawken, NJ | 2.0 | 1.0–2.0 | 915 | $4,320 | $4.72 | 2d | 17 | 0.53mi |
| 5309 Hudson Ave West New York, NJ | 2.0 | 1.0 | 750 | $2,095 | $2.79 | 3d | 1 | 0.54mi |
| 1100 Avenue At Port Imperial Weehawken, NJ | 3.0 | 1.0–2.0 | 924 | $4,602 | $4.98 | 1d | 20 | 0.56mi |
| 1500 Avenue At Port Imperial Weehawken, NJ | 2.0 | 1.0–2.0 | 886 | $4,015 | $4.53 | 2d | 19 | 0.56mi |
| 900 Ave At Port Imperial Blvd Weehawken, NJ | 2.0 | 1.0–2.0 | 791 | $4,715 | $5.96 | 1d | 26 | 0.57mi |
| 318 54th St West New York, NJ | 1.0 | 1.0 | 656 | $2,225 | $3.39 | 13d | 2 | 0.57mi |
| 318 54th St West New York, NJ | 1.0 | 1.0 | 618 | $2,225 | $3.60 | 10d | 2 | 0.57mi |
| 318 54th St Unit 1H West New York, NJ | 1.0 | 1.0 | 637 | $2,250 | $3.53 | 11d | 1 | 0.58mi |
| 5406 Bergenline Ave West New York, NJ | 1.0 | 1.0 | 500 | $1,800 | $3.60 | 22d | 1 | 0.59mi |
| 231 32nd St Unit 412 Weehawken, NJ | 1.0 | 1.0 | 683 | $2,815 | $4.12 | 7d | 1 | 0.60mi |
| 407 56th St Unit 308 West New York, NJ | 1.0 | 1.5 | 700 | $2,300 | $3.29 | 24d | 1 | 0.65mi |
| 5414 Park Ave Unit 31 West New York, NJ | 2.0 | 1.0 | 750 | $2,395 | $3.19 | 24d | 1 | 0.66mi |
| 25 Ave At Port Imperial West New York, NJ | 1.0–2.0 | 1.0–2.0 | 904 | $3,200 | $3.54 | 3d | 11 | 0.66mi |
| 603 55th St Apt 302 West New York, NJ | 1.0 | 1.0 | 643 | $1,900 | $2.95 | 21d | 1 | 0.69mi |
| 2709 Bergenline Ave Unit 3B Union City, NJ | 1.0 | 1.0 | 700 | $1,550 | $2.21 | 22d | 1 | 0.70mi |
| 28 Ave At Port Imperial West New York, NJ | 2.0 | 1.0–2.0 | 838 | $4,775 | $5.70 | 2d | 48 | 0.72mi |
| 117 57th St #2 West New York, NJ | 2.0 | 1.0 | 600 | $2,100 | $3.50 | 22d | 1 | 0.72mi |
| 2705 Central Ave Unit 1 Union City, NJ | 2.0 | 1.0 | 500 | $2,300 | $4.60 | 17d | 1 | 0.73mi |
| 221 Jane St #1 Weehawken, NJ | 1.0 | 1.0 | 600 | $2,100 | $3.50 | 22d | 1 | 0.74mi |
| 303 58th St Unit 14 West New York, NJ | 1.0 | 1.0 | 650 | $1,695 | $2.61 | 2d | 1 | 0.75mi |
| 26 Ave At Port Imperial #242 West New York, NJ | 1.0 | 1.0 | 740 | $3,000 | $4.05 | 24d | 1 | 0.76mi |
| 4828 Tonnelle Ave North Bergen, NJ | 2.0 | 1.0–2.0 | 868 | $2,702 | $3.11 | 2d | 25 | 0.76mi |
| 5 Port Imperial Blvd Weehawken Township, NJ | 1.0–2.0 | 1.0–2.0 | 809 | $3,578 | $4.42 | 2d | 29 | 0.79mi |
| 311 Park Ave Weehawken, NJ | 1.0 | 1.0 | 400 | $2,500 | $6.25 | 24d | 1 | 0.86mi |
| 5907 Kennedy Blvd E West New York, NJ | 2.0 | 1.0 | 750 | $2,500 | $3.33 | 24d | 1 | 0.87mi |
| 5711 Washington St #404 West New York, NJ | 1.0 | 1.0 | 700 | $2,450 | $3.50 | 24d | 1 | 0.87mi |
| 5665 John F. Kennedy Blvd North Bergen, NJ | 2.0 | 1.0–2.0 | 1011 | $2,792 | $2.76 | 2d | 1 | 0.87mi |
| 55 Riverwalk Pl West New York, NJ | 3.0 | 1.0–2.0 | 1007 | $4,053 | $4.02 | 2d | 31 | 0.89mi |
| 5711 John F. Kennedy Blvd Unit 234 North Bergen, NJ | 1.0 | 1.0 | 736 | $2,515 | $3.42 | 24d | 1 | 0.90mi |
| 5711 John F. Kennedy Blvd Unit 304 North Bergen, NJ | 1.0 | 1.0 | 736 | $2,483 | $3.37 | 24d | 1 | 0.90mi |
| 5711 John F. Kennedy Blvd Unit 534 North Bergen, NJ | 1.0 | 1.0 | 736 | $2,607 | $3.54 | 24d | 1 | 0.90mi |
| 5711 John F. Kennedy Blvd #404 North Bergen, NJ | 1.0 | 1.0 | 736 | $2,510 | $3.41 | 24d | 1 | 0.90mi |
HOA detail condo
- Monthly dues
- $377 · $4,524/yr
- Likely covers
- water
- Assessments
- None detected in remarks — confirm with the listing agent.
Listing history 5 events
-
2026-06-09statusdays on market $162,000 Under Contract 12 DOM
-
2026-06-03days on market $162,000 Active 7 DOM
-
2026-06-02days on market $162,000 Active 6 DOM
-
2026-06-01days on market $162,000 Active 5 DOM
-
2026-05-31days on market $162,000 Active 4 DOM
ⓘ Source: listings_history table (triggers on properties + properties_extension) + one-shot
backfill from property_details.listing_events for pre-trigger history.
Climate risk First Street
- Flood 1/10 Low FEMA zone X (unshaded) · 0% chance over 30 yrs
- Wildfire 1/10 Low
- Heat 7/10 Severe 7 d/yr ≥98°F today · 15 d/yr by 30 yrs out
- Wind 6/10 Major 27% chance of damaging wind over 30 yrs
- Air quality 4/10 Moderate 5 unhealthy d/yr today · 6 by 30 yrs out
Nearby sold comps map
Loading sold comps map…
Walkable amenities ~0.75 mi
Loading nearby amenities…
Taxation est. · year 1
- Rental income
- $28,878
- − Mortgage interest
- −$9,075
- − Property taxes
- −$2,430
- − Insurance
- −$810
- − Repairs & maintenance
- −$2,310
- − Management
- −$2,310
- − HOA
- −$4,524
- − Depreciation
- −$4,713
- Taxable income
- $2,706
- Est. tax owed @ 24.0%
- −$650
- After-tax cash flow
- $4,206/yr
For passive investors: Depreciation is non-cash, so a rental often shows a tax loss while cash-flowing — sheltering income. Rental losses are passive: they offset passive income freely, and up to $25,000/yr can offset ordinary (W-2) income if you actively participate and your MAGI is under $100k (phasing out to $0 by $150k); unused losses carry forward. On sale, claimed depreciation is recaptured at up to 25%, and gains may owe capital-gains tax (a 1031 exchange can defer both). Figures are a year-1 estimate at your 24.0% rate — not tax advice; consult a CPA.
Condition & rehab AI · 5 photos
This 1-bedroom, 1-bath condo in Union City requires moderate rehabilitation to improve its condition and increase its value. Key updates include new kitchen appliances, fresh paint, and updated bathroom fixtures.
Repairs flagged
- Minor Marble stairs — Some wear
- Moderate Kitchen appliances — Dated design
- Minor Bathroom fixtures — Standard fixtures
Value-add opportunities
- Both New kitchen appliances — Modernizes the space and improves functionality
- Both Paint interior walls — Fresh paint enhances curb appeal and interior aesthetics
- Both Replace carpet with hardwood flooring — Hardwood flooring is more durable and adds value
- Both Update bathroom fixtures — Modern fixtures improve functionality and aesthetics
Renovation cost estimate screening
| Repair item | Severity | Est. cost |
|---|---|---|
| Marble stairs · Some wear | Minor | $500–3,000 |
| Kitchen appliances · Dated design | Moderate | $3,000–15,000 |
| Bathroom fixtures · Standard fixtures | Minor | $500–3,000 |
| Total estimated repair cost · 3 items | $4,000–21,000 |
Value-add ROI direction
- Both New kitchen appliances — Modernizes the space and improves functionality ↑
- Both Paint interior walls — Fresh paint enhances curb appeal and interior aesthetics ↑
- Both Replace carpet with hardwood flooring — Hardwood flooring is more durable and adds value ↑
- Both Update bathroom fixtures — Modern fixtures improve functionality and aesthetics ↑
ⓘ Cost ranges are severity-bucket heuristics (US national rule-of-thumb). Get contractor quotes + a written scope before underwriting a rehab budget.
Schools (NCES district)
- District
- Union City School District
- NCES district ID
- 3416380
- Math proficiency
- 15% ▼ -19.00%
- Reading proficiency
- 36% ▼ -19.00%
- Median HH income
- $41,210
- Composite
- 21.55/100
- National rank
- #8312
- State rank
- #399 of 472 in NJ
Livability — Union City
- Score
- 77/100
- State rank
- #117
- US rank
- #2998
Category grades
Schools grade is shown separately in the Schools card above.
Census & demographics
- Census place
- Union City, NJ
- County
- Hudson County · 718,323 people
- City population
- 66,463
- Metro
- New York-Newark-Jersey City, NY-NJ-PA
- Population (ZIP)
- 66,463
- Household income
- $64,310
- Rent vs Own
- Severe rent burden
- 6042.0
Population outlook (Hudson County) Hauer SSP2
- Today (2025)
- 771,834 people
- By 2030
- 818,028 · +6.0%
- By 2040
- 907,866 · +17.6%
- By 2050
- 994,480 · +28.8%
- By 2075
- 1,163,301 · +50.7%
- By 2100
- 1,254,703 · +62.6%
Race, ethnicity, and origin ACS 2023
- Neighborhood character
- Predominantly Hispanic (82%)
- Race & ethnicity
- Hispanic / Latino 82% Two or more races 28% White 10% Asian 4% Black 3% Native American 2%
- Hispanic origin (detail)
- Mexican 7% Puerto Rican 8% Cuban 9% Dominican 17%
- Foreign-born
- 55% · Canada, Jamaica, China
- Languages at home
- 18% English-only · Spanish 74% Other Indo-European 2% Arabic 1%
Political lean MEDSL · Hudson
- 2024 margin
- Strong D (+28.1) · D 62.6% · R 34.6% · Other 2.8%
- 2008→2024 swing
- -18.7pp toward R · 2008: 46.7pp · 2024: 28.1pp
- All cycles
- 2024: D+28.1 2020: D+46.2 2016: D+51.8 2012: D+55.7 2008: D+46.7
Not yet ingested
- Civics
- —
Market trends
- HPI YoY
- ▲ 52.10%
- Current HPI
- 597.8126
- Rent YoY
- ▲ 0.89%
- Metro
- New York-Newark-Jersey City, NY-NJ-PA
- State GDP YoY
- ▲ 2.05%
- F500 in state
- 34
Industry mix (Fortune 500 HQ in NJ)
| Industry | F500 HQs | Revenue |
|---|---|---|
| Consumer Goods | 3 | $31B |
|
||
| Pharmaceuticals | 2 | $153B |
|
||
| Technology | 2 | $21B |
|
||
| Insurance | 2 | $20B |
|
||
| Healthcare | 2 | $19B |
|
||
| Financial Services | 1 | $70B |
|
||
Price history
1 event — show timeline
- 2026-05-27 Listed $162,000 HCMLS
Cash-flow waterfall
monthlySold comps — $/sqft
last 12 mo · ≤1 miLoading sold comps…