 Duplex
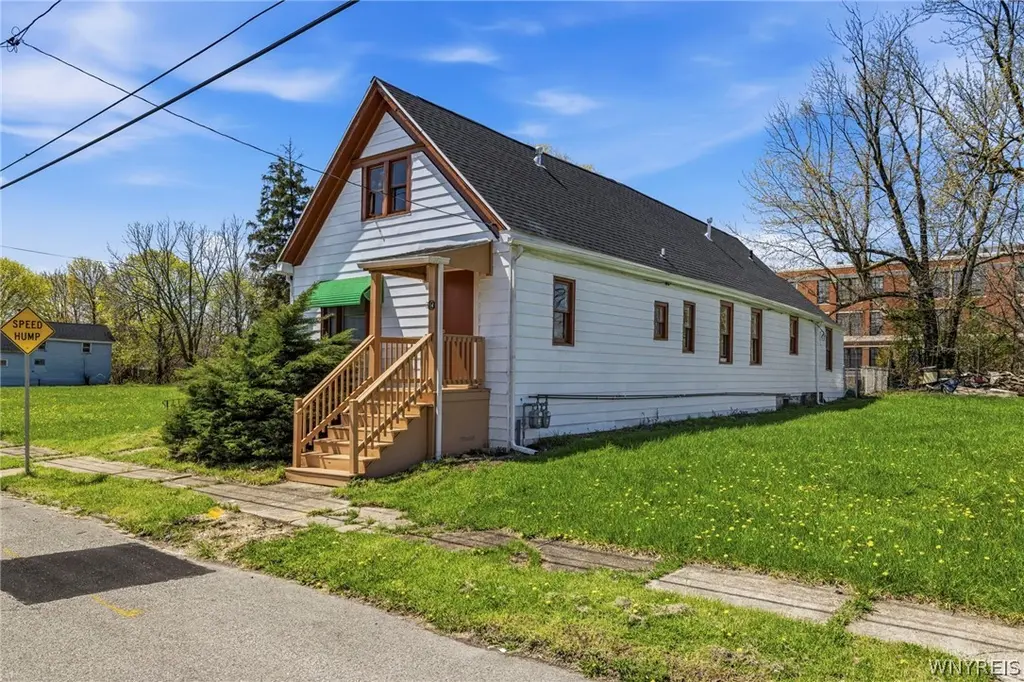
214 Shumway St · Buffalo, NY
Flood risk 3/10 · Minor
- FEMA flood zone
- X (unshaded)
- Chance of flooding over 30 yrs
- 0.2%
- Est. flood insurance / yr
- $473 – $860
Fire risk 1/10 · Minimal
- Est. fire insurance / yr
- $691 – $1,283
Heat risk 3/10 · Minor
- Hot days now (above 92°F)
- 7 days/yr
- Hot days in 30 yrs
- 15 days/yr
Wind risk 1/10 · Minimal
- Chance of severe wind over 30 yrs
- —
Air-quality risk 3/10 · Minor
- Unhealthy air days now
- 2 days/yr
- Unhealthy air days in 30 yrs
- 3 days/yr
Risk factors via First Street. Map © Google.
Why this score? — see what drove the A- grade
The composite is a weighted blend of 9 inputs, each scored 0–100. Each bar is that input's sub-score; the figure is the points it added to the 100-point composite (weight × sub-score).
- Cash flow +28.6/30.0
- ARV discount +14.8/15.0
- DSCR +10.0/10.0
- Appreciation +10.0/10.0
- 1% rule +7.9/10.0
- Livability +3.9/5.0
- Schools +3.3/10.0
- Rent growth +2.5/5.0
- Condition / age +2.5/5.0
$149,900
🖨 Deal sheet 📄 Offer letter ✓ Due diligence
Multi-family units
County records classify this as Multi-Family (2-4 Unit). Listing-text estimate: 2 units. confirmed
Listing remarks
Well-maintained 2-unit home offering a great opportunity for both owner-occupants and investors on Buffalo’s East Side. Each flat features 2 bedrooms and 1 full bath, providing flexible living space or solid rental income potential in a convenient city location. Both units offer comfortable room sizes and practical layouts designed for everyday living. A manageable lot and traditional neighborhood setting make maintenance straightforward while still offering outdoor space for tenants or owners to enjoy. Located close to major routes, neighborhood amenities, and public transportation, this multi-family home is positioned for strong rental demand and long-term upside. Whether you are ad
Key facts
- Solid rental income
- Major routes
- 2 unit home
Tags
Property features AI
Finance
- Financial info: Owner pays water; water included in rent; Operating expenses include water
Exterior
- Parking: Concrete parking
- Utilities: Public water connected; Sewer connected; Circuit breaker electric
- Home design: Single-story building; Multifamily property with 2 total units; Resale condition
- Construction: Vinyl siding; PEX plumbing; Asphalt roof; Pillar/post/pier foundation; Existing (year built details)
- Exterior features: Near public transit; Rectangular residential lot; City street frontage
Interior
- Kitchen: Gas water heater
- Bedrooms: Two 2-bedroom units (each with living room and formal dining room)
- Flooring: Tile; Vinyl; Varies
- Bathrooms: Each unit has 1 full bathroom (total 2 full bathrooms)
- Heating & cooling: Gas forced-air heating
- Interior features: Accessible doors; Crawl space basement
- Laundry & utility: Separate gas meters for each unit; Separate electric meters for each unit
Neighborhood map
What this means for you Summary
Snapshot
- This is a 2 × 2-bed/1.0-bath units multifamily listed at $150k.
Deal economics
- At list price, monthly cash flow is $495 ($6k/yr) — positive. Per door: $248/mo.
- The deal already cash-flows at list — no discount required.
- Meets the 1% rule at list price ($2k rent vs $150k).
- Recommended offer: $145k (3.0% below list) — sets the bar for market timing.
- Cap rate 10.3% vs local median 8.0% in Buffalo — meaningfully above typical; check what's discounted (condition, days-on-market, listing class) to confirm the premium yield is real.
Location & tenants
- Location reads 77/100 on livability (#195 in NY, #3,011 nationally) — a middle-class / working-renter tenant base. Strengths: commute A+, housing A+, health & safety A+; Watch: crime F, employment D-.
- Buffalo City School District (urban): math 41% / reading 40% proficiency, ranked #535 of 590 in NY (top 91%) — families likely to look elsewhere, expect single-tenant / working-renter base with shorter leases; 75% free/reduced lunch — lower-income household profile, screen leases tightly.
- Market conditions: 83 active listings in the ZIP; 3 comparable units currently listed for rent nearby; rentals at typical pace (median 24d on market — plan ~3-4 weeks tenant-placement turnaround); 1,244 units permitted in Erie County in 2024 (563 in 5+ unit buildings).
Forward outlook
- In year one you build about $16k of equity ($1k loan paydown + $15k appreciation (10.0% local appreciation)).
- At projected returns (10.0% appreciation + 3.0% rent growth), your $42k cash investment doubles in ~2 years — after that, you're playing with house money.
- By year 3, paydown + projected appreciation supports a ~$41k cash-out refi (75% LTV) — recoverable capital for the next deal without selling this one.
Negotiation context
- It's been on market 51 days — a 3% lower offer ($145k) is reasonable based on typical stale-listing flexibility.
- Current owner paid $50k; list at $150k implies a 200% gain — meaningful room to come down on a strong offer.
Risks & watch-outs
- Watch-outs: built in 1910 — expect roof / HVAC / electrical / plumbing capex.
Questions for the listing agent
- It's been on market 51 days. Have you received any prior offers? Is the seller open to a 3% concession, seller financing, or rate buy-down credit?
- Can we see the unit-by-unit rent roll, current vacancy, and any below-market leases? What's the average tenancy length?
- What capital expenditures (roof, boiler, parking lot, exteriors) have been made in the last 5 years, and what's planned in the next 2?
- Built in 1910 — when were the roof, HVAC, electrical panel, plumbing, and water heater last replaced?
- Is there a deadline driving the sale (1031 exchange, divorce, estate, relocation)? That informs how much negotiation room exists.
- Crime grade is F in this area — have there been break-ins, vandalism, or insurance claims at this property in the last 3 years? What carrier currently insures it and at what premium?
- What's the average days-on-market for RENTAL listings here right now (not sales)? A rising rental-DOM trend means longer vacancies and softer asking-rent achievability than the comps imply.
- What's the recent tenant-quality profile in this submarket — average credit score on applications, eviction rate, late-payment / NSF rate, and stable-employment percentage? A property-management company in the area should have these aggregated.
- How much new apartment / multifamily construction is in the pipeline within 1–3 miles? Heavy new supply (>2% of stock underway) typically softens rents 12–24 months out; light construction supports rent growth.
Investment metrics
- 1% rule
- 1.29% ✓
- Cap rate
- 10.26%
- Cash-on-cash
- 14.16%
- DSCR
- 1.63
- GRM
- 6.4
CMA / ARV
- ARV (median comp)
- $178,943
- List price
- $149,900
- Delta
- -16.23%
- Verdict
- UNDERPRICED
- Comps
- 20 within 1.0 mi
Show comp detail 3 sales within ~0.75 mi
| Address | Dist | Beds/Ba | Sqft | Sold | Price | $/sf | Match |
|---|---|---|---|---|---|---|---|
| 88 Coit St #2 | 0.26mi | 5/2.0 (+1) | 1,407 (-3%) | 6mo | $135,000 | $96 | 72 |
| 121 Reed St | 0.48mi | 4/3.0 | 1,611 (+11%) | 16mo | $155,000 | $96 | 42 |
| 132 Gibson St | 0.35mi | 3/2.0 (-1) | 1,626 (+12%) | 23mo | $160,000 | $98 | 40 |
Match score weights: distance 35% · size 25% · config 20% · recency 20%. Top-matched comps best support the ARV.
Projected returns pro-forma
10.0% appreciation · 3.0% rent growth · sell at horizon
- IRR
- 34.7%
- Equity multiple
- 3.70×
- Total profit
- $113,202
- Equity at exit
- $135,042
- IRR
- 29.9%
- Equity multiple
- 8.35×
- Total profit
- $308,621
- Equity at exit
- $291,223
Cash invested: $41,972 (down + closing). Projections, not guarantees.
Landlord ↔ Tenant lean methodology
- Overall (STATE)
- 15 Strongly Tenant-Friendly
- State New York
- 15 Strongly Tenant-Friendly · D+10
- County
- — inherits STATE
- City
- — inherits STATE
ZIP-level market 14212
- Home prices YoY
- 20.4%
- Active inventory
- 83
- Price-to-rent
- 12.9×
Monthly cashflow live
- Estimated rent
- $1,938 high interval (Pro) →
- Mortgage (P&I)
- −$786
- Tax est. 1.5%
- −$187 /mo · $2,248/yr
- Insurance
- −$62
- HOA
- −$0
- Vacancy / Maint / Mgmt
- −$407
- Net cashflow
- $495
Break-even live
2-unit breakdown (identical units grouped — click to expand)
| Units | Beds | Baths | Est. rent |
|---|---|---|---|
| 2× units | 2 | 1 | $1,938 |
| #1 | 2 | 1 | $969 |
| #2 | 2 | 1 | $969 |
| Total (2 units) | $1,938 | ||
UW: 25.0% down · 7.5% · 30yr · 1.5% tax · 5.0% vac · 8.0% maint · 8.0% mgmt
Financing live
Cash to close
- Down payment
- $37,475
- Closing costs
- $4,497
- Reserves months
- —
- Total cash needed
- —
Loan-product check · same deal, 3 products live
Conventional
25% down · 7.5% · 30yr
- Down + closing
- —
- Monthly P&I
- —
- Monthly cashflow
- —
- DSCR
- —
- Eligible?
- —
Personal DTI + credit; lowest rate.
DSCR
20% down · 8.5% · 30yr
- Down + closing
- —
- Monthly P&I
- —
- Monthly cashflow
- —
- DSCR
- —
- Eligible?
- —
No personal income docs; deal must DSCR.
Hard money
10% down · 12.0% · 12mo
- Down + closing
- —
- Monthly P&I
- —
- Monthly cashflow
- —
- DSCR
- —
- Eligible?
- —
Short-term bridge; refi at stabilization.
Rent comps 3 comps
| Address | Beds | Baths | Sqft | Rent | $/sqft | DOM | Units | Dist |
|---|---|---|---|---|---|---|---|---|
| 518 Wilson St Buffalo, NY | 5.0 | 1.5 | 1848 | $1,500 | $0.81 | 23d | 1 | 0.75mi |
| 17 N Pearl St Unit 3 Buffalo, NY | 3.0 | 2.0 | 1197 | $3,100 | $2.59 | 23d | 1 | 1.46mi |
| 44 N Pearl St #5 Buffalo, NY | 3.0 | 1.0 | 1200 | $2,400 | $2.00 | 43d | 1 | 1.50mi |
Listing history 17 events
-
2026-06-18days on market $149,900 Active 51 DOM
-
2026-06-17days on market $149,900 Active 50 DOM
-
2026-06-16days on market $149,900 Active 49 DOM
-
2026-06-15days on market $149,900 Active 48 DOM
-
2026-06-13days on market $149,900 Active 46 DOM
-
2026-06-13days on market $149,900 Active 45 DOM
-
2026-06-10days on market $149,900 Active 43 DOM
-
2026-06-09days on market $149,900 Active 42 DOM
-
2026-06-08days on market $149,900 Active 41 DOM
-
2026-06-07days on market $149,900 Active 40 DOM
-
2026-06-03days on market $149,900 Active 36 DOM
-
2026-06-02days on market $149,900 Active 35 DOM
-
2026-06-01days on market $149,900 Active 34 DOM
-
2026-05-31days on market $149,900 Active 33 DOM
-
2026-04-27$149,900 Active 826-char remark
-
2021-09-17soldstatus $50,000
-
2021-07-23soldstatus $50,000
ⓘ Source: listings_history table (triggers on properties + properties_extension) + one-shot
backfill from property_details.listing_events for pre-trigger history.
Climate risk First Street
- Flood 3/10 Moderate FEMA zone X (unshaded) · 20% chance over 30 yrs
- Wildfire 1/10 Low
- Heat 3/10 Moderate 7 d/yr ≥92°F today · 15 d/yr by 30 yrs out
- Wind 1/10 Low
- Air quality 3/10 Moderate 2 unhealthy d/yr today · 3 by 30 yrs out
Nearby sold comps map
Loading sold comps map…
Walkable amenities ~0.75 mi
Loading nearby amenities…
Taxation est. · year 1
- Rental income
- $23,256
- − Mortgage interest
- −$8,397
- − Property taxes
- −$2,248
- − Insurance
- −$750
- − Repairs & maintenance
- −$1,860
- − Management
- −$1,860
- − Depreciation
- −$4,361
- Taxable income
- $3,780
- Est. tax owed @ 24.0%
- −$907
- After-tax cash flow
- $5,034/yr
For passive investors: Depreciation is non-cash, so a rental often shows a tax loss while cash-flowing — sheltering income. Rental losses are passive: they offset passive income freely, and up to $25,000/yr can offset ordinary (W-2) income if you actively participate and your MAGI is under $100k (phasing out to $0 by $150k); unused losses carry forward. On sale, claimed depreciation is recaptured at up to 25%, and gains may owe capital-gains tax (a 1031 exchange can defer both). Figures are a year-1 estimate at your 24.0% rate — not tax advice; consult a CPA.
Schools (NCES district)
- District
- Buffalo City School District
- NCES district ID
- 3605850
- Math proficiency
- 41% ▲ 11.00%
- Reading proficiency
- 40% ▲ 7.00%
- Median HH income
- $31,665
- Composite
- 33.17/100
- National rank
- #5544
- State rank
- #535 of 590 in NY
Livability — Buffalo
- Score
- 77/100
- State rank
- #195
- US rank
- #3011
Category grades
Schools grade is shown separately in the Schools card above.
Census & demographics
- Census place
- Buffalo, NY
- City population
- 440,021
- Population (ZIP)
- 13,603
Population outlook (Erie County) Hauer SSP2
- Today (2025)
- 933,037 people
- By 2030
- 935,181 · +0.2%
- By 2040
- 928,531 · -0.5%
- By 2050
- 905,725 · -2.9%
- By 2075
- 834,037 · -10.6%
- By 2100
- 708,033 · -24.1%
Race, ethnicity, and origin ACS 2023
- Neighborhood character
- Highly diverse neighborhood (Simpson 0.75)
- Race & ethnicity
- White 32% Black 27% Asian 25% Hispanic / Latino 9% Two or more races 8%
- Hispanic origin (detail)
- Puerto Rican 8%
- Common ancestry
- Romanian 12% Serbian 1% Lithuanian 1%
- Foreign-born
- 20% · Philippines, Canada, China
- Languages at home
- 68% English-only · Other Indo-European 18% Spanish 4% Other Asian/Pacific 2%
Political lean MEDSL · Erie
- 2024 margin
- Lean D (+9.7) · D 54.8% · R 45.2%
- 2008→2024 swing
- -7.9pp toward R · 2008: 17.5pp · 2024: 9.7pp
- All cycles
- 2024: D+9.7 2020: D+14.7 2016: D+4.8 2012: D+15.6 2008: D+17.5
Not yet ingested
- Civics
- —
Market trends
- HPI YoY
- ▲ 79.80%
- Current HPI
- 471.6399
- Rent YoY
- —
- Metro
- —
- State GDP YoY
- ▲ 2.60%
- F500 in state
- 92
Industry mix (Fortune 500 HQ in NY)
| Industry | F500 HQs | Revenue |
|---|---|---|
| Financial Services | 10 | $950B |
|
||
| Consumer Goods | 9 | $162B |
|
||
| Insurance | 4 | $225B |
|
||
| Telecommunications | 2 | $144B |
|
||
| Pharmaceuticals | 2 | $112B |
|
||
| Media / Entertainment | 2 | $69B |
|
||
Price history
+199.8% since first listed3 events — show timeline
- 2026-04-27 Listed $149,900 WNYREIS
- 2021-09-17 Sold (Public Records) $50,000 Public Records
- 2021-07-23 Sold (Public Records) $50,000 Public Records
Property tax history
+12.2%/yrLatest (2025): $192 · +42.4% YoY. Source: county tax records.
Cash-flow waterfall
monthlySold comps — $/sqft
last 12 mo · ≤1 miLoading sold comps…