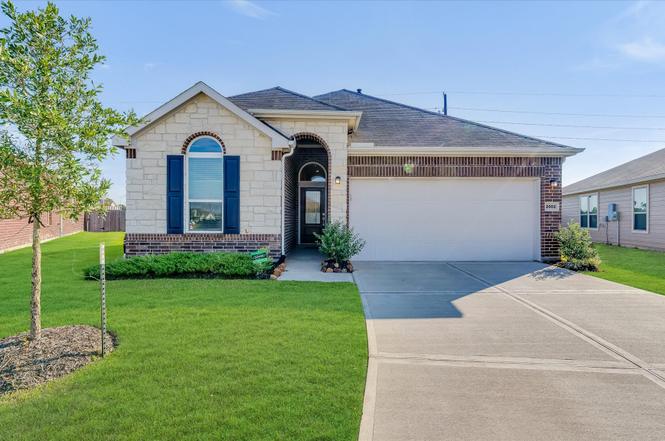
2003 Domeniko Dr · Fresno, TX
Flood risk 6/10 · Moderate
- FEMA flood zone
- X (unshaded)
- Chance of flooding over 30 yrs
- 0.68%
- Est. flood insurance / yr
- $507 – $1,088
Fire risk 4/10 · Minor
- Est. fire insurance / yr
- $1,222 – $2,270
Heat risk 9/10 · Severe
- Hot days now (above 110°F)
- 7 days/yr
- Hot days in 30 yrs
- 23 days/yr
Wind risk 9/10 · Severe
- Chance of severe wind over 30 yrs
- 99.0%
Air-quality risk 3/10 · Minor
- Unhealthy air days now
- 2 days/yr
- Unhealthy air days in 30 yrs
- 3 days/yr
Risk factors via First Street. Map © Google.
Why this score? — see what drove the D- grade
The composite is a weighted blend of 9 inputs, each scored 0–100. Each bar is that input's sub-score; the figure is the points it added to the 100-point composite (weight × sub-score).
- Cash flow +8.5/30.0
- ARV discount +6.5/15.0
- Schools +4.5/10.0
- Appreciation +4.0/10.0
- Livability +3.1/5.0
- 1% rule +2.9/10.0
- Condition / age +2.5/5.0
- DSCR +2.3/10.0
- Rent growth +2.3/5.0
$337,000
🖨 Deal sheet 📄 Offer letter ✓ Due diligence
Listing remarks MLS
Enjoy every moment spent in this lovely KB Home in Olympia Falls, boasting a brick front and stone veneer, tile flooring, extended entry, a fireplace, and open great room. Try a new recipe in the kitchen, equipped with granite countertops, stainless steel Energy Star® appliances, and 42-in. cabinets. The serene primary suite features extended dual vanities, a 42-in. Kohler Master Windward® tub, and a separate shower. Additional home features include faux wood blinds and a covered patio. The community comforts of Olympia Falls include a park, playground, and walking trails. Conveniently located near Fort Bend Parkway Toll Rd. and I-69, residents enjoy nearby shopping and dining at the Riverstone Shopping Center, Missouri City Shopping Center, First Colony Mall, and Pearland Town Center. Students attend the highly-rated Fort Bend ISD.
Key facts
- Gourmet kitchen
- Covered patio
- Walk in closet
Tags
Property features AI
Finance
- Other: Seller disclosure available
- Financial info: Lease considered
- HOA & community: HOA managed by VCM Management; Annual association fee of $750 (includes recreation facilities)
Exterior
- Parking: Attached 2-car garage
- Utilities: Has heating; Has cooling
- Home design: Residential property; Single-story (first-floor living); Builder: KB Homes; Facing direction not specified
- Construction: Built in 2023; Brick construction; Shingle and wood roof; Slab foundation
- Exterior features: Cul-de-sac lot
Interior
- Kitchen: Dishwasher; Disposal; Ice maker; Microwave; Trash compactor
- Bedrooms: Primary bedroom on first floor (15 x 19); Additional bedrooms on first floor (10 x 10, 10 x 10); One possible extra bedroom
- Bathrooms: 2 full bathrooms
- Heating & cooling: Central heating (gas); Central electric air conditioning
- Interior features: Granite counters; Electric fireplace (1)
Neighborhood map
What this means for you Summary
Snapshot
- This is a 3-bed/2.0-bath single-family listed at $337k.
Deal economics
- At list price, monthly cash flow is $-299 ($-4k/yr) — negative.
- To cash-flow at today's rent, offer at most $294k (12.8% below list).
- To meet the 1% rule (rent ≥ 1% of price), the offer needs to be $265k (21.4% below list).
- Recommended offer: $265k (21.4% below list) — sets the bar for 1% rule.
Location & tenants
- Location reads 62/100 on livability (#943 in TX) — a middle-class / working-renter tenant base. Strengths: employment A+, housing A+, cost of living A; Watch: crime C-, amenities F, commute F.
- Fort Bend ISD (suburban): math 44% / reading 53% proficiency, ranked #140 of 826 in TX (top 17%) — families likely to look elsewhere, expect single-tenant / working-renter base with shorter leases.
- Zoned schools: Blue Ridge El (math 8% / reading 17%, grade F, #4,180 of 4,322 statewide, top 97%, 263 students, 89% FRL); Christa Mcauliffe Middle (math 9% / reading 20%, grade F, #1,583 of 1,662 statewide, top 96%, 835 students, 94% FRL); Willowridge H S (math 12% / reading 29%, grade F, #1,389 of 1,632 statewide, top 86%, 1,319 students, 87% FRL) — zoned schools average 90% FRL vs 35% district-wide (55 pts higher); higher-poverty schools than district average — tighter screening recommended.
- Zoned-school proficiency averages 16% at this address vs 48% district-wide (-33 pts) — the specific schools serving this property underperform the Fort Bend ISD average; the district grade overstates school quality for this exact location.
- Market conditions: Rents soft (-0.9%/yr); 175 active listings in the ZIP; 9 comparable units currently listed for rent nearby; rentals at typical pace (median 21d on market — plan ~3-4 weeks tenant-placement turnaround); solid renter incomes; 12,093 units permitted in Fort Bend County in 2024 (815 in 5+ unit buildings).
- This rent runs 34% of the median local income ($94k/yr) — at the standard rent-burdened threshold; future hikes will face affordability resistance.
Forward outlook
- Local home prices are declining (-2.0%/yr); year-one equity from $2k of loan paydown is wiped out by about $7k of value loss. Plan a longer hold.
- Fort Bend County population projected at +75% by 2050 — long-run rental-demand tailwind backs the buy-and-hold thesis.
Negotiation context
- It's been on market 105 days — a 9% lower offer ($307k) is reasonable based on typical stale-listing flexibility.
- 4 sale attempts since 3y ago; this cycle's ask is 900% above the opening price — seller raised mid-cycle; expect resistance to lowballs.
Risks & watch-outs
- Climate carrying-cost: major flood risk; severe wind risk, 99% chance of damaging wind over 30y; extreme-heat days projected 7→23/yr by 2055 (HVAC capex compounding) — expect insurance premiums to compound above CPI over the hold.
Questions for the listing agent
- What do current leases actually rent for vs. the listed asking? Can we see a recent rent roll and the last 12 months of T-12 income?
- It's been on market 105 days. Have you received any prior offers? Is the seller open to a 21% concession, seller financing, or rate buy-down credit?
- What does the HOA fee cover, when was the last increase, and are there any pending special assessments or reserve-fund shortfalls?
- Why hasn't it sold? Are there any deal-killer items the seller is aware of (foundation, flood, title, zoning, code violations)?
- Is there a deadline driving the sale (1031 exchange, divorce, estate, relocation)? That informs how much negotiation room exists.
- Schools are D-rated, which usually means shorter tenancies and higher turnover. Who's the typical renter profile here, and what's been the actual vacancy rate?
- The area grade is low — what's the realistic commute time and amenity access for the typical tenant pool here? Any planned neighborhood developments (good or bad) we should know about?
- What's the average days-on-market for RENTAL listings here right now (not sales)? A rising rental-DOM trend means longer vacancies and softer asking-rent achievability than the comps imply.
- What's the recent tenant-quality profile in this submarket — average credit score on applications, eviction rate, late-payment / NSF rate, and stable-employment percentage? A property-management company in the area should have these aggregated.
- How much new for-sale + rental construction is in the pipeline within 1–3 miles? Heavy new supply typically softens prices + rents 12–24 months out; constrained supply supports both.
Investment metrics
- 1% rule
- 0.79% ✗
- Cap rate
- 5.23%
- Cash-on-cash
- -3.80%
- DSCR
- 0.83
- GRM
- 10.6
CMA / ARV
- ARV (on-the-fly)
- $329,586
- Comps found
- 12
Show comp detail 12 sales within ~0.75 mi
| Address | Dist | Beds/Ba | Sqft | Sold | Price | $/sf | Match |
|---|---|---|---|---|---|---|---|
| 1943 Bemus Dr | 0.08mi | 3/2.0 | 1,944 (-4%) | 2mo | $324,995 | $167 | 88 |
| 1523 Grand Olympia Dr | 0.07mi | 3/2.0 | 2,130 (+5%) | 3mo | $336,259 | $158 | 85 |
| 2810 Lyra Ct | 0.13mi | 3/2.0 | 1,889 (-7%) | 7mo | $319,995 | $169 | 77 |
| 1423 Grand Olympia Dr | 0.02mi | 4/3.0 (+1) | 2,130 (+5%) | 7mo | $369,995 | $174 | 75 |
| 2115 Katalonia Ln | 0.16mi | 3/2.0 | 2,206 (+9%) | 5mo | $320,000 | $145 | 73 |
| 1930 Livadero Ln | 0.31mi | 3/2.0 | 1,889 (-7%) | 4mo | $314,995 | $167 | 71 |
| 2731 Dry Creek Dr | 0.54mi | 3/2.0 | 2,111 (+4%) | 5mo | $345,000 | $163 | 63 |
| 2643 Dry Creek Dr | 0.53mi | 4/2.0 (+1) | 2,133 (+6%) | 1mo | $300,000 | $141 | 60 |
| 3234 Selene Dr | 0.74mi | 3/2.0 | 1,905 (-6%) | 5mo | $320,000 | $168 | 52 |
| 3327 Chimera Ln | 0.73mi | 4/2.0 (+1) | 1,787 (-12%) | 6mo | $279,000 | $156 | 36 |
| 2822 Goodman Ridge Dr | 0.73mi | 4/2.5 (+1) | 1,778 (-12%) | 8mo | $285,000 | $160 | 32 |
| 3218 Clayton Terrace Dr | 0.70mi | 4/3.0 (+1) | 2,278 (+13%) | 7mo | $290,000 | $127 | 32 |
Match score weights: distance 35% · size 25% · config 20% · recency 20%. Top-matched comps best support the ARV.
Projected returns pro-forma
-1.98% appreciation · 0.0% rent growth · sell at horizon
- IRR
- -18.7%
- Equity multiple
- 0.29×
- Total profit
- $-66,752
- Equity at exit
- $65,751
- IRR
- -16.4%
- Equity multiple
- -0.05×
- Total profit
- $-99,310
- Equity at exit
- $56,477
Cash invested: $94,360 (down + closing). Projections, not guarantees.
Landlord ↔ Tenant lean methodology
- Overall (STATE)
- 87 Strongly Landlord-Friendly
- State Texas
- 87 Strongly Landlord-Friendly · R+5
- County
- — inherits STATE
- City
- — inherits STATE
ZIP-level market 77545
- Home prices YoY
- -0.8%
- Rents YoY
- -0.9%
- Active inventory
- 175
- Price-to-rent
- 10.6×
Monthly cashflow live
- Estimated rent
- $2,650 high interval (Pro) →
- Mortgage (P&I)
- −$1,767
- Tax est. 1.5%
- −$421 /mo · $5,055/yr
- Insurance
- −$140
- HOA
- −$63
- Vacancy / Maint / Mgmt
- −$556
- Net cashflow
- $-299
Break-even live
UW: 25.0% down · 7.5% · 30yr · 1.5% tax · 5.0% vac · 8.0% maint · 8.0% mgmt
Financing live
Cash to close
- Down payment
- $84,250
- Closing costs
- $10,110
- Reserves months
- —
- Total cash needed
- —
Loan-product check · same deal, 3 products live
Conventional
25% down · 7.5% · 30yr
- Down + closing
- —
- Monthly P&I
- —
- Monthly cashflow
- —
- DSCR
- —
- Eligible?
- —
Personal DTI + credit; lowest rate.
DSCR
20% down · 8.5% · 30yr
- Down + closing
- —
- Monthly P&I
- —
- Monthly cashflow
- —
- DSCR
- —
- Eligible?
- —
No personal income docs; deal must DSCR.
Hard money
10% down · 12.0% · 12mo
- Down + closing
- —
- Monthly P&I
- —
- Monthly cashflow
- —
- DSCR
- —
- Eligible?
- —
Short-term bridge; refi at stabilization.
Rent comps 9 comps
| Address | Beds | Baths | Sqft | Rent | $/sqft | DOM | Units | Dist |
|---|---|---|---|---|---|---|---|---|
| 3106 Presley Jane Ct Missouri City, TX | 3.0 | 2.0 | 2109 | $2,271 | $1.08 | 5d | 1 | 0.62mi |
| 3212 Aldridge Dr Missouri City, TX | 4.0 | 2.5 | 2489 | $2,650 | $1.06 | 20d | 1 | 0.67mi |
| 3218 Clayton Terrace Dr Missouri City, TX | 4.0 | 3.0 | 2278 | $2,395 | $1.05 | 19d | 1 | 0.68mi |
| 2707 Troy Dr Missouri City, TX | 3.0 | 2.5 | 2082 | $2,245 | $1.08 | 1d | 1 | 0.70mi |
| 2709 Troy Dr Missouri City, TX | 3.0 | 2.5 | 2082 | $2,245 | $1.08 | 20d | 1 | 0.70mi |
| 2235 Argos Dr Missouri City, TX | 4.0 | 3.5 | 2838 | $2,550 | $0.90 | 20d | 1 | 0.82mi |
| 3314 Dry Creek Dr Missouri City, TX | 4.0 | 3.0 | 2600 | $4,200 | $1.62 | 43d | 1 | 0.96mi |
| 3211 Breckinridge Ct Missouri City, TX | 4.0 | 2.5 | 2920 | $2,550 | $0.87 | 20d | 1 | 1.18mi |
| 1109 Lakes Edge Ln Missouri City, TX | 4.0 | 3.0 | 2847 | $2,800 | $0.98 | 20d | 1 | 1.19mi |
HOA detail
- Monthly dues
- $63 · $756/yr
Listing history 10 events
-
2026-06-18days on market $337,000 Active 105 DOM
-
2026-06-17days on market $337,000 Active 104 DOM
-
2026-06-16days on market $337,000 Active 103 DOM
-
2026-06-15days on market $337,000 Active 102 DOM
-
2026-06-13days on market $337,000 Active 100 DOM
-
2026-06-09days on market $337,000 Active 96 DOM
-
2026-06-07days on market $337,000 Active 94 DOM
-
2026-06-04days on market $337,000 Active 91 DOM
-
2026-06-03remarks 659-char remark
-
2026-06-03$337,000 Active 90 DOM
ⓘ Source: listings_history table (triggers on properties + properties_extension) + one-shot
backfill from property_details.listing_events for pre-trigger history.
Climate risk First Street
- Flood 6/10 Major FEMA zone X (unshaded) · 68% chance over 30 yrs
- Wildfire 4/10 Moderate
- Heat 9/10 Extreme 7 d/yr ≥110°F today · 23 d/yr by 30 yrs out
- Wind 9/10 Extreme 99% chance of damaging wind over 30 yrs
- Air quality 3/10 Moderate 2 unhealthy d/yr today · 3 by 30 yrs out
Nearby sold comps map
Loading sold comps map…
Walkable amenities ~0.75 mi
Loading nearby amenities…
Taxation est. · year 1
- Rental income
- $31,794
- − Mortgage interest
- −$18,877
- − Property taxes
- −$5,055
- − Insurance
- −$1,685
- − Repairs & maintenance
- −$2,544
- − Management
- −$2,544
- − HOA
- −$756
- − Depreciation
- −$9,804
- Taxable loss
- −$9,470
- Est. tax savings @ 24.0%
- +$2,273
- After-tax cash flow
- $-1,313/yr
For passive investors: Depreciation is non-cash, so a rental often shows a tax loss while cash-flowing — sheltering income. Rental losses are passive: they offset passive income freely, and up to $25,000/yr can offset ordinary (W-2) income if you actively participate and your MAGI is under $100k (phasing out to $0 by $150k); unused losses carry forward. On sale, claimed depreciation is recaptured at up to 25%, and gains may owe capital-gains tax (a 1031 exchange can defer both). Figures are a year-1 estimate at your 24.0% rate — not tax advice; consult a CPA.
Schools (NCES district)
- District
- Fort Bend ISD
- NCES district ID
- 4819650
- Math proficiency
- 44% ▼ -15.00%
- Reading proficiency
- 53% ▼ -4.00%
- Median HH income
- $82,360
- Composite
- 44.61/100
- National rank
- #2779
- State rank
- #140 of 826 in TX
Livability — Fresno
- Score
- 62/100
- State rank
- #943
- US rank
- #16815
Category grades
Schools grade is shown separately in the Schools card above.
Census & demographics
- Census place
- Fresno, TX
- County
- Fort Bend County · 836,777 people
- City population
- 26,236
- Metro
- Houston-The Woodlands-Sugar Land, TX
- Population (ZIP)
- 26,236
- Household income
- $94,474
- Rent vs Own
- Severe rent burden
- 360.0
Population outlook (Fort Bend County) Hauer SSP2
- Today (2025)
- 1,004,526 people
- By 2030
- 1,153,104 · +14.8%
- By 2040
- 1,453,718 · +44.7%
- By 2050
- 1,753,781 · +74.6%
- By 2075
- 2,455,772 · +144.5%
- By 2100
- 2,930,528 · +191.7%
Race, ethnicity, and origin ACS 2023
- Neighborhood character
- Diverse neighborhood (Simpson 0.61)
- Race & ethnicity
- Black 51% Hispanic / Latino 34% Two or more races 12% White 8% Asian 2%
- Hispanic origin (detail)
- Mexican 29%
- Common ancestry
- Portuguese 1%
- Foreign-born
- 18% · Canada
- Languages at home
- 67% English-only · Spanish 29% Other Asian/Pacific 1% Other Indo-European 1%
Political lean MEDSL · Fort Bend
- 2024 margin
- Toss-up / Even · D 49.5% · R 47.9% · Other 2.6%
- 2008→2024 swing
- +4.0pp toward D · 2008: -2.4pp · 2024: 1.6pp
- All cycles
- 2024: D+1.6 2020: D+10.6 2016: D+6.6 2012: R+6.8 2008: R+2.4
Not yet ingested
- Civics
- —
Market trends
- HPI YoY
- ▼ -1.98%
- Current HPI
- 231.3921
- Rent YoY
- ▼ -0.95%
- Metro
- Houston-The Woodlands-Sugar Land, TX
- State GDP YoY
- ▲ 3.95%
- F500 in state
- 110
Industry mix (Fortune 500 HQ in TX)
| Industry | F500 HQs | Revenue |
|---|---|---|
| Energy | 16 | $1,198B |
|
||
| Technology | 5 | $198B |
|
||
| Engineering / Construction | 4 | $72B |
|
||
| Energy Services | 3 | $60B |
|
||
| Utilities | 3 | $41B |
|
||
| Healthcare | 2 | $330B |
|
||
Price history
-2.3% since first listed11 events — show timeline
- 2026-03-05 Price Changed $337,000 HARMLS
- 2026-03-05 Listed $33,700 HARMLS
- 2023-08-29 Sold (MLS) — HARMLS
- 2023-06-12 Pending — HARMLS
- 2023-05-25 Price Changed $329,995 HARMLS
- 2023-05-25 Relisted — HARMLS
- 2023-05-08 Pending — HARMLS
- 2023-05-05 Listing Removed — HARMLS
- 2023-05-05 Listed $334,995 HARMLS
- 2023-03-16 Price Changed $334,995 HARMLS
- 2023-02-13 Listed $344,995 HARMLS
Cash-flow waterfall
monthlySold comps — $/sqft
last 12 mo · ≤1 miLoading sold comps…