1531 Drexel Rd · Plantation Mobile Home Park, FL
Flood risk 1/10 · Minimal
- FEMA flood zone
- X (unshaded)
- Chance of flooding over 30 yrs
- 0.0%
- Est. flood insurance / yr
- $507 – $1,088
Fire risk 2/10 · Minimal
- Est. fire insurance / yr
- $947 – $1,759
Heat risk 10/10 · Severe
- Hot days now (above 105°F)
- 7 days/yr
- Hot days in 30 yrs
- 25 days/yr
Wind risk 10/10 · Severe
- Chance of severe wind over 30 yrs
- 99.0%
Air-quality risk 2/10 · Minimal
- Unhealthy air days now
- 1 days/yr
- Unhealthy air days in 30 yrs
- 1 days/yr
Risk factors via First Street. Map © Google.
Why this score? — see what drove the B grade
The composite is a weighted blend of 9 inputs, each scored 0–100. Each bar is that input's sub-score; the figure is the points it added to the 100-point composite (weight × sub-score).
- Cash flow +30.0/30.0
- 1% rule +10.0/10.0
- DSCR +10.0/10.0
- ARV discount +7.5/15.0
- Schools +4.3/10.0
- Condition / age +3.8/5.0
- Livability +3.5/5.0
- Rent growth +2.5/5.0
- Appreciation +0.0/10.0
$100,000
🖨 Deal sheet 📄 Offer letter ✓ Due diligence
Listing remarks
This spacious 3-bedroom, 2-bathroom home. Located within the meticulously maintained and professionally managed community of Meadowbrook WPB, this residence offers a peaceful retreat with generous living spaces designed for relaxation. Enjoy a vacation-like atmosphere every day in a neighborhood that prioritizes quality and ease of living. Contact us today to schedule your private showing and learn more about this home & acirc; & euro; & rdquo; this opportunity will not last long.
Key facts
- Built 1999
- Listed 36 days
Neighborhood map
What this means for you Summary
Snapshot
- This is a 3-bed/2.0-bath manufactured listed at $100k. Condition is rated good.
Deal economics
- At list price, monthly cash flow is $1k ($14k/yr) — positive.
- The deal already cash-flows at list — no discount required.
- Meets the 1% rule at list price ($2k rent vs $100k).
- Recommended offer: $97k (3.0% below list) — sets the bar for market timing.
Location & tenants
- Location reads 70/100 on livability (#430 in FL) — a middle-class / working-renter tenant base. Strengths: crime A+, cost of living A+, health & safety A+; Watch: schools F, amenities F, commute F.
- Palm Beach (suburban): math 46% / reading 53% proficiency, ranked #34 of 73 in FL (top 47%) — families likely to look elsewhere, expect single-tenant / working-renter base with shorter leases.
- Market conditions: Rents flat; 473 active listings in the ZIP; 40 comparable units currently listed for rent nearby; rentals at typical pace (median 25d on market — plan ~3-4 weeks tenant-placement turnaround); 3,974 units permitted in Palm Beach County in 2024 (1,012 in 5+ unit buildings).
- At $2,335/mo this rent would consume 54% of the median local household income ($52k/yr) (locally 2548% of renters already pay >50% of income on rent) — very limited rent-growth headroom before tenants either downsize or default.
Forward outlook
- Local home prices are declining (-3.0%/yr); year-one equity from $691 of loan paydown is wiped out by about $3k of value loss. Plan a longer hold.
- Palm Beach County population projected at +30% by 2050 — long-run rental-demand tailwind backs the buy-and-hold thesis.
- At projected returns (-3.0% appreciation + 0.0% rent growth), your $28k cash investment doubles in ~3 years — after that, you're playing with house money.
Negotiation context
- It's been on market 37 days — a 3% lower offer ($97k) is reasonable based on typical stale-listing flexibility.
- 4 sale attempts since 18y ago with the ask held roughly flat each time — persistent listings suggest the price (not the market) is what's stuck; bring a comps-based counter.
Risks & watch-outs
- Climate carrying-cost: severe wind risk, 99% chance of damaging wind over 30y; extreme-heat days projected 7→25/yr by 2055 (HVAC capex compounding) — expect insurance premiums to compound above CPI over the hold.
Questions for the listing agent
- It's been on market 37 days. Have you received any prior offers? Is the seller open to a 3% concession, seller financing, or rate buy-down credit?
- Is there a deadline driving the sale (1031 exchange, divorce, estate, relocation)? That informs how much negotiation room exists.
- Schools are F-rated, which usually means shorter tenancies and higher turnover. Who's the typical renter profile here, and what's been the actual vacancy rate?
- What's the average days-on-market for RENTAL listings here right now (not sales)? A rising rental-DOM trend means longer vacancies and softer asking-rent achievability than the comps imply.
- What's the recent tenant-quality profile in this submarket — average credit score on applications, eviction rate, late-payment / NSF rate, and stable-employment percentage? A property-management company in the area should have these aggregated.
- How much new for-sale + rental construction is in the pipeline within 1–3 miles? Heavy new supply typically softens prices + rents 12–24 months out; constrained supply supports both.
Investment metrics
- 1% rule
- 2.34% ✓
- Cap rate
- 20.14%
- Cash-on-cash
- 49.44%
- DSCR
- 3.20
- GRM
- 3.6
CMA / ARV
No comps found within radius.
Projected returns pro-forma
-3.0% appreciation · 0.02% rent growth · sell at horizon
- IRR
- 43.7%
- Equity multiple
- 2.80×
- Total profit
- $50,512
- Equity at exit
- $14,910
- IRR
- 48.3%
- Equity multiple
- 5.02×
- Total profit
- $112,460
- Equity at exit
- $8,646
Cash invested: $28,000 (down + closing). Projections, not guarantees.
Landlord ↔ Tenant lean methodology
- Overall (STATE)
- 87 Strongly Landlord-Friendly
- State Florida
- 87 Strongly Landlord-Friendly · R+3
- County
- — inherits STATE
- City
- — inherits STATE
ZIP-level market 33417
- Home prices YoY
- -29.2%
- Rents YoY
- 0.0%
- Active inventory
- 473
- Price-to-rent
- 3.6×
Monthly cashflow live
- Estimated rent
- $2,335 high interval (Pro) →
- Mortgage (P&I)
- −$524
- Tax est. 1.5%
- −$125 /mo · $1,500/yr
- Insurance
- −$42
- HOA
- −$0
- Vacancy / Maint / Mgmt
- −$490
- Net cashflow
- $1,154
Break-even live
UW: 25.0% down · 7.5% · 30yr · 1.5% tax · 5.0% vac · 8.0% maint · 8.0% mgmt
Financing live
Cash to close
- Down payment
- $25,000
- Closing costs
- $3,000
- Reserves months
- —
- Total cash needed
- —
Loan-product check · same deal, 3 products live
Conventional
25% down · 7.5% · 30yr
- Down + closing
- —
- Monthly P&I
- —
- Monthly cashflow
- —
- DSCR
- —
- Eligible?
- —
Personal DTI + credit; lowest rate.
DSCR
20% down · 8.5% · 30yr
- Down + closing
- —
- Monthly P&I
- —
- Monthly cashflow
- —
- DSCR
- —
- Eligible?
- —
No personal income docs; deal must DSCR.
Hard money
10% down · 12.0% · 12mo
- Down + closing
- —
- Monthly P&I
- —
- Monthly cashflow
- —
- DSCR
- —
- Eligible?
- —
Short-term bridge; refi at stabilization.
Rent comps 40 comps
| Address | Beds | Baths | Sqft | Rent | $/sqft | DOM | Units | Dist |
|---|---|---|---|---|---|---|---|---|
| 6410 Emerald Dunes Dr #205 West Palm Beach, FL | 2.0 | 2.0 | 1058 | $2,100 | $1.98 | 24d | 1 | 0.44mi |
| 6450 Emerald Dunes Dr #103 West Palm Beach, FL | 3.0 | 2.0 | 1493 | $2,895 | $1.94 | 4d | 1 | 0.47mi |
| 6245 Saxon Blvd West Palm Beach, FL | 4.0 | 3.0 | 1350 | $3,500 | $2.59 | 11d | 1 | 0.49mi |
| 6482 Emerald Dunes Dr Unit 112 Royal Palm Beach, FL | 3.0 | 2.0 | 1493 | $2,300 | $1.54 | 24d | 1 | 0.52mi |
| 6482 Emerald Dunes Dr #301 West Palm Beach, FL | 2.0 | 2.0 | 1058 | $2,100 | $1.98 | 7d | 1 | 0.52mi |
| 6510 Emerald Dunes Dr #308 West Palm Beach, FL | 2.0 | 2.0 | 1262 | $2,350 | $1.86 | 4d | 1 | 0.52mi |
| 6510 Emerald Dunes Dr #308 West Palm Beach, FL | 2.0 | 2.0 | 1262 | $2,350 | $1.86 | 17d | 1 | 0.52mi |
| 6510 Emerald Dunes Dr West Palm Beach, FL | 2.0 | 2.0 | 1262 | $2,225 | $1.76 | 18d | 2 | 0.53mi |
| 6418 Emerald Dunes Dr #305 West Palm Beach, FL | 2.0 | 2.0 | 1262 | $2,250 | $1.78 | 24d | 1 | 0.54mi |
| 145 Windsor G West Palm Beach, FL | 2.0 | 2.0 | 819 | $1,800 | $2.20 | 24d | 1 | 0.54mi |
| 1639 Barbarie Ln West Palm Beach, FL | 3.0 | 1.0 | 1100 | $2,400 | $2.18 | 24d | 1 | 0.54mi |
| 6386 Emerald Dunes Dr #201 West Palm Beach, FL | 3.0 | 2.0 | 1381 | $2,650 | $1.92 | 24d | 1 | 0.57mi |
| 6386 Emerald Dunes Dr West Palm Beach, FL | 1.0–3.0 | 1.0–2.0 | 1060 | $2,650 | $2.50 | 15d | 2 | 0.57mi |
| 6386 Emerald Dunes Dr West Palm Beach, FL | 1.0–3.0 | 1.0–2.0 | 1060 | $2,650 | $2.50 | 3d | 2 | 0.57mi |
| 6505 Emerald Dunes Dr Unit 315 West Palm Beach, FL | 2.0 | 2.0 | 1226 | $2,000 | $1.63 | 24d | 1 | 0.58mi |
| 6529 Emerald Dunes Dr Unit 319 Royal Palm Beach, FL | 2.0 | 2.0 | 1058 | $2,000 | $1.89 | 24d | 1 | 0.60mi |
| 6559 Emerald Dunes Dr Royal Palm Beach, FL | 1.0–3.0 | 1.0–2.0 | 1060 | $2,500 | $2.36 | 24d | 2 | 0.65mi |
| 6533 Emerald Dunes Dr West Palm Beach, FL | 2.0 | 2.0 | 1058 | $2,200 | $2.08 | 3d | 2 | 0.67mi |
| 1883 Breezy Ln West Palm Beach, FL | 2.0 | 2.0 | 856 | $2,500 | $2.92 | 24d | 1 | 0.70mi |
| 6349 Topsail Dr West Palm Beach, FL | 3.0 | 2.5 | 1498 | $2,500 | $1.67 | 20d | 1 | 0.76mi |
| 306 Wellington B West Palm Beach, FL | 2.0 | 2.0 | 1062 | $1,800 | $1.69 | 20d | 1 | 0.78mi |
| 105 E Wellington Dr #105 West Palm Beach, FL | 2.0 | 2.0 | 1062 | $1,850 | $1.74 | 24d | 1 | 0.81mi |
| 900 Seabright Ave West Palm Beach, FL | 3.0 | 2.5 | 1485 | $2,725 | $1.84 | 24d | 1 | 0.83mi |
| 330 Andover M Unit M West Palm Beach, FL | 2.0 | 1.5 | 798 | $1,600 | $2.01 | 17d | 1 | 0.87mi |
| 115 Camden E West Palm Beach, FL | 2.0 | 1.5 | 798 | $1,600 | $2.01 | 24d | 1 | 0.89mi |
| 222 Somerset L West Palm Beach, FL | 2.0 | 2.0 | 874 | $1,850 | $2.12 | 2d | 1 | 0.89mi |
| 938 Sarazen Dr West Palm Beach, FL | 3.0 | 2.0 | 1104 | $2,900 | $2.63 | 24d | 1 | 0.95mi |
| 163 Somerset H West Palm Beach, FL | 2.0 | 2.0 | 874 | $1,500 | $1.72 | 24d | 1 | 0.98mi |
| 145 Northampton H Unit H West Palm Beach, FL | 2.0 | 1.5 | 798 | $1,800 | $2.26 | 7d | 1 | 0.98mi |
| 146 Somerset Cres Unit 146 West Palm Beach, FL | 2.0 | 2.0 | 874 | $2,000 | $2.29 | 20d | 1 | 0.98mi |
| 2905 Hidden Hills Rd #2203 West Palm Beach, FL | 2.0 | 2.5 | 1086 | $2,100 | $1.93 | 24d | 1 | 1.07mi |
| 245 Northampton M West Palm Beach, FL | 2.0 | 1.5 | 798 | $1,700 | $2.13 | 5d | 1 | 1.07mi |
| 2912 Hidden Hills Rd #1205 West Palm Beach, FL | 3.0 | 3.0 | 1423 | $2,400 | $1.69 | 24d | 1 | 1.08mi |
| 2904 Hidden Hills Rd Unit 904 West Palm Beach, FL | 3.0 | 2.5 | 1379 | $2,200 | $1.60 | 24d | 1 | 1.09mi |
| 2944 Hidden Hills Rd #1604 West Palm Beach, FL | 3.0 | 3.0 | 1450 | $2,390 | $1.65 | 24d | 1 | 1.13mi |
| 6549 Diamond Springs Ter #2004 West Palm Beach, FL | 3.0 | 2.5 | 1362 | $2,300 | $1.69 | 3d | 1 | 1.13mi |
| 6516 Morgan Hill Trl #1809 West Palm Beach, FL | 2.0 | 2.5 | 1086 | $2,050 | $1.89 | 3d | 1 | 1.15mi |
| 759 Caroline Ave West Palm Beach, FL | 4.0 | 2.0 | 1337 | $3,000 | $2.24 | 24d | 1 | 1.17mi |
| 7130 Okeechobee Blvd West Palm Beach, FL | 1.0–3.0 | 1.0–2.0 | 1086 | $2,863 | $2.64 | 3d | 9 | 1.22mi |
| 179 Canterbury H West Palm Beach, FL | 2.0 | 1.5 | 798 | $1,200 | $1.50 | 1d | 1 | 1.26mi |
Listing history 19 events
-
2026-06-18days on market $100,000 Active 37 DOM
-
2026-06-17days on market $100,000 Active 36 DOM
-
2026-06-16days on market $100,000 Active 35 DOM
-
2026-06-15days on market $100,000 Active 34 DOM
-
2026-06-13days on market $100,000 Active 32 DOM
-
2026-06-09days on market $100,000 Active 28 DOM
-
2026-06-07days on market $100,000 Active 26 DOM
-
2026-06-04days on market $100,000 Active 23 DOM
-
2026-06-03days on market $100,000 Active 22 DOM
-
2026-06-01days on market $100,000 Active 20 DOM
-
2026-05-31days on market $100,000 Active 19 DOM
-
2026-05-12$100,000 Active
-
2026-02-09status Active
-
2026-02-03status Pending
-
2026-02-03historical
-
2026-01-14price $122,000
-
2025-10-15$129,000 Active
-
2009-05-07historical
-
2008-07-01$16,900
ⓘ Source: listings_history table (triggers on properties + properties_extension) + one-shot
backfill from property_details.listing_events for pre-trigger history.
Climate risk First Street
- Flood 1/10 Low FEMA zone X (unshaded) · 0% chance over 30 yrs
- Wildfire 2/10 Low
- Heat 10/10 Extreme 7 d/yr ≥105°F today · 25 d/yr by 30 yrs out
- Wind 10/10 Extreme 99% chance of damaging wind over 30 yrs
- Air quality 2/10 Low 1 unhealthy d/yr today · 1 by 30 yrs out
Nearby sold comps map
Loading sold comps map…
Walkable amenities ~0.75 mi
Loading nearby amenities…
Taxation est. · year 1
- Rental income
- $28,022
- − Mortgage interest
- −$5,602
- − Property taxes
- −$1,500
- − Insurance
- −$500
- − Repairs & maintenance
- −$2,242
- − Management
- −$2,242
- − Depreciation
- −$2,909
- Taxable income
- $13,028
- Est. tax owed @ 24.0%
- −$3,127
- After-tax cash flow
- $10,718/yr
For passive investors: Depreciation is non-cash, so a rental often shows a tax loss while cash-flowing — sheltering income. Rental losses are passive: they offset passive income freely, and up to $25,000/yr can offset ordinary (W-2) income if you actively participate and your MAGI is under $100k (phasing out to $0 by $150k); unused losses carry forward. On sale, claimed depreciation is recaptured at up to 25%, and gains may owe capital-gains tax (a 1031 exchange can defer both). Figures are a year-1 estimate at your 24.0% rate — not tax advice; consult a CPA.
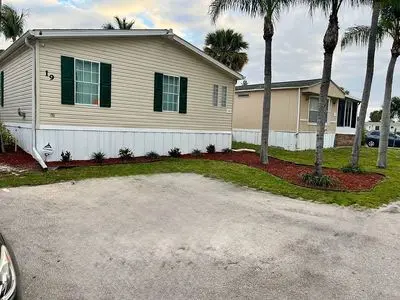
Condition & rehab AI · 1 photo
This well-maintained mobile home in a professionally managed community offers a good investment opportunity with minimal repairs needed.
Value-add opportunities
- Both Paint exterior siding — Enhances curb appeal and adds value
- Both Clean and maintain landscaping — Improves curb appeal and adds value
- Both Inspect and clean gutters — Prevents water damage and improves property value
Renovation cost estimate screening
Value-add ROI direction
- Both Paint exterior siding — Enhances curb appeal and adds value ↑
- Both Clean and maintain landscaping — Improves curb appeal and adds value ↑
- Both Inspect and clean gutters — Prevents water damage and improves property value ↑
ⓘ Cost ranges are severity-bucket heuristics (US national rule-of-thumb). Get contractor quotes + a written scope before underwriting a rehab budget.
Schools (NCES district)
- District
- Palm Beach
- NCES district ID
- 1201500
- Math proficiency
- 46% ▼ -16.00%
- Reading proficiency
- 53% ▼ -4.00%
- Median HH income
- $53,943
- Composite
- 42.72/100
- National rank
- #3160
- State rank
- #34 of 73 in FL
Livability — Plantation Mobile Home Park
- Score
- 70/100
- State rank
- #430
- US rank
- #7700
Category grades
Schools grade is shown separately in the Schools card above.
Census & demographics
- County
- Palm Beach County · 1,438,312 people
- Metro
- Miami-Fort Lauderdale-Pompano Beach, FL
- Population (ZIP)
- 38,079
- Household income
- $51,605
- Rent vs Own
- Severe rent burden
- 2548.0
Population outlook (Palm Beach County) Hauer SSP2
- Today (2025)
- 1,637,487 people
- By 2030
- 1,743,255 · +6.5%
- By 2040
- 1,948,712 · +19.0%
- By 2050
- 2,132,979 · +30.3%
- By 2075
- 2,530,027 · +54.5%
- By 2100
- 2,706,979 · +65.3%
Race, ethnicity, and origin ACS 2023
- Neighborhood character
- Highly diverse neighborhood (Simpson 0.72)
- Race & ethnicity
- White 34% Black 30% Hispanic / Latino 27% Two or more races 16% Asian 3%
- Hispanic origin (detail)
- Mexican 3% Puerto Rican 6% Cuban 5% Dominican 2%
- Common ancestry
- Hispanic 10% Romanian 3% Scotch-Irish 1%
- Foreign-born
- 34% · Canada, Jamaica
- Languages at home
- 58% English-only · Spanish 24% French/Haitian/Cajun 11% Other Indo-European 3%
Political lean MEDSL · Palm Beach
- 2024 margin
- Toss-up / Even · D 50.0% · R 49.2%
- 2008→2024 swing
- -22.1pp toward R · 2008: 22.9pp · 2024: 0.8pp
- All cycles
- 2024: D+0.8 2020: D+12.8 2016: D+15.3 2012: D+17.0 2008: D+22.9
Not yet ingested
- Civics
- —
Market trends
- HPI YoY
- ▼ -138.62%
- Current HPI
- 335.8396
- Rent YoY
- ▬ 0.02%
- Metro
- Miami-Fort Lauderdale-Pompano Beach, FL
- State GDP YoY
- ▲ 3.28%
- F500 in state
- 36
Industry mix (Fortune 500 HQ in FL)
| Industry | F500 HQs | Revenue |
|---|---|---|
| Industrial Technology | 2 | $29B |
|
||
| Insurance | 2 | $17B |
|
||
| Retail | 1 | $60B |
|
||
| Technology Distribution | 1 | $58B |
|
||
| Homebuilding | 1 | $35B |
|
||
| Technology Manufacturing | 1 | $35B |
|
||
Price history
+491.7% since first listed8 events — show timeline
- 2026-05-12 Listed $100,000 FSBO.com
- 2026-02-09 Relisted — Beaches MLS
- 2026-02-03 Pending — Beaches MLS
- 2026-02-03 Listing Removed — Beaches MLS
- 2026-01-14 Price Changed $122,000 Beaches MLS
- 2025-10-15 Listed $129,000 Beaches MLS
- 2009-05-07 Listing Removed — Beaches MLS
- 2008-07-01 Listed $16,900 Beaches MLS
Cash-flow waterfall
monthlySold comps — $/sqft
last 12 mo · ≤1 miLoading sold comps…