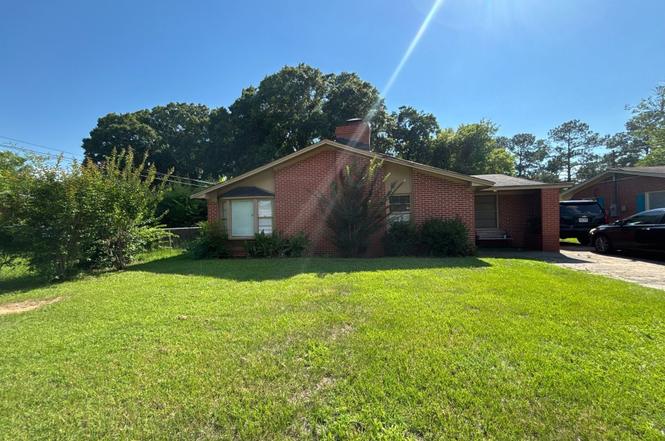
4064 Berwick Dr · Montgomery, AL
Flood risk 4/10 · Minor
- FEMA flood zone
- AE
- Chance of flooding over 30 yrs
- 0.22%
- Est. flood insurance / yr
- $1,737 – $8,500
Fire risk 3/10 · Minor
- Est. fire insurance / yr
- $916 – $1,700
Heat risk 8/10 · Major
- Hot days now (above 108°F)
- 7 days/yr
- Hot days in 30 yrs
- 20 days/yr
Wind risk 8/10 · Major
- Chance of severe wind over 30 yrs
- 80.0%
Air-quality risk 2/10 · Minimal
- Unhealthy air days now
- 1 days/yr
- Unhealthy air days in 30 yrs
- 1 days/yr
Risk factors via First Street. Map © Google.
Why this score? — see what drove the B grade
The composite is a weighted blend of 9 inputs, each scored 0–100. Each bar is that input's sub-score; the figure is the points it added to the 100-point composite (weight × sub-score).
- Cash flow +30.0/30.0
- ARV discount +15.0/15.0
- 1% rule +10.0/10.0
- DSCR +10.0/10.0
- Livability +3.2/5.0
- Rent growth +2.5/5.0
- Condition / age +2.5/5.0
- Schools +1.7/10.0
- Appreciation +0.0/10.0
$90,000
🖨 Deal sheet 📄 Offer letter ✓ Due diligence
Listing remarks MLS
Check out this bright and spacious 3BR/2.5BA home with 1,841+/- sq ft and covered patio. This home features a living room with wood floors, large den, eat-in kitchen, laundry room, cozy master suite w/ fireplace and nice backyard. Great location, call today for a tour. . Property is Owned by the US Dept. of HUD, case #011-769854. Subject to appraisal-(UI) Uninsured. Property was built prior to 1978. Seller makes no representations or warranties as to property condition. HUD Homes are Sold “As-Is. ” "EQUAL HOUSING OPPORTUNITY. " Seller may contribute up to 3% for buyer’s closing costs, upon buyer request. If schools are important, buyer to verify. All information and property details are deemed reliable but not guaranteed and should be independently verified if any person intends to engage in a transaction based upon.
Key facts
- Brick exterior
- Updated hvac system
- In-unit laundry
Tags
Property features AI
Exterior
- Parking: Driveway
- Utilities: Public water; Public sewer; Cable available
- Home design: Single-story; Brick construction; Slab foundation; Built by owner (year source: owner)
- Construction: Brick exterior
- Exterior features: Covered patio; Patio; Privacy fence; Storage
Interior
- Flooring: Tile; Wood
- Bathrooms: 2 full bathrooms; 1 half bathroom
- Heating & cooling: Heat pump heating; Central air conditioning; Ceiling fans; Gas heating option
- Interior features: Tile and wood flooring; Fireplace (1)
- Laundry & utility: Water heater
Neighborhood map
What this means for you Summary
Snapshot
- This is a 3-bed/3.0-bath single-family listed at $90k.
Deal economics
- At list price, monthly cash flow is $95 ($1k/yr) — positive.
- The deal already cash-flows at list — no discount required.
- Meets the 1% rule at list price ($1k rent vs $90k).
- Cap rate 13.2% vs local median 6.0% in Montgomery — top-decile yield for the area; either an underpriced asset or a hidden risk that comps aren't pricing in. Stress-test before assuming the spread holds.
Location & tenants
- Location reads 65/100 on livability (#138 in AL) — a middle-class / working-renter tenant base. Strengths: cost of living A+, housing A+; Watch: schools C-, employment D, crime F.
- Montgomery County (urban): math 9% / reading 31% proficiency, ranked #106 of 129 in AL (top 82%) — low school quality limits family demand, transient renter base, plan for 1-2y turnover; 70% free/reduced lunch — lower-income household profile, screen leases tightly.
- Market conditions: 79 active listings in the ZIP; 7 comparable units currently listed for rent nearby; rentals lingering (median 44d on market — plan ~5-8 weeks vacancy on turnover, expect pricing pressure); 71% of comp listings sitting > 30 days — soft ceiling on asking rent; lower-income renter base — watch delinquency; 460 units permitted in Montgomery County in 2024 (37 in 5+ unit buildings).
- This rent runs 39% of the median local income ($41k/yr) — at the standard rent-burdened threshold; future hikes will face affordability resistance.
Forward outlook
- Local home prices are declining (-3.0%/yr); year-one equity from $622 of loan paydown is wiped out by about $3k of value loss. Plan a longer hold.
- Montgomery County population projected to shrink 8% by 2050 — rents likely to lag national; underwrite the cash flow, not the appreciation.
Negotiation context
- Only 2 days on market — expect competitive offers; lowballing is unlikely to land.
- 3 sale attempts since 28y ago with the ask held roughly flat each time — persistent listings suggest the price (not the market) is what's stuck; bring a comps-based counter.
- Current owner paid $34k; list at $90k implies a 165% gain — meaningful room to come down on a strong offer.
Risks & watch-outs
- Watch-outs: flood insurance adds $427/mo.
- Climate carrying-cost: in FEMA flood zone AE (mandatory federal flood insurance); severe wind risk, 80% chance of damaging wind over 30y; extreme-heat days projected 7→20/yr by 2055 (HVAC capex compounding) — expect insurance premiums to compound above CPI over the hold.
Questions for the listing agent
- Built in 1964 — when were the roof, HVAC, electrical panel, plumbing, and water heater last replaced?
- What's the actual annual flood-insurance premium (NFIP or private), and is the property in a SFHA with mandatory coverage?
- Is there a deadline driving the sale (1031 exchange, divorce, estate, relocation)? That informs how much negotiation room exists.
- Crime grade is F in this area — have there been break-ins, vandalism, or insurance claims at this property in the last 3 years? What carrier currently insures it and at what premium?
- What's the average days-on-market for RENTAL listings here right now (not sales)? A rising rental-DOM trend means longer vacancies and softer asking-rent achievability than the comps imply.
- What's the recent tenant-quality profile in this submarket — average credit score on applications, eviction rate, late-payment / NSF rate, and stable-employment percentage? A property-management company in the area should have these aggregated.
- How much new for-sale + rental construction is in the pipeline within 1–3 miles? Heavy new supply typically softens prices + rents 12–24 months out; constrained supply supports both.
Investment metrics
- 1% rule
- 1.50% ✓
- Cap rate
- 13.25%
- Cash-on-cash
- 24.84%
- DSCR
- 2.11
- GRM
- 5.6
CMA / ARV
- ARV (on-the-fly)
- $125,188
- Comps found
- 2
Show comp detail 2 sales within ~0.75 mi
| Address | Dist | Beds/Ba | Sqft | Sold | Price | $/sf | Match |
|---|---|---|---|---|---|---|---|
| 3920 Oak St | 0.27mi | 3/2.0 | 1,625 (-12%) | 4mo | $110,000 | $68 | 60 |
| 4510 Rosa Parks Ave | 0.51mi | 4/1.0 (+1) | 1,772 (-4%) | 16mo | $73,435 | $41 | 43 |
Match score weights: distance 35% · size 25% · config 20% · recency 20%. Top-matched comps best support the ARV.
Projected returns pro-forma
-3.0% appreciation · 3.0% rent growth · sell at horizon
- IRR
- -8.9%
- Equity multiple
- 0.67×
- Total profit
- $-8,287
- Equity at exit
- $13,419
- IRR
- 0.9%
- Equity multiple
- 1.06×
- Total profit
- $1,544
- Equity at exit
- $7,782
Cash invested: $25,200 (down + closing). Projections, not guarantees.
Landlord ↔ Tenant lean methodology
- Overall (STATE)
- 90 Strongly Landlord-Friendly
- State Alabama
- 90 Strongly Landlord-Friendly · R+15
- County
- — inherits STATE
- City
- — inherits STATE
ZIP-level market 36105
- Home prices YoY
- -32.6%
- Active inventory
- 79
- Price-to-rent
- 5.6×
Monthly cashflow live
- Estimated rent
- $1,349 high interval (Pro) →
- Mortgage (P&I)
- −$472
- Tax from tax record
- −$34 /mo · $412/yr
- Insurance
- −$38
- Flood insurance flood zone
- −$427 /mo · $5,118/yr
- HOA
- −$0
- Vacancy / Maint / Mgmt
- −$283
- Net cashflow
- $95
Break-even live
UW: 25.0% down · 7.5% · 30yr · 1.5% tax · 5.0% vac · 8.0% maint · 8.0% mgmt
Financing live
Cash to close
- Down payment
- $22,500
- Closing costs
- $2,700
- Reserves months
- —
- Total cash needed
- —
Loan-product check · same deal, 3 products live
Conventional
25% down · 7.5% · 30yr
- Down + closing
- —
- Monthly P&I
- —
- Monthly cashflow
- —
- DSCR
- —
- Eligible?
- —
Personal DTI + credit; lowest rate.
DSCR
20% down · 8.5% · 30yr
- Down + closing
- —
- Monthly P&I
- —
- Monthly cashflow
- —
- DSCR
- —
- Eligible?
- —
No personal income docs; deal must DSCR.
Hard money
10% down · 12.0% · 12mo
- Down + closing
- —
- Monthly P&I
- —
- Monthly cashflow
- —
- DSCR
- —
- Eligible?
- —
Short-term bridge; refi at stabilization.
Rent comps 7 comps
| Address | Beds | Baths | Sqft | Rent | $/sqft | DOM | Units | Dist |
|---|---|---|---|---|---|---|---|---|
| 4037 Oak St Montgomery, AL | 3.0 | 2.0 | 1314 | $1,450 | $1.10 | 43d | 1 | 0.17mi |
| 3616 Gaston Ave Montgomery, AL | 4.0 | 2.0 | 1629 | $1,300 | $0.80 | 43d | 1 | 0.69mi |
| 3577 Whiting Ave Montgomery, AL | 3.0 | 1.0 | 1269 | $1,150 | $0.91 | 43d | 1 | 0.71mi |
| 2655 W Edgemont Ave Montgomery, AL | 2.0 | 2.0 | 1743 | $875 | $0.50 | 43d | 1 | 1.13mi |
| 3544 Southmont Dr Montgomery, AL | 4.0 | 1.5 | 1774 | $1,300 | $0.73 | 20d | 1 | 1.18mi |
| 3225 McElvy St Montgomery, AL | 3.0 | 2.0 | 1258 | $1,350 | $1.07 | 13d | 1 | 1.33mi |
| 548 Winston Dr Montgomery, AL | 2.0 | 2.5 | 1396 | $1,000 | $0.72 | 43d | 1 | 1.45mi |
Listing history 3 events
-
2026-06-18days on market $90,000 Active 2 DOM
-
2026-06-16remarks 699-char remark
-
2026-06-16$90,000 Active 1 DOM
ⓘ Source: listings_history table (triggers on properties + properties_extension) + one-shot
backfill from property_details.listing_events for pre-trigger history.
Tax reassessment forecast AL · Resets to sale price
- Current annual tax
- $412 · $34/mo
- Projected year-2 tax
- $412 · $34/mo
- Expected delta
- $0/yr ($0/mo · 0.0%)
ⓘ Screening estimate from a state-policy table — verify with the county assessor before closing.
Climate risk First Street
- Flood 4/10 Moderate FEMA zone AE · 22% chance over 30 yrs
- Wildfire 3/10 Moderate
- Heat 8/10 Severe 7 d/yr ≥108°F today · 20 d/yr by 30 yrs out
- Wind 8/10 Severe 80% chance of damaging wind over 30 yrs
- Air quality 2/10 Low 1 unhealthy d/yr today · 1 by 30 yrs out
Nearby sold comps map
Loading sold comps map…
Walkable amenities ~0.75 mi
Loading nearby amenities…
Taxation est. · year 1
- Rental income
- $16,185
- − Mortgage interest
- −$5,041
- − Property taxes
- −$412
- − Insurance
- −$5,568
- − Repairs & maintenance
- −$1,295
- − Management
- −$1,295
- − Depreciation
- −$2,618
- Taxable loss
- −$44
- Est. tax savings @ 24.0%
- +$11
- After-tax cash flow
- $1,153/yr
For passive investors: Depreciation is non-cash, so a rental often shows a tax loss while cash-flowing — sheltering income. Rental losses are passive: they offset passive income freely, and up to $25,000/yr can offset ordinary (W-2) income if you actively participate and your MAGI is under $100k (phasing out to $0 by $150k); unused losses carry forward. On sale, claimed depreciation is recaptured at up to 25%, and gains may owe capital-gains tax (a 1031 exchange can defer both). Figures are a year-1 estimate at your 24.0% rate — not tax advice; consult a CPA.
Schools (NCES district)
- District
- Montgomery County
- NCES district ID
- 0102430
- Math proficiency
- 9% ▼ -21.00%
- Reading proficiency
- 31% ▼ -1.00%
- Median HH income
- $43,902
- Composite
- 17.24/100
- National rank
- #9093
- State rank
- #106 of 129 in AL
Livability — Montgomery
- Score
- 65/100
- State rank
- #138
- US rank
- #13416
Category grades
Schools grade is shown separately in the Schools card above.
Census & demographics
- Census place
- Montgomery, AL
- County
- Montgomery County · 190,016 people
- City population
- 175,913
- Metro
- Montgomery, AL
- Population (ZIP)
- 9,207
- Household income
- $41,486
- Rent vs Own
- Severe rent burden
- 679.0
Population outlook (Montgomery County) Hauer SSP2
- Today (2025)
- 224,008 people
- By 2030
- 221,460 · -1.1%
- By 2040
- 214,179 · -4.4%
- By 2050
- 204,912 · -8.5%
- By 2075
- 177,821 · -20.6%
- By 2100
- 145,134 · -35.2%
Race, ethnicity, and origin ACS 2023
- Neighborhood character
- Predominantly Black (83%)
- Race & ethnicity
- Black 83% White 12% Hispanic / Latino 4% Two or more races 3%
- Common ancestry
- Italian 1%
- Foreign-born
- 3% · Canada, South Korea
- Languages at home
- 95% English-only · Spanish 4%
Political lean MEDSL · Montgomery
- 2024 margin
- Solid D (+30.7) · D 64.8% · R 34.1% · Other 1.1%
- 2008→2024 swing
- +11.5pp toward D · 2008: 19.2pp · 2024: 30.7pp
- All cycles
- 2024: D+30.7 2020: D+31.5 2016: D+26.2 2012: D+24.3 2008: D+19.2
Not yet ingested
- Civics
- —
Market trends
- HPI YoY
- ▼ -31.17%
- Current HPI
- 64.4673
- Rent YoY
- —
- Metro
- Montgomery, AL
- State GDP YoY
- ▲ 2.94%
- F500 in state
- 4
Industry mix (Fortune 500 HQ in AL)
| Industry | F500 HQs | Revenue |
|---|---|---|
| Financial Services | 1 | $8B |
|
||
| Healthcare | 1 | $5B |
|
||
Price history
+38.7% since first listed5 events — show timeline
- 2026-06-16 Listed $90,000 MAAR
- 2020-04-29 Sold (MLS) $34,000 MAAR
- 2020-03-20 Listed $38,000 MAAR
- 1998-10-23 Sold (MLS) $64,900 MAAR
- 1998-08-11 Listed $64,900 MAAR
Property tax history
+6.0%/yrLatest (2025): $412 · +7.6% YoY. Source: county tax records.
Cash-flow waterfall
monthlySold comps — $/sqft
last 12 mo · ≤1 miLoading sold comps…