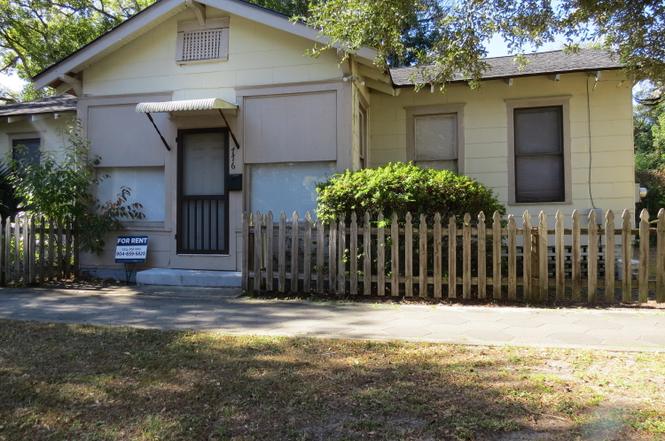
 Triplex
2501 Myra St · Jacksonville, FL
Flood risk 1/10 · Minimal
- FEMA flood zone
- X (unshaded)
- Chance of flooding over 30 yrs
- 0.0%
- Est. flood insurance / yr
- $507 – $1,088
Fire risk 1/10 · Minimal
- Est. fire insurance / yr
- $947 – $1,759
Heat risk 9/10 · Severe
- Hot days now (above 107°F)
- 7 days/yr
- Hot days in 30 yrs
- 21 days/yr
Wind risk 9/10 · Severe
- Chance of severe wind over 30 yrs
- 99.0%
Air-quality risk 5/10 · Moderate
- Unhealthy air days now
- 7 days/yr
- Unhealthy air days in 30 yrs
- 7 days/yr
Risk factors via First Street. Map © Google.
Why this score? — see what drove the B+ grade
The composite is a weighted blend of 9 inputs, each scored 0–100. Each bar is that input's sub-score; the figure is the points it added to the 100-point composite (weight × sub-score).
- Cash flow +30.0/30.0
- ARV discount +15.0/15.0
- 1% rule +10.0/10.0
- DSCR +10.0/10.0
- Livability +4.2/5.0
- Schools +3.9/10.0
- Rent growth +3.7/5.0
- Condition / age +2.5/5.0
- Appreciation +0.0/10.0
$280,000
🖨 Deal sheet 📄 Offer letter ✓ Due diligence
Multi-family units
County records classify this as Multi-Family (5+ Unit). Listing-text estimate: 3 units. estimate disagrees with records
5+ unit building — per-unit beds/baths from public records are typically unavailable; the breakdown below (if shown) is an estimate from the listing text.
Listing remarks MLS
Here's a chance to add a great investment property to your portfolio. Great location in Riverside. Just a short walk to shops and restaurants. This 3-unit property consists of a duplex with two 1/1 and an additional 1/1 garage apartment. Great return with upside potential. Units rent quickly. 100% occupied.
Key facts
- Garage studio
- Ready for renovation
- 7,405 sq ft lot
Tags
Property features AI
Finance
- Financial info: Annual taxes listed (2025)
Exterior
- Parking: Off-street parking; On-street parking
- Utilities: Cable available; Electricity available; Water available
- Home design: Triplex
- Exterior features: Located in a historic area; 0.17-acre lot
Interior
- Bedrooms: 3 bedrooms
- Bathrooms: 3 full bathrooms
- Heating & cooling: Heating provided (type listed as Other); Wall/window air conditioning units
- Interior features: Investment property use; Historic area lot
Neighborhood map
What this means for you Summary
Snapshot
- This is a 3 × 3-bed/3.0-bath units multifamily listed at $280k.
Deal economics
- At list price, monthly cash flow is $1k ($15k/yr) — positive. Per door: $425/mo.
- The deal already cash-flows at list — no discount required.
- Meets the 1% rule at list price ($4k rent vs $280k).
- Recommended offer: $246k (12.0% below list) — sets the bar for market timing.
- Cap rate 11.8% vs local median 4.0% in Jacksonville — top-decile yield for the area; either an underpriced asset or a hidden risk that comps aren't pricing in. Stress-test before assuming the spread holds.
Location & tenants
- Location reads 83/100 on livability (#50 in FL, #911 nationally) — a professional / high-income tenant draw. Strengths: amenities A+, commute A+, housing A+.
- Duval (urban): math 46% / reading 45% proficiency, ranked #48 of 73 in FL (top 66%) — families likely to look elsewhere, expect single-tenant / working-renter base with shorter leases.
- Market conditions: Rents rising fast (+4.7%/yr); 75 active listings in the ZIP; 40 comparable units currently listed for rent nearby; rentals at typical pace (median 15d on market — plan ~3-4 weeks tenant-placement turnaround); 6,503 units permitted in Duval County in 2024 (1,131 in 5+ unit buildings).
- At $4,248/mo this rent would consume 78% of the median local household income ($65k/yr) (locally 866% of renters already pay >50% of income on rent) — very limited rent-growth headroom before tenants either downsize or default.
Forward outlook
- Local home prices are declining (-3.0%/yr); year-one equity from $2k of loan paydown is wiped out by about $8k of value loss. Plan a longer hold.
- Duval County population projected at +19% by 2050 — long-run rental-demand tailwind backs the buy-and-hold thesis.
- At projected returns (-3.0% appreciation + 4.7% rent growth), your $78k cash investment doubles in ~6 years — after that, you're playing with house money.
Negotiation context
- It's been on market 178 days — a 12% lower offer ($246k) is reasonable based on typical stale-listing flexibility.
- 3 sale attempts since 6y ago; this cycle's ask has dropped $70k (20%) from the opening price — seller is motivated, your offer sets the floor, not the list.
- Current owner paid $205k; 37% above their basis — modest negotiation headroom, anchor on the comps not their cost.
Risks & watch-outs
- Watch-outs: built in 1921 — expect roof / HVAC / electrical / plumbing capex.
- Climate carrying-cost: severe wind risk, 99% chance of damaging wind over 30y; extreme-heat days projected 7→21/yr by 2055 (HVAC capex compounding) — expect insurance premiums to compound above CPI over the hold.
Questions for the listing agent
- It's been on market 178 days. Have you received any prior offers? Is the seller open to a 12% concession, seller financing, or rate buy-down credit?
- Can we see the unit-by-unit rent roll, current vacancy, and any below-market leases? What's the average tenancy length?
- What capital expenditures (roof, boiler, parking lot, exteriors) have been made in the last 5 years, and what's planned in the next 2?
- Built in 1921 — when were the roof, HVAC, electrical panel, plumbing, and water heater last replaced?
- Why hasn't it sold? Are there any deal-killer items the seller is aware of (foundation, flood, title, zoning, code violations)?
- Is there a deadline driving the sale (1031 exchange, divorce, estate, relocation)? That informs how much negotiation room exists.
- Schools are B-rated — typically a magnet for longer-tenancy family renters. What's the average tenant stay here, and is there a school-zone premium baked into asking?
- What's the average days-on-market for RENTAL listings here right now (not sales)? A rising rental-DOM trend means longer vacancies and softer asking-rent achievability than the comps imply.
- What's the recent tenant-quality profile in this submarket — average credit score on applications, eviction rate, late-payment / NSF rate, and stable-employment percentage? A property-management company in the area should have these aggregated.
- How much new apartment / multifamily construction is in the pipeline within 1–3 miles? Heavy new supply (>2% of stock underway) typically softens rents 12–24 months out; light construction supports rent growth.
Investment metrics
- 1% rule
- 1.52% ✓
- Cap rate
- 11.76%
- Cash-on-cash
- 19.51%
- DSCR
- 1.87
- GRM
- 5.5
CMA / ARV
- ARV (on-the-fly)
- $386,325
- Comps found
- 1
Show comp detail 1 sale within ~0.75 mi
| Address | Dist | Beds/Ba | Sqft | Sold | Price | $/sf | Match |
|---|---|---|---|---|---|---|---|
| 1314 Sydney Pl | 0.60mi | 2/2.0 | 1,532 (+1%) | 17mo | $390,000 | $255 | 56 |
Match score weights: distance 35% · size 25% · config 20% · recency 20%. Top-matched comps best support the ARV.
Projected returns pro-forma
-3.0% appreciation · 4.69% rent growth · sell at horizon
- IRR
- 13.5%
- Equity multiple
- 1.55×
- Total profit
- $43,325
- Equity at exit
- $41,749
- IRR
- 23.7%
- Equity multiple
- 3.22×
- Total profit
- $174,106
- Equity at exit
- $24,209
Cash invested: $78,400 (down + closing). Projections, not guarantees.
Landlord ↔ Tenant lean methodology
- Overall (STATE)
- 87 Strongly Landlord-Friendly
- State Florida
- 87 Strongly Landlord-Friendly · R+3
- County
- — inherits STATE
- City
- — inherits STATE
ZIP-level market 32204
- Home prices YoY
- -28.2%
- Rents YoY
- 4.7%
- Active inventory
- 75
- Price-to-rent
- 16.5×
Monthly cashflow live
- Estimated rent
- $4,248 high interval (Pro) →
- Mortgage (P&I)
- −$1,468
- Tax from tax record
- −$496 /mo · $5,952/yr
- Insurance
- −$117
- HOA
- −$0
- Vacancy / Maint / Mgmt
- −$892
- Net cashflow
- $1,275
Break-even live
3-unit breakdown (identical units grouped — click to expand)
| Units | Beds | Baths | Est. rent |
|---|---|---|---|
| 3× units | 3 | 3 | $4,248 |
| #1 | 3 | 3 | $1,416 |
| #2 | 3 | 3 | $1,416 |
| #3 | 3 | 3 | $1,416 |
| Total (3 units) | $4,248 | ||
UW: 25.0% down · 7.5% · 30yr · 1.5% tax · 5.0% vac · 8.0% maint · 8.0% mgmt
Financing live
Cash to close
- Down payment
- $70,000
- Closing costs
- $8,400
- Reserves months
- —
- Total cash needed
- —
Loan-product check · same deal, 3 products live
Conventional
25% down · 7.5% · 30yr
- Down + closing
- —
- Monthly P&I
- —
- Monthly cashflow
- —
- DSCR
- —
- Eligible?
- —
Personal DTI + credit; lowest rate.
DSCR
20% down · 8.5% · 30yr
- Down + closing
- —
- Monthly P&I
- —
- Monthly cashflow
- —
- DSCR
- —
- Eligible?
- —
No personal income docs; deal must DSCR.
Hard money
10% down · 12.0% · 12mo
- Down + closing
- —
- Monthly P&I
- —
- Monthly cashflow
- —
- DSCR
- —
- Eligible?
- —
Short-term bridge; refi at stabilization.
Rent comps 40 comps
| Address | Beds | Baths | Sqft | Rent | $/sqft | DOM | Units | Dist |
|---|---|---|---|---|---|---|---|---|
| 2309 College St Jacksonville, FL | 2.0 | 1.0 | 1200 | $1,200 | $1.00 | 14d | 1 | 0.13mi |
| 2578 Haldumar Ter Jacksonville, FL | 2.0 | 1.0 | 1114 | $2,195 | $1.97 | 14d | 1 | 0.14mi |
| 2614 Dellwood Ave Jacksonville, FL | 3.0 | 1.0 | 1122 | $2,325 | $2.07 | 4d | 1 | 0.19mi |
| 2561 Rosselle St #1 Jacksonville, FL | 3.0 | 3.0 | 1287 | $1,395 | $1.08 | 23d | 1 | 0.28mi |
| 2657 Post St Apt 2 Jacksonville, FL | 3.0 | 1.0 | 1100 | $1,700 | $1.55 | 3d | 1 | 0.29mi |
| 2526 Phyllis St Jacksonville, FL | 3.0 | 2.0 | 1300 | $1,800 | $1.38 | 23d | 1 | 0.30mi |
| 2589 Park St Unit 2589 Jacksonville, FL | 2.0 | 1.0 | 1354 | $1,850 | $1.37 | 23d | 1 | 0.30mi |
| 2701 Myra St Jacksonville, FL | 3.0 | 1.0 | 1065 | $1,595 | $1.50 | 21d | 1 | 0.36mi |
| 2044 Dellwood Ave Jacksonville, FL | 2.0 | 1.0 | 1375 | $1,825 | $1.33 | 23d | 1 | 0.39mi |
| 717 King St Jacksonville, FL | 3.0 | 2.0 | 1132 | $1,800 | $1.59 | 17d | 1 | 0.42mi |
| 2759 Dellwood Ave Jacksonville, FL | 3.0 | 2.0 | 1080 | $2,100 | $1.94 | 20d | 1 | 0.49mi |
| 2777 Post St Jacksonville, FL | 2.0 | 1.0 | 1200 | $1,195 | $1.00 | 23d | 1 | 0.50mi |
| 2803 College St Jacksonville, FL | 2.0 | 1.0 | 1100 | $1,550 | $1.41 | 14d | 1 | 0.52mi |
| 2812 Ernest St Jacksonville, FL | 3.0 | 1.0 | 1461 | $2,800 | $1.92 | 23d | 1 | 0.65mi |
| 2054 Riverside Ave Jacksonville, FL | 1.0–2.0 | 1.0–2.0 | 950 | $2,418 | $2.54 | 3d | 14 | 0.66mi |
| 2842 Sydney St Unit 4 Jacksonville, FL | 2.0 | 1.0 | 1200 | $1,300 | $1.08 | 23d | 1 | 0.68mi |
| 1060 Cherry St Jacksonville, FL | 2.0 | 1.0 | 1356 | $1,623 | $1.20 | 21d | 1 | 0.71mi |
| 371 Smith St Jacksonville, FL | 3.0 | 2.0 | 1050 | $1,325 | $1.26 | 4d | 1 | 0.71mi |
| 1846 Margaret St Unit 7A Jacksonville, FL | 2.0 | 1.5 | 1313 | $3,000 | $2.28 | 23d | 1 | 0.71mi |
| 1329 Cherry St Jacksonville, FL | 3.0 | 1.0 | 1408 | $1,595 | $1.13 | 14d | 1 | 0.72mi |
| 344 Smith St Jacksonville, FL | 1.0 | 1.0 | 1750 | $587 | $0.34 | 7d | 1 | 0.76mi |
| 2798 St Johns Ave Jacksonville, FL | 1.0–2.0 | 1.0–2.0 | 962 | $2,255 | $2.34 | 2d | 16 | 0.78mi |
| 420 Sunshine St Jacksonville, FL | 3.0 | 2.0 | 1050 | $1,350 | $1.29 | 1d | 1 | 0.79mi |
| 2931 Saint Johns Ave #4 Jacksonville, FL | 2.0 | 2.0 | 1100 | $1,650 | $1.50 | 14d | 1 | 0.88mi |
| 1215 Willow Branch Ave Jacksonville, FL | 2.0 | 1.0 | 1570 | $1,600 | $1.02 | 23d | 1 | 0.90mi |
| 2950 St Johns Ave #18 Jacksonville, FL | 2.0 | 2.0 | 1362 | $2,275 | $1.67 | 23d | 1 | 0.97mi |
| 3102 Riverside Ave Unit 4 Jacksonville, FL | 2.0 | 1.0 | 1100 | $1,345 | $1.22 | 23d | 1 | 1.09mi |
| 220 Riverside Ave Jacksonville, FL | 2.0 | 1.0–2.0 | 887 | $1,966 | $2.22 | 1d | 33 | 1.09mi |
| 1273 Lechlade Cir Jacksonville, FL | 3.0 | 2.0 | 1257 | $2,395 | $1.91 | 4d | 1 | 1.13mi |
| 1273 Lechlade Cir Jacksonville, FL | 3.0 | 2.0 | 1257 | $2,395 | $1.91 | 17d | 1 | 1.13mi |
| 200 Riverside Ave Jacksonville, FL | 2.0 | 1.0–2.0 | 808 | $2,501 | $3.09 | 1d | 27 | 1.15mi |
| 3216 Oak St #5 Jacksonville, FL | 2.0 | 2.5 | 1708 | $2,600 | $1.52 | 7d | 1 | 1.16mi |
| 1332 Belvedere Ave Jacksonville, FL | 3.0 | 2.0 | 1506 | $2,950 | $1.96 | 7d | 1 | 1.19mi |
| 3159 Phyllis St Jacksonville, FL | 3.0 | 2.0 | 1209 | $1,561 | $1.29 | 3d | 1 | 1.19mi |
| 100 Magnolia St Jacksonville, FL | 1.0–2.0 | 1.0–2.0 | 921 | $2,202 | $2.39 | 1d | 46 | 1.20mi |
| 3229 Lenox Ave Unit 1 Jacksonville, FL | 3.0 | 2.5 | 1900 | $2,150 | $1.13 | 23d | 1 | 1.30mi |
| 3302 College St Jacksonville, FL | 3.0 | 1.0 | 1174 | $1,095 | $0.93 | 7d | 1 | 1.31mi |
| 3313 Green St Jacksonville, FL | 3.0 | 1.0 | 1058 | $1,450 | $1.37 | 7d | 1 | 1.33mi |
| 3311 Pine St Unit 1 Jacksonville, FL | 2.0 | 1.0 | 1100 | $1,950 | $1.77 | 23d | 1 | 1.33mi |
| 3312 Ernest St Jacksonville, FL | 3.0 | 1.0 | 1065 | $1,148 | $1.08 | 23d | 1 | 1.33mi |
Listing history 19 events
-
2026-06-18days on market $280,000 Active 178 DOM
-
2026-06-17days on market $280,000 Active 177 DOM
-
2026-06-16days on market $280,000 Active 176 DOM
-
2026-06-15days on market $280,000 Active 175 DOM
-
2026-06-10days on market $280,000 Active 169 DOM
-
2026-06-08days on market $280,000 Active 168 DOM
-
2026-06-08days on market $280,000 Active 167 DOM
-
2026-06-03days on market $280,000 Active 163 DOM
-
2026-06-02days on market $280,000 Active 162 DOM
-
2026-06-01days on market $280,000 Active 161 DOM
-
2026-05-31days on market $280,000 Active 160 DOM
-
2026-03-13status Active
-
2026-02-24status Pending
-
2026-02-17price $280,000
-
2025-12-05$350,000 Active
-
2020-02-27soldstatus $205,000
-
2020-02-25soldstatus $205,000 Sold 308-char remark
Show marketing remark (308 chars)
Here's a chance to add a great investment property to your portfolio. Great location in Riverside. Just a short walk to shops and restaurants. This 3-unit property consists of a duplex with two 1/1 and an additional 1/1 garage apartment. Great return with upside potential. Units rent quickly. 100% occupied.
-
2020-02-04status Pending 308-char remark
Show marketing remark (308 chars)
Here's a chance to add a great investment property to your portfolio. Great location in Riverside. Just a short walk to shops and restaurants. This 3-unit property consists of a duplex with two 1/1 and an additional 1/1 garage apartment. Great return with upside potential. Units rent quickly. 100% occupied.
-
2020-01-31$225,000 Active 308-char remark
Show marketing remark (308 chars)
Here's a chance to add a great investment property to your portfolio. Great location in Riverside. Just a short walk to shops and restaurants. This 3-unit property consists of a duplex with two 1/1 and an additional 1/1 garage apartment. Great return with upside potential. Units rent quickly. 100% occupied.
ⓘ Source: listings_history table (triggers on properties + properties_extension) + one-shot
backfill from property_details.listing_events for pre-trigger history.
Tax reassessment forecast FL · Resets to sale price
- Current annual tax
- $5,952 · $496/mo
- Projected year-2 tax
- $5,952 · $496/mo
- Expected delta
- $0/yr ($0/mo · 0.0%)
ⓘ Screening estimate from a state-policy table — verify with the county assessor before closing.
Climate risk First Street
- Flood 1/10 Low FEMA zone X (unshaded) · 0% chance over 30 yrs
- Wildfire 1/10 Low
- Heat 9/10 Extreme 7 d/yr ≥107°F today · 21 d/yr by 30 yrs out
- Wind 9/10 Extreme 99% chance of damaging wind over 30 yrs
- Air quality 5/10 Major 7 unhealthy d/yr today · 7 by 30 yrs out
Nearby sold comps map
Loading sold comps map…
Walkable amenities ~0.75 mi
Loading nearby amenities…
Taxation est. · year 1
- Rental income
- $50,976
- − Mortgage interest
- −$15,684
- − Property taxes
- −$5,952
- − Insurance
- −$1,400
- − Repairs & maintenance
- −$4,078
- − Management
- −$4,078
- − Depreciation
- −$8,145
- Taxable income
- $11,638
- Est. tax owed @ 24.0%
- −$2,793
- After-tax cash flow
- $12,506/yr
For passive investors: Depreciation is non-cash, so a rental often shows a tax loss while cash-flowing — sheltering income. Rental losses are passive: they offset passive income freely, and up to $25,000/yr can offset ordinary (W-2) income if you actively participate and your MAGI is under $100k (phasing out to $0 by $150k); unused losses carry forward. On sale, claimed depreciation is recaptured at up to 25%, and gains may owe capital-gains tax (a 1031 exchange can defer both). Figures are a year-1 estimate at your 24.0% rate — not tax advice; consult a CPA.
Schools (NCES district)
- District
- Duval
- NCES district ID
- 1200480
- Math proficiency
- 46% ▼ -11.00%
- Reading proficiency
- 45% ▼ -4.00%
- Median HH income
- $48,987
- Composite
- 38.97/100
- National rank
- #4076
- State rank
- #48 of 73 in FL
Livability — Jacksonville
- Score
- 83/100
- State rank
- #50
- US rank
- #911
Category grades
Schools grade is shown separately in the Schools card above.
Census & demographics
- Census place
- Jacksonville, FL
- County
- Duval County · 1,015,274 people
- City population
- 979,034
- Metro
- Jacksonville, FL
- Population (ZIP)
- 9,151
- Household income
- $65,063
- Rent vs Own
- Severe rent burden
- 866.0
Population outlook (Duval County) Hauer SSP2
- Today (2025)
- 1,013,010 people
- By 2030
- 1,059,228 · +4.6%
- By 2040
- 1,141,439 · +12.7%
- By 2050
- 1,205,258 · +19.0%
- By 2075
- 1,324,282 · +30.7%
- By 2100
- 1,319,620 · +30.3%
Race, ethnicity, and origin ACS 2023
- Neighborhood character
- Diverse neighborhood (Simpson 0.60)
- Race & ethnicity
- White 55% Black 30% Hispanic / Latino 6% Asian 6% Two or more races 6%
- Hispanic origin (detail)
- Mexican 3% Puerto Rican 1%
- Common ancestry
- Slovak 2% Lithuanian 2% Italian 1%
- Foreign-born
- 7% · China, Canada, Philippines
- Languages at home
- 92% English-only · Spanish 3% Chinese 2% Other Asian/Pacific 2%
Political lean MEDSL · Duval
- 2024 margin
- Toss-up / Even · D 48.7% · R 50.1% · Other 1.2%
- 2008→2024 swing
- +0.4pp no change · 2008: -1.9pp · 2024: -1.5pp
- All cycles
- 2024: R+1.5 2020: D+3.8 2016: R+1.5 2012: R+3.6 2008: R+1.9
Not yet ingested
- Civics
- —
Market trends
- HPI YoY
- ▼ -123.96%
- Current HPI
- 316.3185
- Rent YoY
- ▲ 4.69%
- Metro
- Jacksonville, FL
- State GDP YoY
- ▲ 3.28%
- F500 in state
- 36
Industry mix (Fortune 500 HQ in FL)
| Industry | F500 HQs | Revenue |
|---|---|---|
| Industrial Technology | 2 | $29B |
|
||
| Insurance | 2 | $17B |
|
||
| Retail | 1 | $60B |
|
||
| Technology Distribution | 1 | $58B |
|
||
| Homebuilding | 1 | $35B |
|
||
| Technology Manufacturing | 1 | $35B |
|
||
Price history
+24.4% since first listed8 events — show timeline
- 2026-03-13 Relisted — realMLS
- 2026-02-24 Pending — realMLS
- 2026-02-17 Price Changed $280,000 realMLS
- 2025-12-05 Listed $350,000 realMLS
- 2020-02-27 Sold (Public Records) $205,000 Public Records
- 2020-02-25 Sold (MLS) $205,000 realMLS
- 2020-02-04 Pending — realMLS
- 2020-01-31 Listed $225,000 realMLS
Property tax history
+10.3%/yrLatest (2025): $5,952 · +12.6% YoY. Source: county tax records.
Cash-flow waterfall
monthlySold comps — $/sqft
last 12 mo · ≤1 miLoading sold comps…