 🏷️ Likely Rental
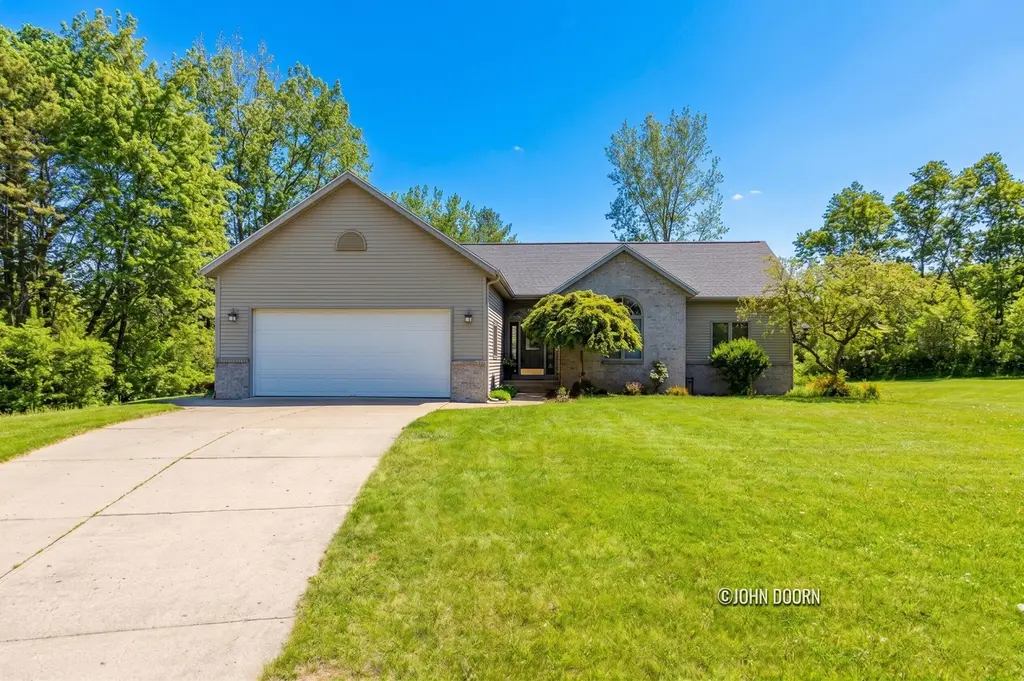
57 Rollingbrook Dr NE · Ada, MI
Flood risk 8/10 · Major
- FEMA flood zone
- X (unshaded)
- Chance of flooding over 30 yrs
- 0.78%
- Est. flood insurance / yr
- $473 – $860
Fire risk 1/10 · Minimal
- Est. fire insurance / yr
- $784 – $1,456
Heat risk 2/10 · Minimal
- Hot days now (above 96°F)
- 7 days/yr
- Hot days in 30 yrs
- 16 days/yr
Wind risk 2/10 · Minimal
- Chance of severe wind over 30 yrs
- —
Air-quality risk 3/10 · Minor
- Unhealthy air days now
- 3 days/yr
- Unhealthy air days in 30 yrs
- 3 days/yr
Risk factors via First Street. Map © Google.
Why this score? — see what drove the D+ grade
The composite is a weighted blend of 9 inputs, each scored 0–100. Each bar is that input's sub-score; the figure is the points it added to the 100-point composite (weight × sub-score).
- ARV discount +15.0/15.0
- Cash flow +11.9/30.0
- Schools +6.3/10.0
- DSCR +3.5/10.0
- 1% rule +3.2/10.0
- Rent growth +2.5/5.0
- Livability +2.5/5.0
- Condition / age +2.5/5.0
- Appreciation +0.0/10.0
$550,000
🖨 Deal sheet 📄 Offer letter ✓ Due diligence
Listing remarks MLS
Tucked into a private 1.19-acre wooded lot in the heart of Ada, this spacious 5-bedroom, 3.5-bath home has incredible bones and even better potential. Soaring ceilings, abundant natural light, and a generous walkout lower level give you all the space you need -- now it's just waiting for your personal touch. The kitchen and dining areas flow naturally together, and the backyard setting among mature trees is the kind of quiet, private backdrop that's hard to find at any price. For buyers who can see past cosmetics and into possibility, this is a rare opportunity in one of West Michigan's most desirable communities -- minutes from Ada's shops, dining, and parks. NOT FOR RENT!
Key facts
- Backyard oasis
- Gathering space
- Private wooded lot
Tags
Property features AI
Finance
- HOA & community: Homeowners association with a $400 quarterly fee
Exterior
- Parking: Attached 2-car garage
- Utilities: Well water; Natural gas water heater
- Home design: Ranch-style single family residence; Built in 1994
- Construction: Brick and vinyl siding construction; Shingle roof
- Exterior features: Wooded lot; Approximately 1.19 acres
Interior
- Kitchen: Dishwasher; Range; Refrigerator; Freezer
- Bathrooms: 2 full bathrooms; 2 half bathrooms
- Heating & cooling: Forced air heating; Has cooling
- Interior features: Eat-in kitchen; Walk-in pantry; Insulated windows; Fireplace; Total of 9 rooms
- Laundry & utility: Washer; Dryer
Neighborhood map
What this means for you Summary
Snapshot
- This is a 5-bed/3.0-bath condo listed at $550k.
Deal economics
- At list price, monthly cash flow is $-192 ($-2k/yr) — negative.
- To cash-flow at today's rent, offer at most $516k (6.2% below list).
- To meet the 1% rule (rent ≥ 1% of price), the offer needs to be $450k (18.2% below list).
- Recommended offer: $450k (18.2% below list) — sets the bar for 1% rule.
Location & tenants
- Location reads: area grade D — affects rentability + tenant quality, not the cash-flow math above.
- Forest Hills Public Schools (suburban): math 65% / reading 74% proficiency, ranked #11 of 540 in MI (top 2%) — acceptable for families but not a draw, mixed tenant base, ~2y average lease; only 8% free/reduced lunch — higher-income household profile.
- Market conditions: 120 active listings in the ZIP; 1 comparable units currently listed for rent nearby; 2,253 units permitted in Kent County in 2024 (969 in 5+ unit buildings).
Forward outlook
- Local home prices are declining (-3.0%/yr); year-one equity from $4k of loan paydown is wiped out by about $16k of value loss. Plan a longer hold.
- Kent County population projected at +22% by 2050 — long-run rental-demand tailwind backs the buy-and-hold thesis.
Negotiation context
- It's been on market 15 days — a 2% lower offer ($542k) is reasonable based on typical stale-listing flexibility.
- 6 sale attempts since 34y ago with the ask held roughly flat each time — persistent listings suggest the price (not the market) is what's stuck; bring a comps-based counter.
- Current owner paid $217k; list at $550k implies a 154% gain — meaningful room to come down on a strong offer.
Risks & watch-outs
- Watch-outs: flood insurance adds $56/mo.
- Climate carrying-cost: severe flood risk — expect insurance premiums to compound above CPI over the hold.
Questions for the listing agent
- What do current leases actually rent for vs. the listed asking? Can we see a recent rent roll and the last 12 months of T-12 income?
- What's the actual annual flood-insurance premium (NFIP or private), and is the property in a SFHA with mandatory coverage?
- What does the HOA fee cover, when was the last increase, and are there any pending special assessments or reserve-fund shortfalls?
- Any open or pending special assessments — roof, HVAC, plumbing, elevator, façade? What's the per-unit balance and payoff schedule, and is the seller paying it off at close or rolling it to the buyer?
- Is there a deadline driving the sale (1031 exchange, divorce, estate, relocation)? That informs how much negotiation room exists.
- The area grade is low — what's the realistic commute time and amenity access for the typical tenant pool here? Any planned neighborhood developments (good or bad) we should know about?
- What's the average days-on-market for RENTAL listings here right now (not sales)? A rising rental-DOM trend means longer vacancies and softer asking-rent achievability than the comps imply.
- What's the recent tenant-quality profile in this submarket — average credit score on applications, eviction rate, late-payment / NSF rate, and stable-employment percentage? A property-management company in the area should have these aggregated.
- How much new apartment / multifamily construction is in the pipeline within 1–3 miles? Heavy new supply (>2% of stock underway) typically softens rents 12–24 months out; light construction supports rent growth.
Investment metrics
- 1% rule
- 0.82% ✗
- Cap rate
- 5.99%
- Cash-on-cash
- -1.07%
- DSCR
- 0.95
- GRM
- 10.2
CMA / ARV
- ARV (median comp)
- $714,012
- List price
- $550,000
- Delta
- -22.97%
- Verdict
- UNDERPRICED
- Comps
- 20 within 1.0 mi
Projected returns pro-forma
-3.0% appreciation · 3.0% rent growth · sell at horizon
- IRR
- -18.8%
- Equity multiple
- 0.34×
- Total profit
- $-101,347
- Equity at exit
- $82,007
- IRR
- -11.2%
- Equity multiple
- 0.33×
- Total profit
- $-103,894
- Equity at exit
- $47,554
Cash invested: $154,000 (down + closing). Projections, not guarantees.
Landlord ↔ Tenant lean methodology
- Overall (STATE)
- 62 Landlord-Friendly
- State Michigan
- 62 Landlord-Friendly · EVEN
- County
- — inherits STATE
- City
- — inherits STATE
ZIP-level market 49301
- Home prices YoY
- -30.8%
- Active inventory
- 120
- Price-to-rent
- 10.2×
Monthly cashflow live
- Estimated rent
- $4,500 medium interval (Pro) →
- Mortgage (P&I)
- −$2,884
- Tax from tax record
- −$446 /mo · $5,346/yr
- Insurance
- −$229
- Flood insurance flood zone
- −$56 /mo · $666/yr
- HOA
- −$133
- Vacancy / Maint / Mgmt
- −$945
- Net cashflow
- $-192
Break-even live
UW: 25.0% down · 7.5% · 30yr · 1.5% tax · 5.0% vac · 8.0% maint · 8.0% mgmt
Financing live
Cash to close
- Down payment
- $137,500
- Closing costs
- $16,500
- Reserves months
- —
- Total cash needed
- —
Loan-product check · same deal, 3 products live
Conventional
25% down · 7.5% · 30yr
- Down + closing
- —
- Monthly P&I
- —
- Monthly cashflow
- —
- DSCR
- —
- Eligible?
- —
Personal DTI + credit; lowest rate.
DSCR
20% down · 8.5% · 30yr
- Down + closing
- —
- Monthly P&I
- —
- Monthly cashflow
- —
- DSCR
- —
- Eligible?
- —
No personal income docs; deal must DSCR.
Hard money
10% down · 12.0% · 12mo
- Down + closing
- —
- Monthly P&I
- —
- Monthly cashflow
- —
- DSCR
- —
- Eligible?
- —
Short-term bridge; refi at stabilization.
Rent comps 1 comps
| Address | Beds | Baths | Sqft | Rent | $/sqft | DOM | Units | Dist |
|---|---|---|---|---|---|---|---|---|
| 648 S Whitman Ct SE Ada, MI | 5.0 | 3.5 | 3708 | $4,500 | $1.21 | 3d | 1 | 0.94mi |
HOA detail condo
- Monthly dues
- $133 · $1,596/yr
- Assessments
- None detected in remarks — confirm with the listing agent.
Listing history 9 events
-
2026-05-14$550,000 Active 852-char remark
Show marketing remark (682 chars)
Tucked into a private 1.19-acre wooded lot in the heart of Ada, this spacious 5-bedroom, 3.5-bath home has incredible bones and even better potential. Soaring ceilings, abundant natural light, and a generous walkout lower level give you all the space you need -- now it's just waiting for your personal touch. The kitchen and dining areas flow naturally together, and the backyard setting among mature trees is the kind of quiet, private backdrop that's hard to find at any price. For buyers who can see past cosmetics and into possibility, this is a rare opportunity in one of West Michigan's most desirable communities -- minutes from Ada's shops, dining, and parks. NOT FOR RENT!
-
2026-05-14$550,000 Active 849-char remark
Show marketing remark (682 chars)
Tucked into a private 1.19-acre wooded lot in the heart of Ada, this spacious 5-bedroom, 3.5-bath home has incredible bones and even better potential. Soaring ceilings, abundant natural light, and a generous walkout lower level give you all the space you need -- now it's just waiting for your personal touch. The kitchen and dining areas flow naturally together, and the backyard setting among mature trees is the kind of quiet, private backdrop that's hard to find at any price. For buyers who can see past cosmetics and into possibility, this is a rare opportunity in one of West Michigan's most desirable communities -- minutes from Ada's shops, dining, and parks. NOT FOR RENT!
-
2026-05-14$550,000 Active
Show marketing remark (682 chars)
Tucked into a private 1.19-acre wooded lot in the heart of Ada, this spacious 5-bedroom, 3.5-bath home has incredible bones and even better potential. Soaring ceilings, abundant natural light, and a generous walkout lower level give you all the space you need -- now it's just waiting for your personal touch. The kitchen and dining areas flow naturally together, and the backyard setting among mature trees is the kind of quiet, private backdrop that's hard to find at any price. For buyers who can see past cosmetics and into possibility, this is a rare opportunity in one of West Michigan's most desirable communities -- minutes from Ada's shops, dining, and parks. NOT FOR RENT!
-
1996-04-29soldstatus $216,900
-
1996-04-29soldstatus $216,900
-
1996-01-25$219,900
-
1996-01-25$219,900
-
1993-06-29soldstatus $24,000
-
1992-10-15$30,000
ⓘ Source: listings_history table (triggers on properties + properties_extension) + one-shot
backfill from property_details.listing_events for pre-trigger history.
Tax reassessment forecast MI · Partial reset (capped growth)
- Current annual tax
- $5,346 · $446/mo
- Projected year-2 tax
- $6,908 · $576/mo
- Expected delta
- +$1,562/yr (+$130/mo · 29.2%)
ⓘ Screening estimate from a state-policy table — verify with the county assessor before closing.
Climate risk First Street
- Flood 8/10 Severe FEMA zone X (unshaded) · 78% chance over 30 yrs
- Wildfire 1/10 Low
- Heat 2/10 Low 7 d/yr ≥96°F today · 16 d/yr by 30 yrs out
- Wind 2/10 Low
- Air quality 3/10 Moderate 3 unhealthy d/yr today · 3 by 30 yrs out
Nearby sold comps map
Loading sold comps map…
Walkable amenities ~0.75 mi
Loading nearby amenities…
Taxation est. · year 1
- Rental income
- $54,000
- − Mortgage interest
- −$30,809
- − Property taxes
- −$5,346
- − Insurance
- −$3,416
- − Repairs & maintenance
- −$4,320
- − Management
- −$4,320
- − HOA
- −$1,596
- − Depreciation
- −$16,000
- Taxable loss
- −$11,807
- Est. tax savings @ 24.0%
- +$2,834
- After-tax cash flow
- $524/yr
For passive investors: Depreciation is non-cash, so a rental often shows a tax loss while cash-flowing — sheltering income. Rental losses are passive: they offset passive income freely, and up to $25,000/yr can offset ordinary (W-2) income if you actively participate and your MAGI is under $100k (phasing out to $0 by $150k); unused losses carry forward. On sale, claimed depreciation is recaptured at up to 25%, and gains may owe capital-gains tax (a 1031 exchange can defer both). Figures are a year-1 estimate at your 24.0% rate — not tax advice; consult a CPA.
Schools (NCES district)
- District
- Forest Hills Public Schools
- NCES district ID
- 2614610
- Math proficiency
- 65% ▼ -3.00%
- Reading proficiency
- 74% ▲ 1.00%
- Median HH income
- $95,067
- Composite
- 63.23/100
- National rank
- #632
- State rank
- #11 of 540 in MI
Livability — Ada
No livability data for this city. (Only ~50 U.S. cities are tracked.)
Census & demographics
- Census place
- Forest Hills, MI
- Population (ZIP)
- 20,492
Population outlook (Kent County) Hauer SSP2
- Today (2025)
- 712,484 people
- By 2030
- 748,618 · +5.1%
- By 2040
- 814,777 · +14.4%
- By 2050
- 868,556 · +21.9%
- By 2075
- 966,487 · +35.7%
- By 2100
- 967,975 · +35.9%
Race, ethnicity, and origin ACS 2023
- Neighborhood character
- Predominantly White (86%)
- Race & ethnicity
- White 86% Two or more races 6% Hispanic / Latino 5% Asian 4%
- Hispanic origin (detail)
- Mexican 2%
- Common ancestry
- Iranian 16% Romanian 6% Italian 4%
- Foreign-born
- 5% · Canada, China, Jamaica
- Languages at home
- 90% English-only · Spanish 4% Korean 1% Other Indo-European 1%
Political lean MEDSL · Kent
- 2024 margin
- Lean D (+5.4) · D 51.8% · R 46.5% · Other 1.7%
- 2008→2024 swing
- +4.8pp toward D · 2008: 0.5pp · 2024: 5.4pp
- All cycles
- 2024: D+5.4 2020: D+6.1 2016: R+3.1 2012: R+7.9 2008: D+0.5
Not yet ingested
- Civics
- —
Market trends
- HPI YoY
- ▼ -118.11%
- Current HPI
- 264.8246
- Rent YoY
- —
- Metro
- —
- State GDP YoY
- ▲ 1.37%
- F500 in state
- 28
Industry mix (Fortune 500 HQ in MI)
| Industry | F500 HQs | Revenue |
|---|---|---|
| Automotive Parts | 3 | $48B |
|
||
| Automotive | 2 | $372B |
|
||
| Chemicals | 1 | $45B |
|
||
| Automotive Retail | 1 | $29B |
|
||
| Healthcare / Medical Devices | 1 | $23B |
|
||
| Automotive Technology | 1 | $20B |
|
||
Price history
+1733.3% since first listed12 events — show timeline
- 2026-05-30 Pending — REALCOMP
- 2026-05-30 Pending — MiRealSource-MiMLS
- 2026-05-30 Pending — SW Michigan MLS
- 2026-05-14 Listed $550,000 SW Michigan MLS
- 2026-05-14 Listed $550,000 MiRealSource-MiMLS
- 2026-05-14 Listed $550,000 REALCOMP
- 1996-04-29 Sold (MLS) $216,900 REALCOMP
- 1996-04-29 Sold (MLS) $216,900 SW Michigan MLS
- 1996-01-25 Listed $219,900 REALCOMP
- 1996-01-25 Listed $219,900 SW Michigan MLS
- 1993-06-29 Sold (MLS) $24,000 SW Michigan MLS
- 1992-10-15 Listed $30,000 SW Michigan MLS
Property tax history
+2.6%/yrLatest (2025): $5,346 · +2.6% YoY. Source: county tax records.
Cash-flow waterfall
monthlySold comps — $/sqft
last 12 mo · ≤1 miLoading sold comps…