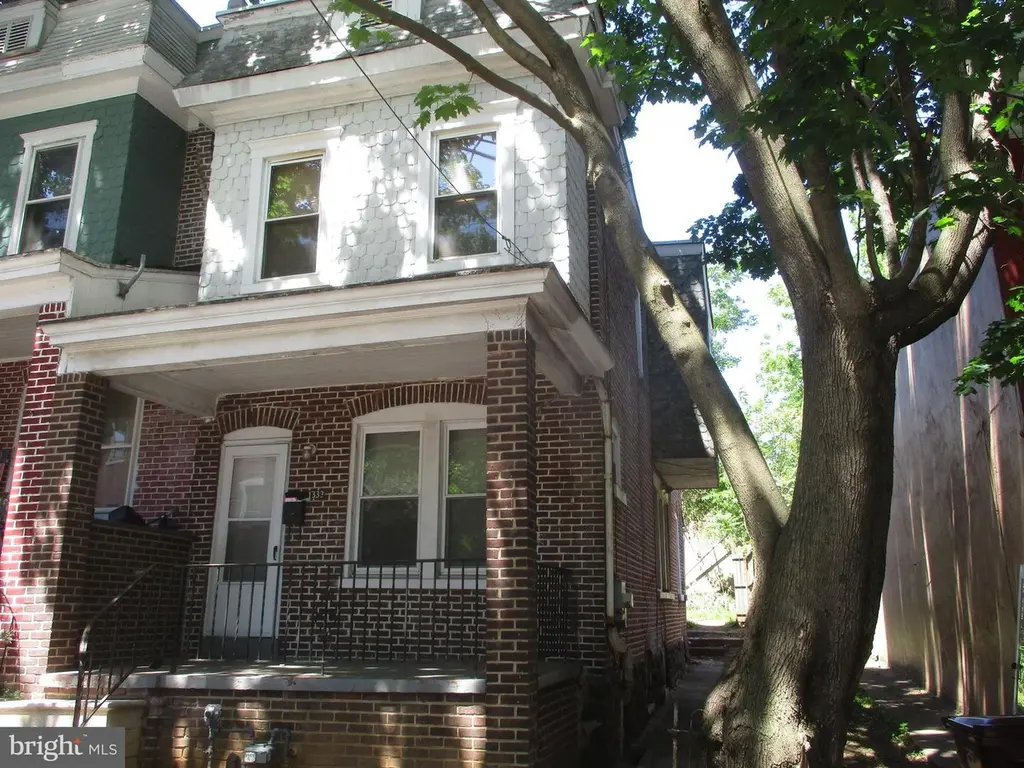
1333 W 5th St · Wilmington, DE
Flood risk 1/10 · Minimal
- FEMA flood zone
- X (unshaded)
- Chance of flooding over 30 yrs
- 0.0%
- Est. flood insurance / yr
- $473 – $860
Fire risk 1/10 · Minimal
- Est. fire insurance / yr
- $476 – $884
Heat risk 7/10 · Major
- Hot days now (above 103°F)
- 7 days/yr
- Hot days in 30 yrs
- 16 days/yr
Wind risk 6/10 · Moderate
- Chance of severe wind over 30 yrs
- 27.0%
Air-quality risk 3/10 · Minor
- Unhealthy air days now
- 3 days/yr
- Unhealthy air days in 30 yrs
- 4 days/yr
Risk factors via First Street. Map © Google.
Why this score? — see what drove the B grade
The composite is a weighted blend of 9 inputs, each scored 0–100. Each bar is that input's sub-score; the figure is the points it added to the 100-point composite (weight × sub-score).
- Cash flow +30.0/30.0
- ARV discount +14.0/15.0
- DSCR +10.0/10.0
- 1% rule +7.7/10.0
- Rent growth +4.1/5.0
- Livability +3.2/5.0
- Schools +3.1/10.0
- Condition / age +2.5/5.0
- Appreciation +0.0/10.0
$150,000
🖨 Deal sheet 📄 Offer letter ✓ Due diligence
Listing remarks MLS
None
Key facts
- Built 1910
- Listed 36 days
Property features AI
Exterior
- Parking: On-street parking
- Utilities: Public water; Public sewer; Natural gas
- Home design: Semi-detached property; Fee simple ownership
- Construction: Brick construction; Other foundation type; Above-grade and below-grade structures; Built year per assessor
- Exterior features: Front porch(es); Lot dimensions approximately 18 x 100
Interior
- Bedrooms: 3 bedrooms on the upper level
- Bathrooms: 1 full bathroom
- Heating & cooling: Radiator heat; Natural gas hot water
- Interior features: Full basement
Neighborhood map
What this means for you Summary
Snapshot
- This is a 3-bed/1.0-bath townhouse listed at $150k.
Deal economics
- At list price, monthly cash flow is $598 ($7k/yr) — positive.
- The deal already cash-flows at list — no discount required.
- Meets the 1% rule at list price ($2k rent vs $150k).
- Recommended offer: $146k (3.0% below list) — sets the bar for market timing.
- Cap rate 11.1% vs local median 5.6% in Wilmington — top-decile yield for the area; either an underpriced asset or a hidden risk that comps aren't pricing in. Stress-test before assuming the spread holds.
Location & tenants
- Location reads 64/100 on livability (#52 in DE) — a middle-class / working-renter tenant base. Strengths: cost of living A+, housing A; Watch: employment D+, schools D, commute D.
- Red Clay Consolidated School District (suburban): math 27% / reading 42% proficiency, ranked #12 of 26 in DE (top 46%) — families likely to look elsewhere, expect single-tenant / working-renter base with shorter leases.
- Market conditions: Rents rising fast (+6.3%/yr); 167 active listings in the ZIP; 40 comparable units currently listed for rent nearby; rentals at typical pace (median 19d on market — plan ~3-4 weeks tenant-placement turnaround); 1,367 units permitted in New Castle County in 2024 (201 in 5+ unit buildings).
- This rent runs 38% of the median local income ($60k/yr) — at the standard rent-burdened threshold; future hikes will face affordability resistance.
Forward outlook
- Local home prices are declining (-3.0%/yr); year-one equity from $1k of loan paydown is wiped out by about $4k of value loss. Plan a longer hold.
- New Castle County population projected at +9% by 2050 — modest demand growth; plan on rents tracking national, not racing it.
- At projected returns (-3.0% appreciation + 6.3% rent growth), your $42k cash investment doubles in ~6 years — after that, you're playing with house money.
Negotiation context
- It's been on market 36 days — a 3% lower offer ($146k) is reasonable based on typical stale-listing flexibility.
- 3 sale attempts since 15y ago with the ask held roughly flat each time — persistent listings suggest the price (not the market) is what's stuck; bring a comps-based counter.
Risks & watch-outs
- Watch-outs: built in 1910 — expect roof / HVAC / electrical / plumbing capex.
- Climate carrying-cost: major wind risk, 27% chance of damaging wind over 30y; extreme-heat days projected 7→16/yr by 2055 (HVAC capex compounding) — expect insurance premiums to compound above CPI over the hold.
Questions for the listing agent
- It's been on market 36 days. Have you received any prior offers? Is the seller open to a 3% concession, seller financing, or rate buy-down credit?
- Built in 1910 — when were the roof, HVAC, electrical panel, plumbing, and water heater last replaced?
- Is there a deadline driving the sale (1031 exchange, divorce, estate, relocation)? That informs how much negotiation room exists.
- Schools are D-rated, which usually means shorter tenancies and higher turnover. Who's the typical renter profile here, and what's been the actual vacancy rate?
- Crime grade is F in this area — have there been break-ins, vandalism, or insurance claims at this property in the last 3 years? What carrier currently insures it and at what premium?
- What's the average days-on-market for RENTAL listings here right now (not sales)? A rising rental-DOM trend means longer vacancies and softer asking-rent achievability than the comps imply.
- What's the recent tenant-quality profile in this submarket — average credit score on applications, eviction rate, late-payment / NSF rate, and stable-employment percentage? A property-management company in the area should have these aggregated.
- How much new for-sale + rental construction is in the pipeline within 1–3 miles? Heavy new supply typically softens prices + rents 12–24 months out; constrained supply supports both.
Investment metrics
- 1% rule
- 1.27% ✓
- Cap rate
- 11.08%
- Cash-on-cash
- 17.09%
- DSCR
- 1.76
- GRM
- 6.5
CMA / ARV
- ARV (median comp)
- $175,139
- List price
- $150,000
- Delta
- -14.35%
- Verdict
- UNDERPRICED
- Comps
- 20 within 1.0 mi
Show comp detail 12 sales within ~0.75 mi
| Address | Dist | Beds/Ba | Sqft | Sold | Price | $/sf | Match |
|---|---|---|---|---|---|---|---|
| 1213 W 3rd St | 0.16mi | 3/1.5 | 1,250 (-4%) | 1mo | $215,000 | $172 | 83 |
| 1210 Elm St | 0.41mi | 3/2.0 | 1,300 (0%) | 1mo | $200,000 | $154 | 76 |
| 1911 W 9th St | 0.49mi | 3/1.0 | 1,325 (+2%) | 1mo | $275,000 | $208 | 73 |
| 1715 Sycamore St | 0.60mi | 3/1.0 | 1,260 (-3%) | 1mo | $241,000 | $191 | 66 |
| 1301 Lancaster Ave | 0.25mi | 4/2.0 (+1) | 1,200 (-8%) | 1mo | $250,000 | $208 | 66 |
| 302 S Franklin St | 0.40mi | 3/1.0 | 1,150 (-12%) | 1mo | $117,000 | $102 | 61 |
| 422 S Broom St | 0.47mi | 3/2.0 | 1,400 (+8%) | 1mo | $299,900 | $214 | 60 |
| 1018 Trenton Pl | 0.54mi | 3/1.5 | 1,400 (+8%) | 1mo | $274,000 | $196 | 59 |
| 519 S Jackson St | 0.58mi | 3/1.0 | 1,200 (-8%) | 1mo | $186,000 | $155 | 59 |
| 519 Lafayette Blvd | 0.60mi | 2/1.5 (-1) | 1,250 (-4%) | 0mo | $235,000 | $188 | 58 |
| 400 Geddes St | 0.66mi | 3/1.5 | 1,225 (-6%) | 0mo | $337,500 | $276 | 57 |
| 315 S Jackson St | 0.48mi | 3/1.5 | 1,475 (+14%) | 1mo | $180,000 | $122 | 52 |
Match score weights: distance 35% · size 25% · config 20% · recency 20%. Top-matched comps best support the ARV.
Projected returns pro-forma
-3.0% appreciation · 6.35% rent growth · sell at horizon
- IRR
- 11.8%
- Equity multiple
- 1.49×
- Total profit
- $20,399
- Equity at exit
- $22,365
- IRR
- 23.1%
- Equity multiple
- 3.28×
- Total profit
- $95,868
- Equity at exit
- $12,969
Cash invested: $42,000 (down + closing). Projections, not guarantees.
Landlord ↔ Tenant lean methodology
- Overall (STATE)
- 70 Landlord-Friendly
- State Delaware
- 70 Landlord-Friendly · D+7
- County
- — inherits STATE
- City
- — inherits STATE
ZIP-level market 19805
- Rents YoY
- 6.3%
- Active inventory
- 167
- Price-to-rent
- 6.5×
Monthly cashflow live
- Estimated rent
- $1,909 high interval (Pro) →
- Mortgage (P&I)
- −$787
- Tax from tax record
- −$61 /mo · $730/yr
- Insurance
- −$62
- HOA
- −$0
- Vacancy / Maint / Mgmt
- −$401
- Net cashflow
- $598
Break-even live
UW: 25.0% down · 7.5% · 30yr · 1.5% tax · 5.0% vac · 8.0% maint · 8.0% mgmt
Financing live
Cash to close
- Down payment
- $37,500
- Closing costs
- $4,500
- Reserves months
- —
- Total cash needed
- —
Loan-product check · same deal, 3 products live
Conventional
25% down · 7.5% · 30yr
- Down + closing
- —
- Monthly P&I
- —
- Monthly cashflow
- —
- DSCR
- —
- Eligible?
- —
Personal DTI + credit; lowest rate.
DSCR
20% down · 8.5% · 30yr
- Down + closing
- —
- Monthly P&I
- —
- Monthly cashflow
- —
- DSCR
- —
- Eligible?
- —
No personal income docs; deal must DSCR.
Hard money
10% down · 12.0% · 12mo
- Down + closing
- —
- Monthly P&I
- —
- Monthly cashflow
- —
- DSCR
- —
- Eligible?
- —
Short-term bridge; refi at stabilization.
Rent comps 40 comps
| Address | Beds | Baths | Sqft | Rent | $/sqft | DOM | Units | Dist |
|---|---|---|---|---|---|---|---|---|
| 521 N Franklin St Wilmington, DE | 3.0 | 2.0 | 1500 | $1,850 | $1.23 | 3d | 1 | 0.08mi |
| 307 N Rodney St Wilmington, DE | 3.0 | 1.5 | 1425 | $2,000 | $1.40 | 43d | 1 | 0.13mi |
| 232 N Franklin St Wilmington, DE | 3.0 | 2.0 | 1150 | $1,795 | $1.56 | 43d | 1 | 0.17mi |
| 1522 W 7th St Unit 1 Wilmington, DE | 2.0 | 1.0 | 900 | $1,800 | $2.00 | 4d | 1 | 0.17mi |
| 1301 Lancaster Ave Wilmington, DE | 4.0 | 2.0 | 1200 | $1,800 | $1.50 | 11d | 1 | 0.25mi |
| 115 N Clayton St Unit 115 Wilmington, DE | 3.0 | 1.5 | 1200 | $1,725 | $1.44 | 11d | 1 | 0.28mi |
| 1607 Howland St Wilmington, DE | 3.0 | 1.0 | 1075 | $1,900 | $1.77 | 3d | 1 | 0.30mi |
| 618 N Scott St Wilmington, DE | 3.0 | 1.5 | 1400 | $1,850 | $1.32 | 43d | 1 | 0.31mi |
| 1000 W 8th St Unit 3 Wilmington, DE | 2.0 | 1.0 | 1050 | $1,695 | $1.61 | 24d | 1 | 0.32mi |
| 1029 Lancaster Ave Wilmington, DE | 4.0 | 1.5 | 1375 | $1,900 | $1.38 | 24d | 1 | 0.34mi |
| 1110 Read St Wilmington, DE | 2.0 | 1.0 | 1100 | $1,250 | $1.14 | 20d | 1 | 0.34mi |
| 1624 W 9th St Wilmington, DE | 3.0 | 2.5 | 1780 | $2,500 | $1.40 | 18d | 1 | 0.35mi |
| 820 W 7th St Wilmington, DE | 3.0 | 1.0 | 1000 | $1,650 | $1.65 | 43d | 1 | 0.40mi |
| 1227 Linden St Wilmington, DE | 3.0 | 2.0 | 950 | $1,850 | $1.95 | 3d | 1 | 0.42mi |
| 205 Porter St Wilmington, DE | 2.0 | 1.5 | 1200 | $1,700 | $1.42 | 15d | 1 | 0.42mi |
| 414 S Franklin St Wilmington, DE | 3.0 | 2.0 | 1195 | $1,895 | $1.59 | 43d | 1 | 0.47mi |
| 617 W 6th St Unit 617 B Wilmington, DE | 3.0 | 1.0 | 1000 | $1,600 | $1.60 | 5d | 1 | 0.52mi |
| 1110 Maple St Wilmington, DE | 3.0 | 1.0 | 1525 | $1,600 | $1.05 | 43d | 1 | 0.52mi |
| 709 Windsor St Unit 3 Wilmington, DE | 2.0 | 1.0 | 980 | $1,500 | $1.53 | 43d | 1 | 0.53mi |
| 711 Windsor St Wilmington, DE | 2.0 | 1.0 | 980 | $1,460 | $1.49 | 43d | 1 | 0.54mi |
| 1010 Trenton Pl Wilmington, DE | 3.0 | 1.5 | 1475 | $2,350 | $1.59 | 16d | 1 | 0.54mi |
| 1525 Beech St Wilmington, DE | 3.0 | 2.5 | 1850 | $2,400 | $1.30 | 5d | 1 | 0.57mi |
| 507 W 4th St Wilmington, DE | 3.0 | 1.5 | 1075 | $1,800 | $1.67 | 12d | 1 | 0.58mi |
| 1815 Maple St Wilmington, DE | 3.0 | 1.5 | 1100 | $1,995 | $1.81 | 18d | 1 | 0.58mi |
| 1210 Delaware Ave Unit 3 Wilmington, DE | 2.0 | 1.0 | 1200 | $2,395 | $2.00 | 43d | 1 | 0.59mi |
| 1212 Delaware Ave Wilmington, DE | 2.0 | 1.0–2.0 | 700 | $2,495 | $3.56 | 43d | 4 | 0.59mi |
| 1212 Delaware Ave Wilmington, DE | 2.0 | 1.0–2.0 | 925 | $2,695 | $2.91 | 12d | 4 | 0.59mi |
| 1802 Maple St Wilmington, DE | 3.0 | 1.5 | 1250 | $2,500 | $2.00 | 24d | 1 | 0.59mi |
| 613 W 10th St Wilmington, DE | 2.0 | 1.0 | 1100 | $1,745 | $1.59 | 43d | 1 | 0.60mi |
| 1207 Delaware Ave Wilmington, DE | 2.0 | 1.0 | 1200 | $1,700 | $1.42 | 11d | 1 | 0.62mi |
| 1301 N Harrison St Wilmington, DE | 1.0–2.0 | 1.0 | 1050 | $1,850 | $1.76 | 5d | 1 | 0.65mi |
| 1504 Delaware Ave Wilmington, DE | 2.0 | 1.0 | 1100 | $1,590 | $1.45 | 16d | 1 | 0.67mi |
| 1504 Delaware Ave Wilmington, DE | 2.0 | 1.0 | 1100 | $1,749 | $1.59 | 22d | 1 | 0.67mi |
| 1501 N Broom St Unit 2/3 Wilmington, DE | 2.0 | 2.5 | 1250 | $2,500 | $2.00 | 5d | 1 | 0.69mi |
| 225 W 4th St Unit 2 Wilmington, DE | 2.0 | 1.0 | 1000 | $1,599 | $1.60 | 43d | 1 | 0.73mi |
| 1610 N Broom St Unit 2 Wilmington, DE | 2.0 | 1.0 | 1000 | $2,150 | $2.15 | 43d | 1 | 0.74mi |
| 21 Stroud St Unit 1 Wilmington, DE | 3.0 | 1.5 | 1875 | $1,900 | $1.01 | 43d | 1 | 0.74mi |
| 25 Stroud St Wilmington, DE | 3.0 | 1.0 | 1200 | $1,795 | $1.50 | 3d | 1 | 0.74mi |
| 839 N Tatnall St Unit 101 Wilmington, DE | 2.0 | 2.0 | 1211 | $1,750 | $1.45 | 5d | 1 | 0.75mi |
| 839 N Tatnall St Unit 303 Wilmington, DE | 2.0 | 2.0 | 876 | $1,475 | $1.68 | 5d | 1 | 0.75mi |
Listing history 22 events
-
2026-06-18days on market $150,000 Active 36 DOM
-
2026-06-17days on market $150,000 Active 35 DOM
-
2026-06-16days on market $150,000 Active 34 DOM
-
2026-06-15days on market $150,000 Active 33 DOM
-
2026-06-13days on market $150,000 Active 31 DOM
-
2026-06-13days on market $150,000 Active 30 DOM
-
2026-06-09days on market $150,000 Active 27 DOM
-
2026-06-08days on market $150,000 Active 26 DOM
-
2026-06-07days on market $150,000 Active 25 DOM
-
2026-06-04days on market $150,000 Active 22 DOM
-
2026-06-03days on market $150,000 Active 21 DOM
-
2026-06-02days on market $150,000 Active 20 DOM
-
2026-06-01days on market $150,000 Active 19 DOM
-
2026-05-31days on market $150,000 Active 18 DOM
-
2026-05-13$150,000 Active 545-char remark
-
2026-04-21soldstatus $1,575,100
-
2012-06-05soldstatus $24,000
Show marketing remark (4 chars)
None
-
2012-06-05soldstatus $24,000
Show marketing remark (4 chars)
None
-
2012-05-02historical
Show marketing remark (4 chars)
None
-
2011-12-27$34,900
Show marketing remark (4 chars)
None
-
2011-12-27$34,900
Show marketing remark (4 chars)
None
-
2003-10-07soldstatus $35,100
ⓘ Source: listings_history table (triggers on properties + properties_extension) + one-shot
backfill from property_details.listing_events for pre-trigger history.
Tax reassessment forecast DE · Partial reset (capped growth)
- Current annual tax
- $730 · $61/mo
- Projected year-2 tax
- $800 · $67/mo
- Expected delta
- +$70/yr (+$6/mo · 9.6%)
ⓘ Screening estimate from a state-policy table — verify with the county assessor before closing.
Climate risk First Street
- Flood 1/10 Low FEMA zone X (unshaded) · 0% chance over 30 yrs
- Wildfire 1/10 Low
- Heat 7/10 Severe 7 d/yr ≥103°F today · 16 d/yr by 30 yrs out
- Wind 6/10 Major 27% chance of damaging wind over 30 yrs
- Air quality 3/10 Moderate 3 unhealthy d/yr today · 4 by 30 yrs out
Nearby sold comps map
Loading sold comps map…
Walkable amenities ~0.75 mi
Loading nearby amenities…
Taxation est. · year 1
- Rental income
- $22,910
- − Mortgage interest
- −$8,402
- − Property taxes
- −$730
- − Insurance
- −$750
- − Repairs & maintenance
- −$1,833
- − Management
- −$1,833
- − Depreciation
- −$4,364
- Taxable income
- $4,998
- Est. tax owed @ 24.0%
- −$1,200
- After-tax cash flow
- $5,980/yr
For passive investors: Depreciation is non-cash, so a rental often shows a tax loss while cash-flowing — sheltering income. Rental losses are passive: they offset passive income freely, and up to $25,000/yr can offset ordinary (W-2) income if you actively participate and your MAGI is under $100k (phasing out to $0 by $150k); unused losses carry forward. On sale, claimed depreciation is recaptured at up to 25%, and gains may owe capital-gains tax (a 1031 exchange can defer both). Figures are a year-1 estimate at your 24.0% rate — not tax advice; consult a CPA.
Schools (NCES district)
- District
- Red Clay Consolidated School District
- NCES district ID
- 1001300
- Math proficiency
- 27% ▼ -11.00%
- Reading proficiency
- 42% ▼ -7.00%
- Median HH income
- $64,298
- Composite
- 31.25/100
- National rank
- #6027
- State rank
- #12 of 26 in DE
Livability — Wilmington
- Score
- 64/100
- State rank
- #52
- US rank
- #14251
Category grades
Schools grade is shown separately in the Schools card above.
Census & demographics
- Census place
- Wilmington, DE
- County
- New Castle County · 483,412 people
- City population
- 173,480
- Metro
- Philadelphia-Camden-Wilmington, PA-NJ-DE-MD
- Population (ZIP)
- 41,402
- Household income
- $60,221
- Rent vs Own
- Severe rent burden
- 1730.0
Population outlook (New Castle County) Hauer SSP2
- Today (2025)
- 594,686 people
- By 2030
- 609,164 · +2.4%
- By 2040
- 632,154 · +6.3%
- By 2050
- 649,068 · +9.1%
- By 2075
- 687,771 · +15.7%
- By 2100
- 694,961 · +16.9%
Race, ethnicity, and origin ACS 2023
- Neighborhood character
- Diverse neighborhood (Simpson 0.70)
- Race & ethnicity
- White 37% Black 32% Hispanic / Latino 25% Two or more races 10%
- Hispanic origin (detail)
- Mexican 10% Puerto Rican 10% Dominican 2%
- Common ancestry
- Romanian 4% Slovak 1% Italian 1%
- Foreign-born
- 9% · Canada
- Languages at home
- 79% English-only · Spanish 18% French/Haitian/Cajun 1% Arabic 1%
Political lean MEDSL · New Castle
- 2024 margin
- Solid D (+32.6) · D 65.5% · R 32.9% · Other 1.6%
- 2008→2024 swing
- -8.1pp toward R · 2008: 40.6pp · 2024: 32.6pp
- All cycles
- 2024: D+32.6 2020: D+37.1 2016: D+29.6 2012: D+34.1 2008: D+40.6
Not yet ingested
- Civics
- —
Market trends
- HPI YoY
- ▼ -291.16%
- Current HPI
- 259.1455
- Rent YoY
- ▲ 6.35%
- Metro
- Philadelphia-Camden-Wilmington, PA-NJ-DE-MD
- State GDP YoY
- —
- F500 in state
- 0
Price history
+327.4% since first listed8 events — show timeline
- 2026-05-13 Listed $150,000 BRIGHT MLS
- 2026-04-21 Sold (Public Records) $1,575,100 Public Records
- 2012-06-05 Sold (MLS) $24,000 BRIGHT MLS
- 2012-06-05 Sold (MLS) $24,000 TREND
- 2012-05-02 Listing Removed — BRIGHT MLS
- 2011-12-27 Listed $34,900 BRIGHT MLS
- 2011-12-27 Listed $34,900 TREND
- 2003-10-07 Sold (Public Records) $35,100 Public Records
Property tax history
+3.7%/yrLatest (2024): $730 · +15.1% YoY. Source: county tax records.
Cash-flow waterfall
monthlySold comps — $/sqft
last 12 mo · ≤1 miLoading sold comps…