TBD 140 Minwood St · Mineola, TX
Flood risk 1/10 · Minimal
- FEMA flood zone
- X (unshaded)
- Chance of flooding over 30 yrs
- 0.0%
- Est. flood insurance / yr
- $507 – $1,088
Fire risk 4/10 · Minor
- Est. fire insurance / yr
- $1,222 – $2,270
Heat risk 7/10 · Major
- Hot days now (above 110°F)
- 7 days/yr
- Hot days in 30 yrs
- 26 days/yr
Wind risk 6/10 · Moderate
- Chance of severe wind over 30 yrs
- 48.0%
Air-quality risk 2/10 · Minimal
- Unhealthy air days now
- 1 days/yr
- Unhealthy air days in 30 yrs
- 1 days/yr
Risk factors via First Street. Map © Google.
Why this score? — see what drove the B grade
The composite is a weighted blend of 9 inputs, each scored 0–100. Each bar is that input's sub-score; the figure is the points it added to the 100-point composite (weight × sub-score).
- Cash flow +30.0/30.0
- 1% rule +10.0/10.0
- DSCR +10.0/10.0
- ARV discount +7.5/15.0
- Schools +4.2/10.0
- Livability +3.5/5.0
- Rent growth +2.5/5.0
- Condition / age +2.5/5.0
- Appreciation +0.0/10.0
$90,000
🖨 Deal sheet 📄 Offer letter ✓ Due diligence
Listing remarks MLS
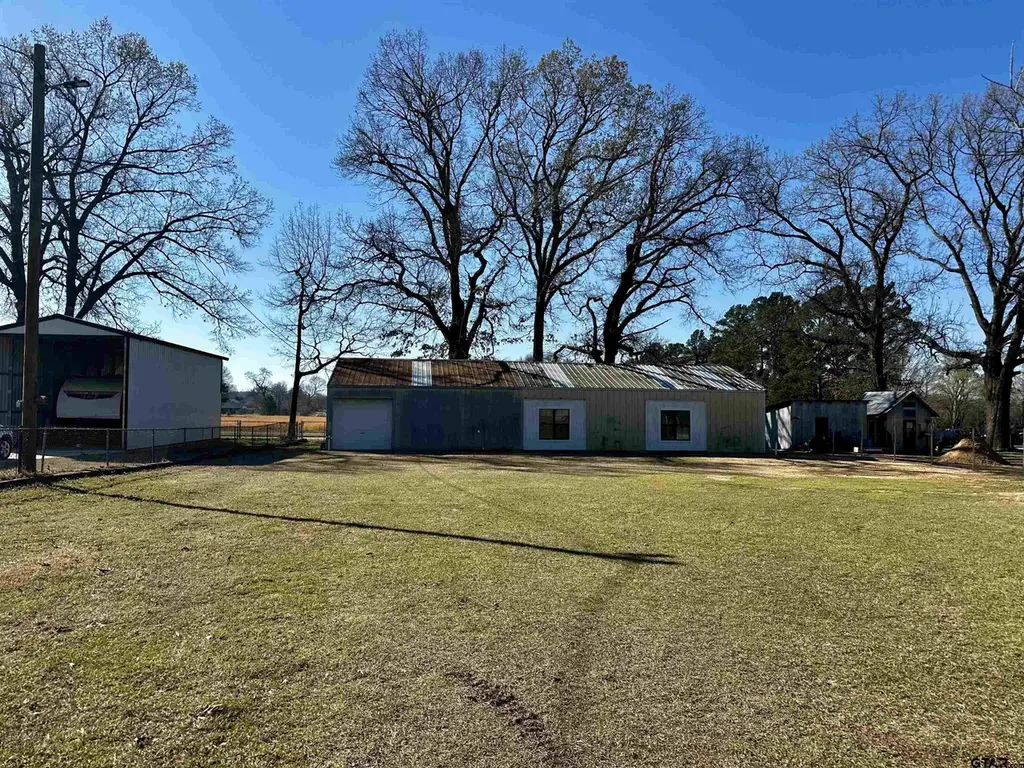
Dont miss out on this prime opportunity in Mineola! Located on a quiet street in a great neighborhood, this 2 bed, 1 bath home sits on a beautiful oversized lot with plenty of room to expand or customize. Originally converted from a shop, it offers a unique layout and tons of potential to make it your own. AI-enhanced photos are included to showcase possible finishes and design ideas. A rare chance to create something special in a highly desirable location!
Key facts
- Quiet street
- Unique layout
- Oversized lot
Tags
Neighborhood map
What this means for you Summary
Snapshot
- This is a 2-bed/4.0-bath single-family listed at $90k.
Deal economics
- At list price, monthly cash flow is $399 ($5k/yr) — positive.
- The deal already cash-flows at list — no discount required.
- Meets the 1% rule at list price ($1k rent vs $90k).
- Recommended offer: $82k (9.0% below list) — sets the bar for market timing.
- Cap rate 11.6% vs local median 2.6% in Mineola — top-decile yield for the area; either an underpriced asset or a hidden risk that comps aren't pricing in. Stress-test before assuming the spread holds.
Location & tenants
- Location reads 69/100 on livability (#392 in TX) — a middle-class / working-renter tenant base. Strengths: cost of living A+, housing A+, health & safety A; Watch: employment D, schools D-, amenities F.
- Mineola ISD (town): math 54% / reading 46% proficiency, ranked #190 of 826 in TX (top 23%) — acceptable for families but not a draw, mixed tenant base, ~2y average lease.
- Market conditions: 261 active listings in the ZIP; 3 comparable units currently listed for rent nearby; rentals at typical pace (median 21d on market — plan ~3-4 weeks tenant-placement turnaround); 72 units permitted in Wood County in 2024 (29 in 5+ unit buildings).
Forward outlook
- Local home prices are declining (-3.0%/yr); year-one equity from $622 of loan paydown is wiped out by about $3k of value loss. Plan a longer hold.
- Wood County population projected at +12% by 2050 — modest demand growth; plan on rents tracking national, not racing it.
- At projected returns (-3.0% appreciation + 3.0% rent growth), your $25k cash investment doubles in ~7 years — after that, you're playing with house money.
Negotiation context
- It's been on market 111 days — a 9% lower offer ($82k) is reasonable based on typical stale-listing flexibility.
Risks & watch-outs
- Watch-outs: property tax is 3.5% of price.
- Climate carrying-cost: major wind risk, 48% chance of damaging wind over 30y; extreme-heat days projected 7→26/yr by 2055 (HVAC capex compounding) — expect insurance premiums to compound above CPI over the hold.
Questions for the listing agent
- It's been on market 111 days. Have you received any prior offers? Is the seller open to a 9% concession, seller financing, or rate buy-down credit?
- Property tax is high relative to price — has the assessment been appealed recently, and will the sale trigger a re-assessment?
- Why hasn't it sold? Are there any deal-killer items the seller is aware of (foundation, flood, title, zoning, code violations)?
- Is there a deadline driving the sale (1031 exchange, divorce, estate, relocation)? That informs how much negotiation room exists.
- Schools are D-rated, which usually means shorter tenancies and higher turnover. Who's the typical renter profile here, and what's been the actual vacancy rate?
- What's the average days-on-market for RENTAL listings here right now (not sales)? A rising rental-DOM trend means longer vacancies and softer asking-rent achievability than the comps imply.
- What's the recent tenant-quality profile in this submarket — average credit score on applications, eviction rate, late-payment / NSF rate, and stable-employment percentage? A property-management company in the area should have these aggregated.
- How much new for-sale + rental construction is in the pipeline within 1–3 miles? Heavy new supply typically softens prices + rents 12–24 months out; constrained supply supports both.
Investment metrics
- 1% rule
- 1.65% ✓
- Cap rate
- 11.61%
- Cash-on-cash
- 18.99%
- DSCR
- 1.84
- GRM
- 5.1
CMA / ARV
- ARV (median comp)
- $219,826
- List price
- $90,000
- Delta
- -59.06%
- Verdict
- UNDERPRICED
- Comps
- 20 within 1.0 mi
Show comp detail 12 sales within ~0.75 mi
| Address | Dist | Beds/Ba | Sqft | Sold | Price | $/sf | Match |
|---|---|---|---|---|---|---|---|
| 146 E Loop 564 | 0.13mi | 3/2.0 (+1) | 1,781 (+2%) | 14mo | $239,900 | $135 | 66 |
| 158 County Road 2426 | 0.40mi | 3/2.0 (+1) | 1,758 (+1%) | 8mo | $275,000 | $156 | 61 |
| 230 Minwood St | 0.17mi | 2/2.0 | 1,565 (-10%) | 8mo | $225,000 | $144 | 60 |
| 2235 N Pacific St | 0.34mi | 3/2.0 (+1) | 1,630 (-7%) | 2mo | $184,900 | $113 | 58 |
| 1502 Robin St | 0.46mi | 3/2.0 (+1) | 1,757 (+1%) | 10mo | $275,000 | $157 | 57 |
| 181 Minwood St | 0.08mi | 3/2.0 (+1) | 1,523 (-13%) | 8mo | $184,900 | $121 | 55 |
| 1838 Park Pl | 0.23mi | 2/2.0 | 1,524 (-13%) | 6mo | $265,000 | $174 | 55 |
| 320 Nuss Dr | 0.64mi | 2/1.5 | 1,701 (-3%) | 11mo | $210,000 | $123 | 47 |
| 247 Spring Lake Dr | 0.30mi | 3/2.0 (+1) | 1,964 (+12%) | 13mo | $350,000 | $178 | 41 |
| 454 Pamela Dr | 0.47mi | 3/2.0 (+1) | 1,965 (+12%) | 6mo | $210,000 | $107 | 39 |
| 1245 N Newsom | 0.61mi | 3/2.0 (+1) | 1,818 (+4%) | 18mo | $197,000 | $108 | 36 |
| 504 Meadowbrook St | 0.50mi | 3/2.0 (+1) | 1,955 (+12%) | 20mo | $255,000 | $130 | 27 |
Match score weights: distance 35% · size 25% · config 20% · recency 20%. Top-matched comps best support the ARV.
Projected returns pro-forma
-3.0% appreciation · 3.0% rent growth · sell at horizon
- IRR
- 10.9%
- Equity multiple
- 1.43×
- Total profit
- $10,928
- Equity at exit
- $13,419
- IRR
- 20.1%
- Equity multiple
- 2.69×
- Total profit
- $42,685
- Equity at exit
- $7,782
Cash invested: $25,200 (down + closing). Projections, not guarantees.
Landlord ↔ Tenant lean methodology
- Overall (STATE)
- 87 Strongly Landlord-Friendly
- State Texas
- 87 Strongly Landlord-Friendly · R+5
- County
- — inherits STATE
- City
- — inherits STATE
ZIP-level market 75773
- Home prices YoY
- -8.9%
- Active inventory
- 261
- Price-to-rent
- 5.1×
Monthly cashflow live
- Estimated rent
- $1,482 medium interval (Pro) →
- Mortgage (P&I)
- −$472
- Tax from tax record
- −$263 /mo · $3,151/yr
- Insurance
- −$38
- HOA
- −$0
- Vacancy / Maint / Mgmt
- −$311
- Net cashflow
- $399
Break-even live
UW: 25.0% down · 7.5% · 30yr · 1.5% tax · 5.0% vac · 8.0% maint · 8.0% mgmt
Financing live
Cash to close
- Down payment
- $22,500
- Closing costs
- $2,700
- Reserves months
- —
- Total cash needed
- —
Loan-product check · same deal, 3 products live
Conventional
25% down · 7.5% · 30yr
- Down + closing
- —
- Monthly P&I
- —
- Monthly cashflow
- —
- DSCR
- —
- Eligible?
- —
Personal DTI + credit; lowest rate.
DSCR
20% down · 8.5% · 30yr
- Down + closing
- —
- Monthly P&I
- —
- Monthly cashflow
- —
- DSCR
- —
- Eligible?
- —
No personal income docs; deal must DSCR.
Hard money
10% down · 12.0% · 12mo
- Down + closing
- —
- Monthly P&I
- —
- Monthly cashflow
- —
- DSCR
- —
- Eligible?
- —
Short-term bridge; refi at stabilization.
Rent comps 3 comps
| Address | Beds | Baths | Sqft | Rent | $/sqft | DOM | Units | Dist |
|---|---|---|---|---|---|---|---|---|
| 115 Isabella St Mineola, TX | 3.0 | 2.0 | 1085 | $1,350 | $1.24 | 21d | 1 | 0.50mi |
| 806 N Newsom St Mineola, TX | 3.0 | 2.5 | 1488 | $1,750 | $1.18 | 44d | 1 | 1.08mi |
| 803 Second St Mineola, TX | 3.0 | 1.0 | 1160 | $1,400 | $1.21 | 13d | 1 | 1.19mi |
Listing history 19 events
-
2026-06-19days on market $90,000 Active 111 DOM
-
2026-06-18days on market $90,000 Active 110 DOM
-
2026-06-17days on market $90,000 Active 109 DOM
-
2026-06-16days on market $90,000 Active 108 DOM
-
2026-06-15days on market $90,000 Active 107 DOM
-
2026-06-14days on market $90,000 Active 105 DOM
-
2026-06-13days on market $90,000 Active 104 DOM
-
2026-06-10days on market $90,000 Active 102 DOM
-
2026-06-09days on market $90,000 Active 101 DOM
-
2026-06-08days on market $90,000 Active 100 DOM
-
2026-06-07days on market $90,000 Active 99 DOM
-
2026-06-02days on market $90,000 Active 94 DOM
-
2026-06-01days on market $90,000 Active 93 DOM
-
2026-05-31days on market $90,000 Active 92 DOM
-
2026-05-30days on market $90,000 Active 91 DOM
-
2026-04-10price $97,500 461-char remark
Show marketing remark (461 chars)
Dont miss out on this prime opportunity in Mineola! Located on a quiet street in a great neighborhood, this 2 bed, 1 bath home sits on a beautiful oversized lot with plenty of room to expand or customize. Originally converted from a shop, it offers a unique layout and tons of potential to make it your own. AI-enhanced photos are included to showcase possible finishes and design ideas. A rare chance to create something special in a highly desirable location!
-
2026-03-11price $100,000 461-char remark
Show marketing remark (461 chars)
Dont miss out on this prime opportunity in Mineola! Located on a quiet street in a great neighborhood, this 2 bed, 1 bath home sits on a beautiful oversized lot with plenty of room to expand or customize. Originally converted from a shop, it offers a unique layout and tons of potential to make it your own. AI-enhanced photos are included to showcase possible finishes and design ideas. A rare chance to create something special in a highly desirable location!
-
2026-02-28$120,000 Active 461-char remark
Show marketing remark (461 chars)
Dont miss out on this prime opportunity in Mineola! Located on a quiet street in a great neighborhood, this 2 bed, 1 bath home sits on a beautiful oversized lot with plenty of room to expand or customize. Originally converted from a shop, it offers a unique layout and tons of potential to make it your own. AI-enhanced photos are included to showcase possible finishes and design ideas. A rare chance to create something special in a highly desirable location!
-
2022-05-09soldstatus
ⓘ Source: listings_history table (triggers on properties + properties_extension) + one-shot
backfill from property_details.listing_events for pre-trigger history.
Tax reassessment forecast TX · Resets to sale price
- Current annual tax
- $3,151 · $263/mo
- Projected year-2 tax
- $3,151 · $263/mo
- Expected delta
- $0/yr ($0/mo · 0.0%)
ⓘ Screening estimate from a state-policy table — verify with the county assessor before closing.
Climate risk First Street
- Flood 1/10 Low FEMA zone X (unshaded) · 0% chance over 30 yrs
- Wildfire 4/10 Moderate
- Heat 7/10 Severe 7 d/yr ≥110°F today · 26 d/yr by 30 yrs out
- Wind 6/10 Major 48% chance of damaging wind over 30 yrs
- Air quality 2/10 Low 1 unhealthy d/yr today · 1 by 30 yrs out
Nearby sold comps map
Loading sold comps map…
Walkable amenities ~0.75 mi
Loading nearby amenities…
Taxation est. · year 1
- Rental income
- $17,784
- − Mortgage interest
- −$5,041
- − Property taxes
- −$3,151
- − Insurance
- −$450
- − Repairs & maintenance
- −$1,423
- − Management
- −$1,423
- − Depreciation
- −$2,618
- Taxable income
- $3,678
- Est. tax owed @ 24.0%
- −$883
- After-tax cash flow
- $3,902/yr
For passive investors: Depreciation is non-cash, so a rental often shows a tax loss while cash-flowing — sheltering income. Rental losses are passive: they offset passive income freely, and up to $25,000/yr can offset ordinary (W-2) income if you actively participate and your MAGI is under $100k (phasing out to $0 by $150k); unused losses carry forward. On sale, claimed depreciation is recaptured at up to 25%, and gains may owe capital-gains tax (a 1031 exchange can defer both). Figures are a year-1 estimate at your 24.0% rate — not tax advice; consult a CPA.
Schools (NCES district)
- District
- Mineola ISD
- NCES district ID
- 4830930
- Math proficiency
- 54% ▲ 12.00%
- Reading proficiency
- 46% ▲ 4.00%
- Median HH income
- $44,121
- Composite
- 42.27/100
- National rank
- #3274
- State rank
- #190 of 826 in TX
Livability — Mineola
- Score
- 69/100
- State rank
- #392
- US rank
- #8222
Category grades
Schools grade is shown separately in the Schools card above.
Census & demographics
- Population (ZIP)
- 14,311
Population outlook (Wood County) Hauer SSP2
- Today (2025)
- 46,480 people
- By 2030
- 47,796 · +2.8%
- By 2040
- 50,142 · +7.9%
- By 2050
- 52,122 · +12.1%
- By 2075
- 57,033 · +22.7%
- By 2100
- 56,418 · +21.4%
Race, ethnicity, and origin ACS 2023
- Neighborhood character
- Predominantly White (79%)
- Race & ethnicity
- White 79% Hispanic / Latino 14% Two or more races 8% Black 4%
- Hispanic origin (detail)
- Mexican 10%
- Common ancestry
- Lithuanian 2% Slovak 2% Serbian 1%
- Foreign-born
- 4% · Canada
- Languages at home
- 91% English-only · Spanish 7% German/W. Germanic 1%
Political lean MEDSL · Wood
- 2024 margin
- Solid R (+69.7) · D 14.8% · R 84.6%
- 2008→2024 swing
- -15.5pp toward R · 2008: -54.2pp · 2024: -69.7pp
- All cycles
- 2024: R+69.7 2020: R+68.2 2016: R+70.0 2012: R+64.2 2008: R+54.2
Not yet ingested
- Civics
- —
Market trends
- HPI YoY
- ▼ -22.31%
- Current HPI
- 227.0529
- Rent YoY
- —
- Metro
- —
- State GDP YoY
- ▲ 3.95%
- F500 in state
- 110
Industry mix (Fortune 500 HQ in TX)
| Industry | F500 HQs | Revenue |
|---|---|---|
| Energy | 16 | $1,198B |
|
||
| Technology | 5 | $198B |
|
||
| Engineering / Construction | 4 | $72B |
|
||
| Energy Services | 3 | $60B |
|
||
| Utilities | 3 | $41B |
|
||
| Healthcare | 2 | $330B |
|
||
Price history
-18.8% since first listed4 events — show timeline
- 2026-04-10 Price Changed $97,500 GTAR
- 2026-03-11 Price Changed $100,000 GTAR
- 2026-02-28 Listed $120,000 GTAR
- 2022-05-09 Sold (Public Records) — Public Records
Property tax history
+17.0%/yrLatest (2025): $3,151 · +6.6% YoY. Source: county tax records.
Cash-flow waterfall
monthlySold comps — $/sqft
last 12 mo · ≤1 miLoading sold comps…