 🏷️ Likely Rental
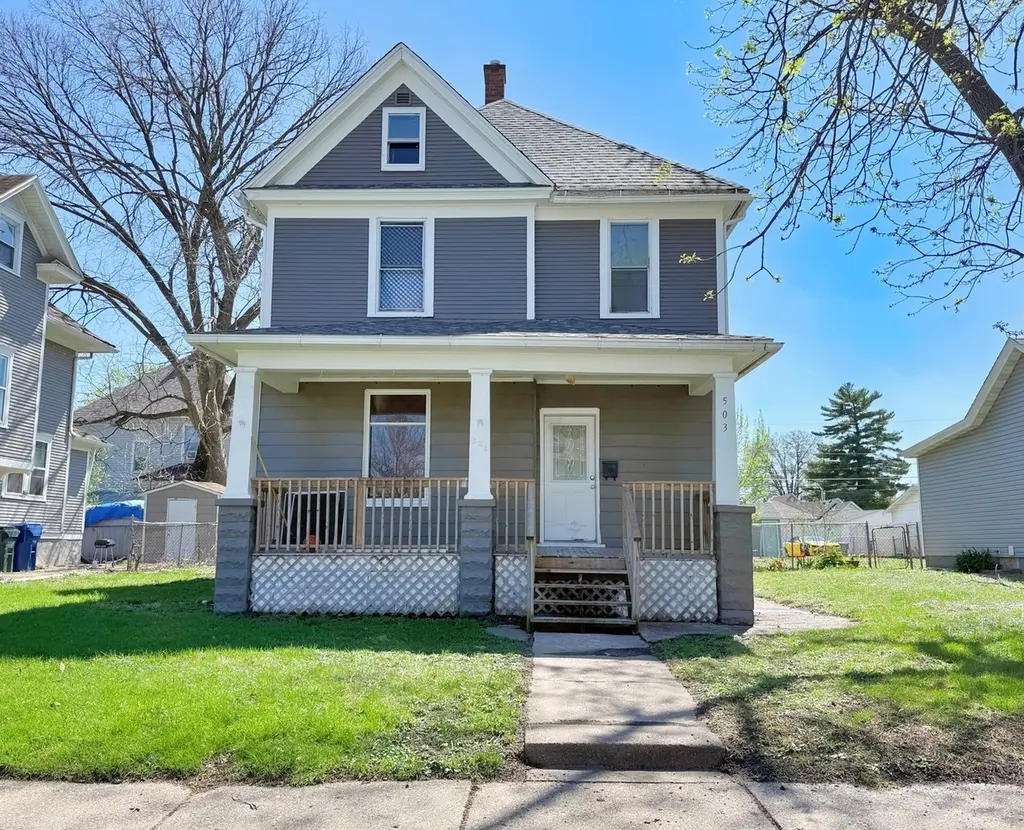
503 W 17th St · Davenport, IA
Flood risk 1/10 · Minimal
- FEMA flood zone
- X (unshaded)
- Chance of flooding over 30 yrs
- 0.0%
- Est. flood insurance / yr
- $473 – $860
Fire risk 1/10 · Minimal
- Est. fire insurance / yr
- $902 – $1,676
Heat risk 3/10 · Minor
- Hot days now (above 103°F)
- 7 days/yr
- Hot days in 30 yrs
- 16 days/yr
Wind risk 2/10 · Minimal
- Chance of severe wind over 30 yrs
- —
Air-quality risk 3/10 · Minor
- Unhealthy air days now
- 2 days/yr
- Unhealthy air days in 30 yrs
- 3 days/yr
Risk factors via First Street. Map © Google.
Why this score? — see what drove the C- grade
The composite is a weighted blend of 9 inputs, each scored 0–100. Each bar is that input's sub-score; the figure is the points it added to the 100-point composite (weight × sub-score).
- Cash flow +16.2/30.0
- ARV discount +15.0/15.0
- DSCR +5.0/10.0
- 1% rule +4.6/10.0
- Livability +4.0/5.0
- Schools +3.9/10.0
- Rent growth +3.6/5.0
- Condition / age +2.5/5.0
- Appreciation +0.0/10.0
$129,900
🖨 Deal sheet 📄 Offer letter ✓ Due diligence
Listing remarks
3-bedroom, 1 full bath home with tenant in place-great investment opportunity. Features a large eat-in kitchen and a spacious fenced backyard with patio, ideal for outdoor enjoyment. Recent updates include a new roof (2023), full interior paint (2024), exterior paint (2025), and new sewer lateral (2025). Additional walk-up attic provides convenient storage. Functional layout with comfortable living spaces. A solid addition to any rental portfolio. Interior pictures taken prior to tenant moving in.
Key facts
- Exterior paint
- Large eat-in kitchen
- Patio
Tags
Property features AI
Finance
- HOA & community: No master association fee required
Exterior
- Parking: Detached garage (1 garage space; 1 total parking space)
- Utilities: Public water; Public sewer
- Home design: Detached single-family home; Two-story layout; Approximately 1,491 total finished square feet; Upper finished area of about 728
- Construction: Wood siding exterior; Block foundation; Asphalt roof; Property over 100 years old; Built before 1978
- Exterior features: Fenced yard; Level lot (approximately 50 x 150)
Interior
- Kitchen: Kitchen with eating area/table space (14 x 13); Range, Refrigerator
- Bedrooms: Three bedrooms (master and two additional bedrooms on the second floor); Bedroom dimensions: 11 x 13 (master), 9 x 13, 8 x 13
- Flooring: Carpet in most living areas and bedrooms; Luxury vinyl flooring in the kitchen
- Bathrooms: One full bathroom
- Heating & cooling: Natural gas heating; Central air conditioning
- Interior features: Six total rooms; Full, unfinished basement
- Laundry & utility: Laundry room
Neighborhood map
What this means for you Summary
Snapshot
- This is a 3-bed/1.5-bath single-family listed at $130k.
Deal economics
- At list price, monthly cash flow is $68 ($814/yr) — positive.
- The deal already cash-flows at list — no discount required.
- To meet the 1% rule (rent ≥ 1% of price), the offer needs to be $125k (4.1% below list).
- Recommended offer: $125k (4.1% below list) — sets the bar for 1% rule.
- Cap rate 6.9% vs local median 4.4% in Davenport — top-decile yield for the area; either an underpriced asset or a hidden risk that comps aren't pricing in. Stress-test before assuming the spread holds.
Location & tenants
- Location reads 79/100 on livability (#126 in IA, #2,312 nationally) — a middle-class / working-renter tenant base. Strengths: cost of living A+, housing A+, health & safety A+; Watch: employment C-, crime F.
- Davenport Community School District (urban): math 43% / reading 50% proficiency, ranked #288 of 289 in IA (top 100%) — families likely to look elsewhere, expect single-tenant / working-renter base with shorter leases.
- Market conditions: Rents rising fast (+4.6%/yr); 160 active listings in the ZIP; 40 comparable units currently listed for rent nearby; rentals lingering (median 44d on market — plan ~5-8 weeks vacancy on turnover, expect pricing pressure); 62% of comp listings sitting > 30 days — soft ceiling on asking rent; 805 units permitted in Scott County in 2024 (479 in 5+ unit buildings).
Forward outlook
- Local home prices are declining (-3.0%/yr); year-one equity from $898 of loan paydown is wiped out by about $4k of value loss. Plan a longer hold.
- Scott County population projected at +19% by 2050 — long-run rental-demand tailwind backs the buy-and-hold thesis.
Negotiation context
- Only 8 days on market — expect competitive offers; lowballing is unlikely to land.
- 14 sale attempts since 20y ago; this cycle's ask is 9179% above the opening price — seller raised mid-cycle; expect resistance to lowballs.
- Current owner paid $108k; 20% above their basis — modest negotiation headroom, anchor on the comps not their cost.
Risks & watch-outs
- Watch-outs: built in 1900 — expect roof / HVAC / electrical / plumbing capex.
Questions for the listing agent
- Built in 1900 — when were the roof, HVAC, electrical panel, plumbing, and water heater last replaced?
- Is there a deadline driving the sale (1031 exchange, divorce, estate, relocation)? That informs how much negotiation room exists.
- Crime grade is F in this area — have there been break-ins, vandalism, or insurance claims at this property in the last 3 years? What carrier currently insures it and at what premium?
- What's the average days-on-market for RENTAL listings here right now (not sales)? A rising rental-DOM trend means longer vacancies and softer asking-rent achievability than the comps imply.
- What's the recent tenant-quality profile in this submarket — average credit score on applications, eviction rate, late-payment / NSF rate, and stable-employment percentage? A property-management company in the area should have these aggregated.
- How much new for-sale + rental construction is in the pipeline within 1–3 miles? Heavy new supply typically softens prices + rents 12–24 months out; constrained supply supports both.
Investment metrics
- 1% rule
- 0.96% ✗
- Cap rate
- 6.92%
- Cash-on-cash
- 2.24%
- DSCR
- 1.10
- GRM
- 8.7
CMA / ARV
- ARV (median comp)
- $188,369
- List price
- $129,900
- Delta
- -31.04%
- Verdict
- UNDERPRICED
- Comps
- 20 within 1.0 mi
Show comp detail 12 sales within ~0.75 mi
| Address | Dist | Beds/Ba | Sqft | Sold | Price | $/sf | Match |
|---|---|---|---|---|---|---|---|
| 2211 Western Ave | 0.36mi | 3/2.0 | 1,484 (-0%) | 3mo | $175,000 | $118 | 78 |
| 734 W 17th St | 0.22mi | 3/1.0 | 1,389 (-7%) | 2mo | $138,000 | $99 | 75 |
| 727 W 11th St | 0.48mi | 3/1.0 | 1,428 (-4%) | 1mo | $65,000 | $46 | 68 |
| 911 W 16th St | 0.33mi | 3/1.0 | 1,356 (-9%) | 1mo | $152,000 | $112 | 66 |
| 2718 Western Ave | 0.70mi | 3/1.5 | 1,539 (+3%) | 2mo | $199,900 | $130 | 60 |
| 2627 Fair Ave | 0.75mi | 3/1.5 | 1,447 (-3%) | 0mo | $168,000 | $116 | 60 |
| 1527 N Marquette St | 0.57mi | 4/1.5 (+1) | 1,558 (+4%) | 1mo | $80,444 | $52 | 60 |
| 1127 N Ripley St St | 0.37mi | 4/1.0 (+1) | 1,660 (+11%) | 3mo | $93,000 | $56 | 54 |
| 1121 W 15th St | 0.52mi | 3/1.5 | 1,699 (+14%) | 1mo | $129,000 | $76 | 52 |
| 2323 Frances Pl | 0.59mi | 3/2.0 | 1,293 (-13%) | 1mo | $240,000 | $186 | 48 |
| 1324 Marquette St | 0.65mi | 3/2.0 | 1,302 (-13%) | 1mo | $115,000 | $88 | 46 |
| 402 E Pleasant St | 0.59mi | 4/1.0 (+1) | 1,300 (-13%) | 0mo | $140,000 | $108 | 44 |
Match score weights: distance 35% · size 25% · config 20% · recency 20%. Top-matched comps best support the ARV.
Projected returns pro-forma
-3.0% appreciation · 4.57% rent growth · sell at horizon
- IRR
- -10.9%
- Equity multiple
- 0.60×
- Total profit
- $-14,698
- Equity at exit
- $19,369
- IRR
- 0.5%
- Equity multiple
- 1.04×
- Total profit
- $1,361
- Equity at exit
- $11,231
Cash invested: $36,372 (down + closing). Projections, not guarantees.
Landlord ↔ Tenant lean methodology
- Overall (STATE)
- 83 Strongly Landlord-Friendly
- State Iowa
- 83 Strongly Landlord-Friendly · R+6
- County
- — inherits STATE
- City
- — inherits STATE
ZIP-level market 52803
- Home prices YoY
- -34.5%
- Rents YoY
- 4.6%
- Active inventory
- 160
- Price-to-rent
- 8.7×
Monthly cashflow live
- Estimated rent
- $1,246 high interval (Pro) →
- Mortgage (P&I)
- −$681
- Tax from tax record
- −$181 /mo · $2,177/yr
- Insurance
- −$54
- HOA
- −$0
- Vacancy / Maint / Mgmt
- −$262
- Net cashflow
- $68
Break-even live
UW: 25.0% down · 7.5% · 30yr · 1.5% tax · 5.0% vac · 8.0% maint · 8.0% mgmt
Financing live
Cash to close
- Down payment
- $32,475
- Closing costs
- $3,897
- Reserves months
- —
- Total cash needed
- —
Loan-product check · same deal, 3 products live
Conventional
25% down · 7.5% · 30yr
- Down + closing
- —
- Monthly P&I
- —
- Monthly cashflow
- —
- DSCR
- —
- Eligible?
- —
Personal DTI + credit; lowest rate.
DSCR
20% down · 8.5% · 30yr
- Down + closing
- —
- Monthly P&I
- —
- Monthly cashflow
- —
- DSCR
- —
- Eligible?
- —
No personal income docs; deal must DSCR.
Hard money
10% down · 12.0% · 12mo
- Down + closing
- —
- Monthly P&I
- —
- Monthly cashflow
- —
- DSCR
- —
- Eligible?
- —
Short-term bridge; refi at stabilization.
Rent comps 40 comps
| Address | Beds | Baths | Sqft | Rent | $/sqft | DOM | Units | Dist |
|---|---|---|---|---|---|---|---|---|
| 1615 1/2 N Ripley St Davenport, IA | 2.0 | 1.0 | 900 | $825 | $0.92 | 43d | 1 | 0.10mi |
| 537 W 16th St Davenport, IA | 3.0 | 1.0 | 1311 | $1,400 | $1.07 | 43d | 1 | 0.10mi |
| 1519 N Ripley St Davenport, IA | 2.0 | 1.0 | 1144 | $1,100 | $0.96 | 13d | 1 | 0.12mi |
| 1511 N Ripley St Davenport, IA | 4.0 | 2.0 | 1872 | $1,450 | $0.77 | 20d | 1 | 0.14mi |
| 621 W 15th St Davenport, IA | 4.0 | 2.0 | 1833 | $1,500 | $0.82 | 13d | 1 | 0.19mi |
| 1323 N Gaines St Davenport, IA | 4.0 | 2.0 | 1733 | $1,350 | $0.78 | 20d | 1 | 0.26mi |
| 1421 N Main St #2 Davenport, IA | 3.0 | 1.0 | 1350 | $1,095 | $0.81 | 43d | 1 | 0.30mi |
| 1315 Brown St Unit 2 Davenport, IA | 3.0 | 1.0 | 1300 | $1,250 | $0.96 | 20d | 1 | 0.32mi |
| 1318 1/2 Brown St Davenport, IA | 2.0 | 1.0 | 900 | $875 | $0.97 | 20d | 1 | 0.33mi |
| 201 E Locust St Unit Sw Davenport, IA | 2.0 | 1.0 | 1000 | $875 | $0.88 | 43d | 1 | 0.40mi |
| 915 W 14th St Davenport, IA | 3.0 | 1.0 | 1390 | $900 | $0.65 | 43d | 1 | 0.40mi |
| 1812 Pershing Ave Unit 1 Davenport, IA | 3.0 | 1.0 | 1000 | $1,200 | $1.20 | 20d | 1 | 0.45mi |
| 119 E 13th St Davenport, IA | 3.0 | 1.0 | 1728 | $1,495 | $0.87 | 43d | 1 | 0.45mi |
| 317 Kirkwood Blvd Davenport, IA | 2.0 | 1.0 | 1300 | $950 | $0.73 | 43d | 1 | 0.50mi |
| 2224 Iowa St Davenport, IA | 2.0 | 1.0 | 1214 | $895 | $0.74 | 43d | 1 | 0.62mi |
| 2224 Iowa St Unit 2224 Davenport, IA | 2.0 | 1.0 | 1214 | $925 | $0.76 | 43d | 1 | 0.62mi |
| 730 Brown St Unit 3 Davenport, IA | 2.0 | 1.0 | 1000 | $800 | $0.80 | 43d | 1 | 0.69mi |
| 2209 Farnam St Unit 2211 Davenport, IA | 3.0 | 1.0 | 1138 | $1,050 | $0.92 | 20d | 1 | 0.77mi |
| 1421 Grand Ave Unit 1 Davenport, IA | 2.0 | 1.0 | 1015 | $850 | $0.84 | 43d | 1 | 0.81mi |
| 2809 N Main St Davenport, IA | 3.0 | 1.5 | 1000 | $1,350 | $1.35 | 20d | 1 | 0.86mi |
| 321 E 7th St Davenport, IA | 1.0–2.0 | 1.0 | 825 | $1,050 | $1.27 | 13d | 4 | 0.91mi |
| 1455 W 12th St Davenport, IA | 3.0 | 1.0 | 942 | $1,095 | $1.16 | 13d | 1 | 0.92mi |
| 427 N Brady St Unit 6 Davenport, IA | 2.0 | 1.0 | 916 | $995 | $1.09 | 43d | 1 | 0.94mi |
| 427 N Brady St Unit 1 Davenport, IA | 3.0 | 1.5 | 1126 | $1,359 | $1.21 | 43d | 1 | 0.94mi |
| 511 Pershing Ave Unit 102W Davenport, IA | 2.0 | 1.0 | 1173 | $1,506 | $1.28 | 43d | 1 | 0.96mi |
| 511 Pershing Ave Unit 402W Davenport, IA | 2.0 | 2.0 | 1106 | $1,478 | $1.34 | 43d | 1 | 0.96mi |
| 511 Pershing Ave Unit 105E Davenport, IA | 2.0 | 2.0 | 1100 | $1,635 | $1.49 | 43d | 1 | 0.96mi |
| 511 Pershing Ave Unit 106E Davenport, IA | 3.0 | 2.0 | 1349 | $1,996 | $1.48 | 43d | 1 | 0.96mi |
| 511 Pershing Ave Apt 602W Davenport, IA | 2.0 | 2.0 | 948 | $1,367 | $1.44 | 43d | 1 | 0.96mi |
| 511 Pershing Ave Unit 301E Davenport, IA | 3.0 | 2.0 | 1429 | $2,126 | $1.49 | 43d | 1 | 0.96mi |
| 511 Pershing Ave Unit 407W Davenport, IA | 2.0 | 2.0 | 1175 | $1,568 | $1.33 | 43d | 1 | 0.96mi |
| 511 Pershing Ave Unit 101W Davenport, IA | 2.0 | 1.0 | 1280 | $1,704 | $1.33 | 43d | 1 | 0.96mi |
| 511 Pershing Ave Unit 202W Davenport, IA | 2.0 | 1.0 | 1201 | $1,601 | $1.33 | 43d | 1 | 0.96mi |
| 511 Pershing Ave Unit 609W Davenport, IA | 2.0 | 1.0 | 912 | $1,317 | $1.44 | 43d | 1 | 0.96mi |
| 1301 Arlington Ave Unit 1305 Davenport, IA | 2.0 | 1.0 | 900 | $895 | $0.99 | 13d | 1 | 0.96mi |
| 401 Brady St Davenport, IA | 1.0–3.0 | 1.0–2.0 | 870 | $2,100 | $2.41 | 13d | 2 | 0.97mi |
| 2925 Dubuque St Unit 5N Davenport, IA | 2.0 | 2.0 | 895 | $825 | $0.92 | 13d | 1 | 0.99mi |
| 427 Pershing Ave Davenport, IA | 3.0 | 2.0 | 1438 | $2,288 | $1.59 | 13d | 3 | 1.00mi |
| 320 E 29th St Davenport, IA | 2.0 | 2.5 | 1450 | $1,750 | $1.21 | 43d | 1 | 1.03mi |
| 616 E 6th St Davenport, IA | 4.0 | 1.0 | 1578 | $1,712 | $1.08 | 43d | 1 | 1.05mi |
Listing history 43 events
-
2026-06-18days on market $129,900 Active 8 DOM
-
2026-06-17days on market $129,900 Active 7 DOM
-
2026-06-16days on market $129,900 Active 6 DOM
-
2026-06-15days on market $129,900 Active 5 DOM
-
2026-06-14days on market $129,900 Active 3 DOM
-
2026-06-13days on market $129,900 Active 2 DOM
-
2026-06-09days on market $129,900 Active 52 DOM
-
2026-06-09price $129,900 Active 51 DOM
-
2026-06-08days on market $135,000 Active 51 DOM
-
2026-06-07days on market $135,000 Active 50 DOM
-
2026-06-03days on market $135,000 Active 46 DOM
-
2026-06-02days on market $135,000 Active 45 DOM
-
2026-06-01days on market $135,000 Active 44 DOM
-
2026-05-31days on market $135,000 Active 43 DOM
-
2026-05-30days on market $135,000 Active 42 DOM
-
2026-04-18$135,000 Active 502-char remark
-
2026-02-17status Pending
-
2026-02-16historical
-
2026-01-14status Active
-
2026-01-14price
-
2026-01-14historical
-
2026-01-08status Active
-
2026-01-06historical
-
2026-01-05historical
-
2025-12-18historical
-
2025-12-03historical $1,395
-
2025-10-31Active
-
2025-10-15$1,395
-
2025-06-30historical
-
2024-07-24historical $1,300
-
2024-06-13$1,300
-
2018-07-02soldstatus $108,000
-
2018-07-02soldstatus $108,000
-
2018-07-02$108,000
-
2018-07-02$108,000
-
2018-02-26soldstatus $24,000
-
2018-02-22soldstatus $24,000
-
2018-02-22soldstatus $24,000
-
2017-11-09$39,900
-
2017-11-09$39,900
-
2006-06-21soldstatus $27,000
-
2006-06-14soldstatus $27,000
-
2006-02-17$29,900
ⓘ Source: listings_history table (triggers on properties + properties_extension) + one-shot
backfill from property_details.listing_events for pre-trigger history.
Tax reassessment forecast IA · Partial reset (capped growth)
- Current annual tax
- $2,177 · $181/mo
- Projected year-2 tax
- $2,177 · $181/mo
- Expected delta
- $0/yr ($0/mo · 0.0%)
ⓘ Screening estimate from a state-policy table — verify with the county assessor before closing.
Climate risk First Street
- Flood 1/10 Low FEMA zone X (unshaded) · 0% chance over 30 yrs
- Wildfire 1/10 Low
- Heat 3/10 Moderate 7 d/yr ≥103°F today · 16 d/yr by 30 yrs out
- Wind 2/10 Low
- Air quality 3/10 Moderate 2 unhealthy d/yr today · 3 by 30 yrs out
Nearby sold comps map
Loading sold comps map…
Walkable amenities ~0.75 mi
Loading nearby amenities…
Taxation est. · year 1
- Rental income
- $14,956
- − Mortgage interest
- −$7,276
- − Property taxes
- −$2,177
- − Insurance
- −$650
- − Repairs & maintenance
- −$1,196
- − Management
- −$1,196
- − Depreciation
- −$3,779
- Taxable loss
- −$1,319
- Est. tax savings @ 24.0%
- +$317
- After-tax cash flow
- $1,131/yr
For passive investors: Depreciation is non-cash, so a rental often shows a tax loss while cash-flowing — sheltering income. Rental losses are passive: they offset passive income freely, and up to $25,000/yr can offset ordinary (W-2) income if you actively participate and your MAGI is under $100k (phasing out to $0 by $150k); unused losses carry forward. On sale, claimed depreciation is recaptured at up to 25%, and gains may owe capital-gains tax (a 1031 exchange can defer both). Figures are a year-1 estimate at your 24.0% rate — not tax advice; consult a CPA.
Schools (NCES district)
- District
- Davenport Community School District
- NCES district ID
- 1908580
- Math proficiency
- 43% ▼ -11.00%
- Reading proficiency
- 50% ▼ -3.00%
- Median HH income
- $46,157
- Composite
- 39.49/100
- National rank
- #3951
- State rank
- #288 of 289 in IA
Livability — Davenport
- Score
- 79/100
- State rank
- #126
- US rank
- #2312
Category grades
Schools grade is shown separately in the Schools card above.
Census & demographics
- Census place
- Davenport, IA
- County
- Scott County · 144,583 people
- City population
- 103,319
- Metro
- Davenport-Moline-Rock Island, IA-IL
- Population (ZIP)
- 22,742
- Household income
- $64,543
- Rent vs Own
- Severe rent burden
- 630.0
Population outlook (Scott County) Hauer SSP2
- Today (2025)
- 188,878 people
- By 2030
- 196,648 · +4.1%
- By 2040
- 210,860 · +11.6%
- By 2050
- 224,359 · +18.8%
- By 2075
- 258,884 · +37.1%
- By 2100
- 286,447 · +51.7%
Race, ethnicity, and origin ACS 2023
- Neighborhood character
- Predominantly White (69%)
- Race & ethnicity
- White 69% Black 14% Two or more races 10% Hispanic / Latino 9%
- Hispanic origin (detail)
- Mexican 7%
- Common ancestry
- Romanian 2% Portuguese 2% Iranian 2%
- Foreign-born
- 5% · Canada, United Kingdom, South Korea
- Languages at home
- 93% English-only · Spanish 4% French/Haitian/Cajun 1%
Political lean MEDSL · Scott
- 2024 margin
- Toss-up / Even · D 47.3% · R 51.2% · Other 1.4%
- 2008→2024 swing
- -18.4pp toward R · 2008: 14.6pp · 2024: -3.9pp
- All cycles
- 2024: R+3.9 2020: D+3.5 2016: D+1.4 2012: D+13.8 2008: D+14.6
Not yet ingested
- Civics
- —
Market trends
- HPI YoY
- ▼ -96.00%
- Current HPI
- 182.0976
- Rent YoY
- ▲ 4.57%
- Metro
- Davenport-Moline-Rock Island, IA-IL
- State GDP YoY
- ▲ 2.48%
- F500 in state
- 4
Industry mix (Fortune 500 HQ in IA)
| Industry | F500 HQs | Revenue |
|---|---|---|
| Financial Services | 1 | $16B |
|
||
| Retail / Convenience | 1 | $15B |
|
||
Price history
-95.3% since first listed34 events — show timeline
- 2026-06-11 Listed for Rent $1,400 APPFOLIO
- 2026-06-10 Listed $129,900 MRED as Distributed by MLS Grid
- 2026-06-09 Listing Removed — MRED as Distributed by MLS Grid
- 2026-06-08 Price Changed — MRED as Distributed by MLS Grid
- 2026-05-23 Listing Removed — MRED as Distributed by MLS Grid
- 2026-05-22 Relisted — MRED as Distributed by MLS Grid
- 2026-04-18 Listed — MRED as Distributed by MLS Grid
- 2026-02-17 Pending — MRED as Distributed by MLS Grid
- 2026-02-16 Listing Removed — MRED as Distributed by MLS Grid
- 2026-01-14 Relisted — MRED as Distributed by MLS Grid
- 2026-01-14 Price Changed — MRED as Distributed by MLS Grid
- 2026-01-14 Listing Removed — MRED as Distributed by MLS Grid
- 2026-01-08 Relisted — MRED as Distributed by MLS Grid
- 2026-01-06 Listing Removed — RMLSA as Distributed by MLS Grid
- 2026-01-05 Listing Removed — MRED as Distributed by MLS Grid
- 2025-12-18 Listing Removed — MRED as Distributed by MLS Grid
- 2025-12-03 Rental Removed $1,395 APPFOLIO
- 2025-10-31 Listed — RMLSA as Distributed by MLS Grid
- 2025-10-15 Listed for Rent $1,395 APPFOLIO
- 2025-06-30 Listing Removed — MRED as Distributed by MLS Grid
- 2024-07-24 Rental Removed $1,300 APPFOLIO
- 2024-06-13 Listed for Rent $1,300 APPFOLIO
- 2018-07-02 Listed $108,000 MRED as Distributed by MLS Grid
- 2018-07-02 Listed $108,000 RMLSA as Distributed by MLS Grid
- 2018-07-02 Sold (MLS) $108,000 MRED as Distributed by MLS Grid
- 2018-07-02 Sold (MLS) $108,000 RMLSA as Distributed by MLS Grid
- 2018-02-26 Sold (Public Records) $24,000 Public Records
- 2018-02-22 Sold (MLS) $24,000 RMLSA as Distributed by MLS Grid
- 2018-02-22 Sold (MLS) $24,000 MRED as Distributed by MLS Grid
- 2017-11-09 Listed $39,900 RMLSA as Distributed by MLS Grid
- 2017-11-09 Listed $39,900 MRED as Distributed by MLS Grid
- 2006-06-21 Sold (Public Records) $27,000 Public Records
- 2006-06-14 Sold (MLS) $27,000 RMLSA as Distributed by MLS Grid
- 2006-02-17 Listed $29,900 RMLSA as Distributed by MLS Grid
Property tax history
+7.1%/yrLatest (2025): $2,177 · +6.7% YoY. Source: county tax records.
Cash-flow waterfall
monthlySold comps — $/sqft
last 12 mo · ≤1 miLoading sold comps…