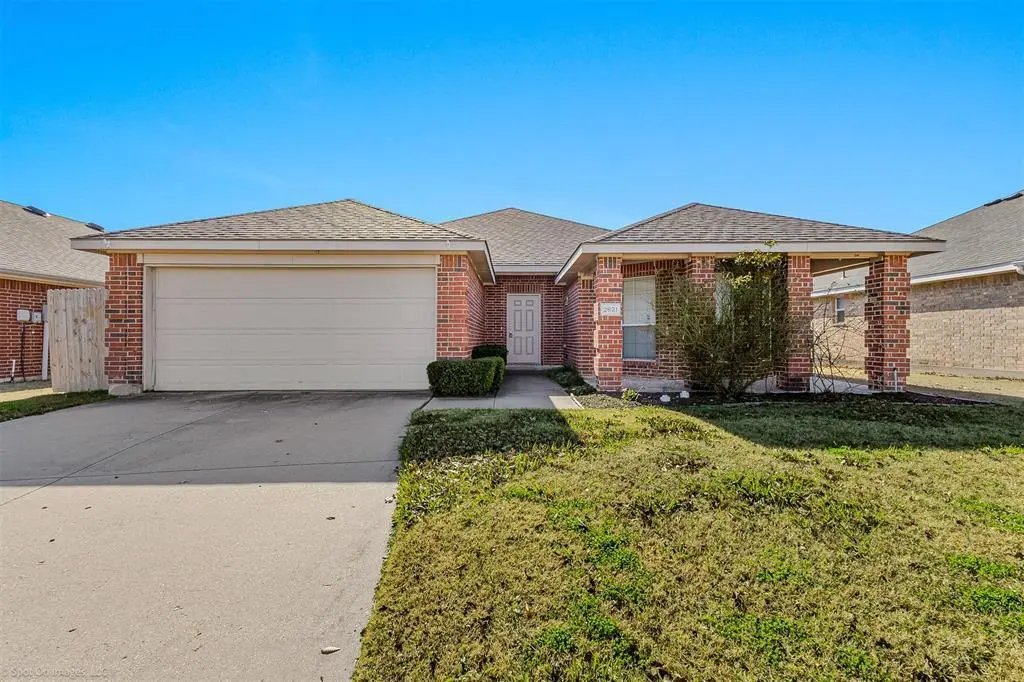
2821 Mockingbird St · Royse City, TX
Flood risk 1/10 · Minimal
- FEMA flood zone
- X (unshaded)
- Chance of flooding over 30 yrs
- 0.0%
- Est. flood insurance / yr
- $507 – $1,088
Fire risk 5/10 · Moderate
- Est. fire insurance / yr
- $1,222 – $2,270
Heat risk 8/10 · Major
- Hot days now (above 110°F)
- 7 days/yr
- Hot days in 30 yrs
- 25 days/yr
Wind risk 6/10 · Moderate
- Chance of severe wind over 30 yrs
- 27.0%
Air-quality risk 2/10 · Minimal
- Unhealthy air days now
- 1 days/yr
- Unhealthy air days in 30 yrs
- 1 days/yr
Risk factors via First Street. Map © Google.
Why this score? — see what drove the D grade
The composite is a weighted blend of 9 inputs, each scored 0–100. Each bar is that input's sub-score; the figure is the points it added to the 100-point composite (weight × sub-score).
- ARV discount +13.2/15.0
- Cash flow +9.2/30.0
- 1% rule +3.9/10.0
- Schools +3.8/10.0
- Livability +3.8/5.0
- DSCR +2.6/10.0
- Condition / age +2.5/5.0
- Rent growth +2.2/5.0
- Appreciation +0.0/10.0
$249,950
🖨 Deal sheet 📄 Offer letter ✓ Due diligence
Listing remarks MLS
Spacious 3 Bedroom 2 bath home with an open floor plan. Large bedrooms. Master suite offers a walk in closet, Separate shower and garden tub. This home has just been upgraded with new carpet and luxury vinyl plank flooring, Fresh touch up on paint, new microwave installed, refrigerator, dishwasher, and electric stove range. Wood burning fireplace. 2 car garage. The back yard boasts a covered porch where you can relax and enjoy the fresh air in private setting. The back yard is fenced. This home is within walking distance to Fort Elementary school, just minutes from Royse City High School, and Interstate 30. The location is convenient to shopping, restaurants, and BUCCEES! Schedule your showing today!
Key facts
- Covered porch
- Open floor plan
- New carpet
Tags
Neighborhood map
What this means for you Summary
Snapshot
- This is a 3-bed/2.0-bath single-family listed at $250k.
Deal economics
- At list price, monthly cash flow is $-185 ($-2k/yr) — negative.
- To cash-flow at today's rent, offer at most $217k (13.1% below list).
- To meet the 1% rule (rent ≥ 1% of price), the offer needs to be $223k (10.6% below list).
- Recommended offer: $217k (13.1% below list) — sets the bar for cash-flow.
- Cap rate 5.4% vs local median 4.2% in Royse City — meaningfully above typical; check what's discounted (condition, days-on-market, listing class) to confirm the premium yield is real.
Location & tenants
- Location reads 75/100 on livability (#158 in TX, #4,292 nationally) — a middle-class / working-renter tenant base. Strengths: crime A+, employment A+, housing A+; Watch: schools C-, amenities F, commute F.
- Royse City ISD (rural): math 42% / reading 42% proficiency, ranked #266 of 826 in TX (top 32%) — families likely to look elsewhere, expect single-tenant / working-renter base with shorter leases.
- Market conditions: Rents soft (-1.1%/yr); 1288 active listings in the ZIP; 39 comparable units currently listed for rent nearby; rentals at typical pace (median 21d on market — plan ~3-4 weeks tenant-placement turnaround); high-income renter base; 1,810 units permitted in Rockwall County in 2024 (0 in 5+ unit buildings).
Forward outlook
- Local home prices are declining (-3.0%/yr); year-one equity from $2k of loan paydown is wiped out by about $7k of value loss. Plan a longer hold.
- Rockwall County population projected at +56% by 2050 — long-run rental-demand tailwind backs the buy-and-hold thesis.
Negotiation context
- It's been on market 145 days — a 12% lower offer ($220k) is reasonable based on typical stale-listing flexibility.
- 2 sale attempts with the ask held roughly flat each time — persistent listings suggest the price (not the market) is what's stuck; bring a comps-based counter.
Risks & watch-outs
- Climate carrying-cost: major wind risk, 27% chance of damaging wind over 30y; moderate wildfire risk; extreme-heat days projected 7→25/yr by 2055 (HVAC capex compounding) — expect insurance premiums to compound above CPI over the hold.
Questions for the listing agent
- What do current leases actually rent for vs. the listed asking? Can we see a recent rent roll and the last 12 months of T-12 income?
- It's been on market 145 days. Have you received any prior offers? Is the seller open to a 13% concession, seller financing, or rate buy-down credit?
- What does the HOA fee cover, when was the last increase, and are there any pending special assessments or reserve-fund shortfalls?
- Why hasn't it sold? Are there any deal-killer items the seller is aware of (foundation, flood, title, zoning, code violations)?
- Is there a deadline driving the sale (1031 exchange, divorce, estate, relocation)? That informs how much negotiation room exists.
- The area grade is low — what's the realistic commute time and amenity access for the typical tenant pool here? Any planned neighborhood developments (good or bad) we should know about?
- What's the average days-on-market for RENTAL listings here right now (not sales)? A rising rental-DOM trend means longer vacancies and softer asking-rent achievability than the comps imply.
- What's the recent tenant-quality profile in this submarket — average credit score on applications, eviction rate, late-payment / NSF rate, and stable-employment percentage? A property-management company in the area should have these aggregated.
- How much new for-sale + rental construction is in the pipeline within 1–3 miles? Heavy new supply typically softens prices + rents 12–24 months out; constrained supply supports both.
Investment metrics
- 1% rule
- 0.89% ✗
- Cap rate
- 5.40%
- Cash-on-cash
- -3.18%
- DSCR
- 0.86
- GRM
- 9.3
CMA / ARV
- ARV (median comp)
- $285,960
- List price
- $249,950
- Delta
- -12.59%
- Verdict
- UNDERPRICED
- Comps
- 20 within 1.0 mi
Show comp detail 12 sales within ~0.75 mi
| Address | Dist | Beds/Ba | Sqft | Sold | Price | $/sf | Match |
|---|---|---|---|---|---|---|---|
| 307 Lilac View Ln | 0.30mi | 4/2.0 (+1) | 1,830 (+1%) | 1mo | $305,000 | $167 | 78 |
| 319 Jasmine Dr | 0.47mi | 3/2.0 | 1,843 (+2%) | 1mo | $328,900 | $178 | 75 |
| 3000 Spruce St | 0.20mi | 3/2.0 | 1,628 (-10%) | 0mo | $265,000 | $163 | 73 |
| 3401 Oak Ln | 0.40mi | 3/2.0 | 1,894 (+4%) | 2mo | $314,900 | $166 | 73 |
| 3257 Mercer Dr | 0.63mi | 3/2.0 | 1,861 (+2%) | 2mo | $299,999 | $161 | 65 |
| 3233 Timineri Ln | 0.65mi | 3/2.0 | 1,880 (+4%) | 0mo | $299,999 | $160 | 63 |
| 3220 Overstreet Ln | 0.31mi | 4/2.0 (+1) | 2,046 (+13%) | 1mo | $288,000 | $141 | 59 |
| 4260 Anglers Way | 0.45mi | 3/2.0 | 2,063 (+14%) | 0mo | $369,990 | $179 | 56 |
| 3137 Honeycomb Way | 0.46mi | 4/2.0 (+1) | 2,003 (+10%) | 2mo | $294,999 | $147 | 55 |
| 5015 Strait Way | 0.55mi | 3/2.0 | 1,598 (-12%) | 1mo | $313,490 | $196 | 54 |
| 4022 Yellowstone Rd | 0.52mi | 3/2.0 | 2,063 (+14%) | 0mo | $379,990 | $184 | 53 |
| 252 Sunny Corner Rd | 0.54mi | 4/2.0 (+1) | 2,003 (+10%) | 1mo | $279,900 | $140 | 52 |
Match score weights: distance 35% · size 25% · config 20% · recency 20%. Top-matched comps best support the ARV.
Projected returns pro-forma
-3.0% appreciation · 0.0% rent growth · sell at horizon
- IRR
- -25.4%
- Equity multiple
- 0.16×
- Total profit
- $-58,686
- Equity at exit
- $37,268
- IRR
- -37.7%
- Equity multiple
- -0.30×
- Total profit
- $-90,916
- Equity at exit
- $21,611
Cash invested: $69,986 (down + closing). Projections, not guarantees.
Landlord ↔ Tenant lean methodology
- Overall (STATE)
- 87 Strongly Landlord-Friendly
- State Texas
- 87 Strongly Landlord-Friendly · R+5
- County
- — inherits STATE
- City
- — inherits STATE
ZIP-level market 75189
- Home prices YoY
- -25.0%
- Rents YoY
- -1.1%
- Active inventory
- 1288
- Price-to-rent
- 9.3×
Monthly cashflow live
- Estimated rent
- $2,234 high interval (Pro) →
- Mortgage (P&I)
- −$1,311
- Tax from tax record
- −$498 /mo · $5,971/yr
- Insurance
- −$104
- HOA
- −$38
- Vacancy / Maint / Mgmt
- −$469
- Net cashflow
- $-185
Break-even live
UW: 25.0% down · 7.5% · 30yr · 1.5% tax · 5.0% vac · 8.0% maint · 8.0% mgmt
Financing live
Cash to close
- Down payment
- $62,488
- Closing costs
- $7,498
- Reserves months
- —
- Total cash needed
- —
Loan-product check · same deal, 3 products live
Conventional
25% down · 7.5% · 30yr
- Down + closing
- —
- Monthly P&I
- —
- Monthly cashflow
- —
- DSCR
- —
- Eligible?
- —
Personal DTI + credit; lowest rate.
DSCR
20% down · 8.5% · 30yr
- Down + closing
- —
- Monthly P&I
- —
- Monthly cashflow
- —
- DSCR
- —
- Eligible?
- —
No personal income docs; deal must DSCR.
Hard money
10% down · 12.0% · 12mo
- Down + closing
- —
- Monthly P&I
- —
- Monthly cashflow
- —
- DSCR
- —
- Eligible?
- —
Short-term bridge; refi at stabilization.
Rent comps 39 comps
| Address | Beds | Baths | Sqft | Rent | $/sqft | DOM | Units | Dist |
|---|---|---|---|---|---|---|---|---|
| 2909 Marsha Ln Royse City, TX | 3.0 | 2.0 | 1702 | $2,900 | $1.70 | 2d | 1 | 0.07mi |
| 2801 Spencer Cir Royse City, TX | 4.0 | 2.5 | 2416 | $1,981 | $0.82 | 5d | 1 | 0.09mi |
| 2717 Marsha Ln Royse City, TX | 4.0 | 3.0 | 2416 | $1,925 | $0.80 | 20d | 1 | 0.10mi |
| 725 Orchid Blvd Royse City, TX | 3.0 | 2.0 | 1558 | $1,795 | $1.15 | 43d | 1 | 0.10mi |
| 2712 Redwood St Royse City, TX | 4.0 | 2.5 | 2580 | $2,000 | $0.78 | 17d | 1 | 0.11mi |
| 2704 Redwood St Royse City, TX | 4.0 | 2.0 | 1760 | $1,850 | $1.05 | 22d | 1 | 0.14mi |
| 917 Orchid Blvd Royse City, TX | 3.0 | 2.0 | 1628 | $1,895 | $1.16 | 43d | 1 | 0.15mi |
| 2701 Redwood St Royse City, TX | 3.0 | 2.0 | 1816 | $2,100 | $1.16 | 5d | 1 | 0.16mi |
| 1021 Peach St Royse City, TX | 3.0 | 2.0 | 1530 | $1,200 | $0.78 | 43d | 1 | 0.19mi |
| 712 Preston Dr Royse City, TX | 4.0 | 2.0 | 1965 | $1,895 | $0.96 | 3d | 1 | 0.20mi |
| 3108 Overstreet Ln Royse City, TX | 3.0 | 2.0 | 1680 | $1,899 | $1.13 | 2d | 1 | 0.22mi |
| 4005 Bailey Way Royse City, TX | 4.0 | 3.0 | 2036 | $2,250 | $1.11 | 2d | 1 | 0.44mi |
| 3136 Overlook Dr Royse City, TX | 4.0 | 2.0 | 2046 | $2,295 | $1.12 | 2d | 1 | 0.45mi |
| 3136 Overlook Dr Royse City, TX | 4.0 | 2.0 | 2046 | $2,295 | $1.12 | 43d | 1 | 0.45mi |
| 3140 Overlook Dr Royse City, TX | 4.0 | 2.0 | 1866 | $2,200 | $1.18 | 43d | 1 | 0.45mi |
| 426 Oleander Dr Fate, TX | 3.0 | 2.0 | 2126 | $2,495 | $1.17 | 24d | 1 | 0.49mi |
| 207 Gardenia Dr Royse City, TX | 3.0 | 2.0 | 1830 | $2,195 | $1.20 | 24d | 1 | 0.51mi |
| 430 Oleander Dr Fate, TX | 3.0 | 2.0 | 2039 | $2,350 | $1.15 | 43d | 1 | 0.51mi |
| 3178 Wind Knot Way Royse City, TX | 3.0 | 2.0 | 1798 | $2,150 | $1.20 | 15d | 1 | 0.52mi |
| 513 Redbud Dr Royse City, TX | 3.0 | 2.0 | 1830 | $2,050 | $1.12 | 43d | 1 | 0.56mi |
| 3122 Wind Knot Way Royse City, TX | 4.0 | 3.5 | 2378 | $3,000 | $1.26 | 43d | 1 | 0.57mi |
| 525 Redbud Dr Royse City, TX | 3.0 | 2.0 | 2147 | $2,395 | $1.12 | 43d | 1 | 0.60mi |
| 2031 Roaring Fork Dr Royse City, TX | 3.0 | 2.0 | 1861 | $2,495 | $1.34 | 5d | 1 | 0.61mi |
| 208 Sunny Corner Rd Royse City, TX | 3.0 | 2.0 | 1780 | $1,695 | $0.95 | 19d | 1 | 0.63mi |
| 4069 Anglers Way Royse City, TX | 4.0 | 3.0 | 2492 | $2,650 | $1.06 | 43d | 1 | 0.66mi |
| 3270 Timineri Ln Royse City, TX | 4.0 | 2.5 | 2239 | $2,500 | $1.12 | 1d | 1 | 0.67mi |
| 523 Francis Ln Royse City, TX | 4.0 | 3.0 | 2029 | $2,299 | $1.13 | 43d | 1 | 0.67mi |
| 4023 Anglers Way Royse City, TX | 4.0 | 3.5 | 2122 | $2,900 | $1.37 | 5d | 1 | 0.69mi |
| 552 Firethorn Dr Royse City, TX | 3.0 | 2.0 | 1830 | $2,500 | $1.37 | 14d | 1 | 0.69mi |
| 3003 Wind Knot Way Royse City, TX | 4.0 | 3.5 | 2386 | $2,950 | $1.24 | 19d | 1 | 0.69mi |
| 3213 Shady River Trl Royse City, TX | 3.0 | 2.0 | 1858 | $1,849 | $1.00 | 22d | 1 | 0.72mi |
| 6105 Poolside Way Royse City, TX | 3.0 | 2.5 | 2463 | $2,600 | $1.06 | 43d | 1 | 0.73mi |
| 7015 Hopper Ct Royse City, TX | 4.0 | 2.5 | 2198 | $2,300 | $1.05 | 43d | 1 | 0.79mi |
| 3008 Lakewood Ln Royse City, TX | 4.0 | 3.0 | 2364 | $2,099 | $0.89 | 2d | 1 | 1.30mi |
| 1204 Cedar Cove Pl Royse City, TX | 3.0 | 2.0 | 1450 | $1,925 | $1.33 | 24d | 1 | 1.40mi |
| 1947 Hellams Ln Unit 1 Royse City, TX | 3.0 | 2.5 | 1850 | $2,250 | $1.22 | 5d | 1 | 1.41mi |
| 1939 Hellams Ln Unit 1 Royse City, TX | 3.0 | 2.5 | 1711 | $1,995 | $1.17 | 18d | 1 | 1.41mi |
| 1931 Hellams Ln Unit 1 Royse City, TX | 3.0 | 2.5 | 1711 | $1,995 | $1.17 | 18d | 1 | 1.41mi |
| 1332 Pierce St Royse City, TX | 4.0 | 2.0 | 2118 | $2,350 | $1.11 | 43d | 1 | 1.42mi |
HOA detail
- Monthly dues
- $38 · $456/yr
- Likely covers
- electric
Listing history 6 events
-
2026-01-02$249,950 Active 709-char remark
Show marketing remark (709 chars)
Spacious 3 Bedroom 2 bath home with an open floor plan. Large bedrooms. Master suite offers a walk in closet, Separate shower and garden tub. This home has just been upgraded with new carpet and luxury vinyl plank flooring, Fresh touch up on paint, new microwave installed, refrigerator, dishwasher, and electric stove range. Wood burning fireplace. 2 car garage. The back yard boasts a covered porch where you can relax and enjoy the fresh air in private setting. The back yard is fenced. This home is within walking distance to Fort Elementary school, just minutes from Royse City High School, and Interstate 30. The location is convenient to shopping, restaurants, and BUCCEES! Schedule your showing today!
-
2026-01-01historical $1,850
-
2025-11-20price $1,850
-
2025-10-30price $1,900
-
2025-10-08$1,975
-
2019-11-21soldstatus
ⓘ Source: listings_history table (triggers on properties + properties_extension) + one-shot
backfill from property_details.listing_events for pre-trigger history.
Tax reassessment forecast TX · Resets to sale price
- Current annual tax
- $5,971 · $498/mo
- Projected year-2 tax
- $5,971 · $498/mo
- Expected delta
- $0/yr ($0/mo · 0.0%)
ⓘ Screening estimate from a state-policy table — verify with the county assessor before closing.
Climate risk First Street
- Flood 1/10 Low FEMA zone X (unshaded) · 0% chance over 30 yrs
- Wildfire 5/10 Major
- Heat 8/10 Severe 7 d/yr ≥110°F today · 25 d/yr by 30 yrs out
- Wind 6/10 Major 27% chance of damaging wind over 30 yrs
- Air quality 2/10 Low 1 unhealthy d/yr today · 1 by 30 yrs out
Nearby sold comps map
Loading sold comps map…
Walkable amenities ~0.75 mi
Loading nearby amenities…
Taxation est. · year 1
- Rental income
- $26,811
- − Mortgage interest
- −$14,001
- − Property taxes
- −$5,971
- − Insurance
- −$1,250
- − Repairs & maintenance
- −$2,145
- − Management
- −$2,145
- − HOA
- −$456
- − Depreciation
- −$7,271
- Taxable loss
- −$6,427
- Est. tax savings @ 24.0%
- +$1,542
- After-tax cash flow
- $-682/yr
For passive investors: Depreciation is non-cash, so a rental often shows a tax loss while cash-flowing — sheltering income. Rental losses are passive: they offset passive income freely, and up to $25,000/yr can offset ordinary (W-2) income if you actively participate and your MAGI is under $100k (phasing out to $0 by $150k); unused losses carry forward. On sale, claimed depreciation is recaptured at up to 25%, and gains may owe capital-gains tax (a 1031 exchange can defer both). Figures are a year-1 estimate at your 24.0% rate — not tax advice; consult a CPA.
Schools (NCES district)
- District
- Royse City ISD
- NCES district ID
- 4838220
- Math proficiency
- 42% ▼ -10.00%
- Reading proficiency
- 42% ▼ -5.00%
- Median HH income
- $73,810
- Composite
- 38.44/100
- National rank
- #4197
- State rank
- #266 of 826 in TX
Livability — Royse City
- Score
- 75/100
- State rank
- #158
- US rank
- #4292
Category grades
Schools grade is shown separately in the Schools card above.
Census & demographics
- Census place
- Royse City, TX
- County
- Rockwall County · 132,930 people
- City population
- 48,739
- Metro
- Dallas-Fort Worth-Arlington, TX
- Population (ZIP)
- 48,739
- Household income
- $117,125
- Rent vs Own
- Severe rent burden
- 569.0
Population outlook (Rockwall County) Hauer SSP2
- Today (2025)
- 118,396 people
- By 2030
- 132,209 · +11.7%
- By 2040
- 159,538 · +34.7%
- By 2050
- 185,299 · +56.5%
- By 2075
- 243,489 · +105.7%
- By 2100
- 277,814 · +134.6%
Race, ethnicity, and origin ACS 2023
- Neighborhood character
- Diverse neighborhood (Simpson 0.57)
- Race & ethnicity
- White 60% Hispanic / Latino 25% Two or more races 12% Black 10% Asian 2%
- Hispanic origin (detail)
- Mexican 20%
- Common ancestry
- Slovak 2% Serbian 1% Lithuanian 1%
- Foreign-born
- 10% · Canada, Philippines, Jamaica
- Languages at home
- 80% English-only · Spanish 15% Other Indo-European 1%
Political lean MEDSL · Rockwall
- 2024 margin
- Solid R (+40.9) · D 29.1% · R 70.0%
- 2008→2024 swing
- +5.3pp toward D · 2008: -46.2pp · 2024: -40.9pp
- All cycles
- 2024: R+40.9 2020: R+37.7 2016: R+47.5 2012: R+53.3 2008: R+46.2
Not yet ingested
- Civics
- —
Market trends
- HPI YoY
- ▼ -71.10%
- Current HPI
- 212.8422
- Rent YoY
- ▼ -1.13%
- Metro
- Dallas-Fort Worth-Arlington, TX
- State GDP YoY
- ▲ 3.95%
- F500 in state
- 110
Industry mix (Fortune 500 HQ in TX)
| Industry | F500 HQs | Revenue |
|---|---|---|
| Energy | 16 | $1,198B |
|
||
| Technology | 5 | $198B |
|
||
| Engineering / Construction | 4 | $72B |
|
||
| Energy Services | 3 | $60B |
|
||
| Utilities | 3 | $41B |
|
||
| Healthcare | 2 | $330B |
|
||
Price history
+12555.7% since first listed6 events — show timeline
- 2026-01-02 Listed $249,950 NTREIS
- 2026-01-01 Rental Removed $1,850 NTREIS
- 2025-11-20 Price Changed $1,850 NTREIS
- 2025-10-30 Price Changed $1,900 NTREIS
- 2025-10-08 Listed for Rent $1,975 NTREIS
- 2019-11-21 Sold (Public Records) — Public Records
Property tax history
+3.8%/yrLatest (2025): $5,971 · -9.5% YoY. Source: county tax records.
Cash-flow waterfall
monthlySold comps — $/sqft
last 12 mo · ≤1 miLoading sold comps…