 Duplex
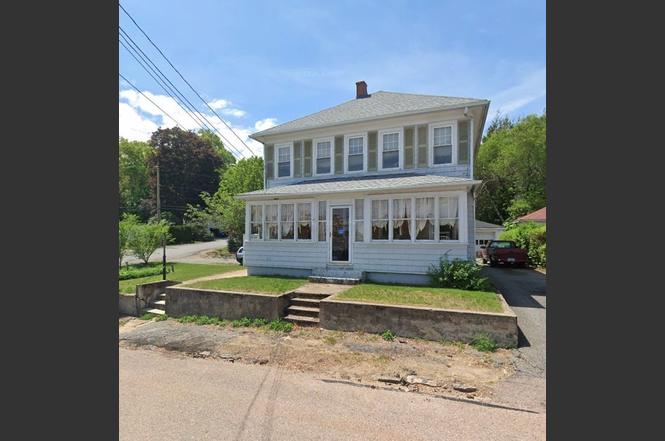
22 Greene St · Warwick, RI
Flood risk 1/10 · Minimal
- FEMA flood zone
- X (unshaded)
- Chance of flooding over 30 yrs
- 0.0%
- Est. flood insurance / yr
- $473 – $860
Fire risk 1/10 · Minimal
- Est. fire insurance / yr
- $835 – $1,551
Heat risk 5/10 · Moderate
- Hot days now (above 95°F)
- 7 days/yr
- Hot days in 30 yrs
- 16 days/yr
Wind risk 6/10 · Moderate
- Chance of severe wind over 30 yrs
- 77.0%
Air-quality risk 2/10 · Minimal
- Unhealthy air days now
- 2 days/yr
- Unhealthy air days in 30 yrs
- 2 days/yr
Risk factors via First Street. Map © Google.
Why this score? — see what drove the B- grade
The composite is a weighted blend of 9 inputs, each scored 0–100. Each bar is that input's sub-score; the figure is the points it added to the 100-point composite (weight × sub-score).
- Cash flow +25.4/30.0
- ARV discount +15.0/15.0
- DSCR +8.4/10.0
- 1% rule +6.9/10.0
- Livability +3.9/5.0
- Rent growth +3.8/5.0
- Condition / age +2.5/5.0
- Schools +1.5/10.0
- Appreciation +0.0/10.0
$300,000
🖨 Deal sheet 📄 Offer letter ✓ Due diligence
Multi-family units
County records classify this as Multi-Family (2-4 Unit). Listing-text estimate: 2 units. confirmed
Listing remarks
Excellent opportunity to own a two-family home in a desirable West Warwick location, offering strong potential for both investors and owner-occupants. Conveniently situated near major highways, public transportation, shopping, dining, and everyday amenities, this property provides easy access for commuters and tenants alike. Each unit is filled with natural light, featuring lots of windows that create bright and welcoming living spaces throughout. A detached two-car garage adds significant value, along with additional off-street parking for residents and guests. The property's layout offers flexibility for rental income, multi-generational living, or future improvements. With its prime loca
Key facts
- Natural light
- Bright living spaces
- Two-family home
Tags
Neighborhood map
What this means for you Summary
Snapshot
- This is a 2 × 3-bed/2.0-bath units multifamily listed at $300k.
Deal economics
- At list price, monthly cash flow is $689 ($8k/yr) — positive. Per door: $345/mo.
- The deal already cash-flows at list — no discount required.
- Meets the 1% rule at list price ($4k rent vs $300k).
- Cap rate 9.0% vs local median 3.7% in Warwick — top-decile yield for the area; either an underpriced asset or a hidden risk that comps aren't pricing in. Stress-test before assuming the spread holds.
Location & tenants
- Location reads 78/100 on livability (#6 in RI, #2,425 nationally) — a middle-class / working-renter tenant base. Strengths: crime A+, commute A+, housing A+; Watch: schools D+, amenities F.
- West Warwick (suburban): math 8% / reading 24% proficiency, ranked #30 of 39 in RI (top 77%) — low school quality limits family demand, transient renter base, plan for 1-2y turnover.
- Market conditions: Rents rising fast (+5.2%/yr); 100 active listings in the ZIP; solid renter incomes; 471 units permitted in Kent County in 2024 (240 in 5+ unit buildings).
- At $3,579/mo this rent would consume 55% of the median local household income ($78k/yr) (locally 1358% of renters already pay >50% of income on rent) — very limited rent-growth headroom before tenants either downsize or default.
Forward outlook
- Local home prices are declining (-3.0%/yr); year-one equity from $2k of loan paydown is wiped out by about $9k of value loss. Plan a longer hold.
- Kent County population projected at -14% by 2050 — secular population decline; favor cash flow + early exit over multi-decade hold.
- At projected returns (-3.0% appreciation + 5.2% rent growth), your $84k cash investment doubles in ~9 years — after that, you're playing with house money.
Negotiation context
- Only 6 days on market — expect competitive offers; lowballing is unlikely to land.
- 7 sale attempts since 18y ago with the ask held roughly flat each time — persistent listings suggest the price (not the market) is what's stuck; bring a comps-based counter.
- Current owner paid $163k; list at $300k implies a 84% gain — meaningful room to come down on a strong offer.
Risks & watch-outs
- Watch-outs: built in 1895 — expect roof / HVAC / electrical / plumbing capex.
- Climate carrying-cost: major wind risk, 77% chance of damaging wind over 30y; extreme-heat days projected 7→16/yr by 2055 (HVAC capex compounding) — expect insurance premiums to compound above CPI over the hold.
Questions for the listing agent
- Can we see the unit-by-unit rent roll, current vacancy, and any below-market leases? What's the average tenancy length?
- What capital expenditures (roof, boiler, parking lot, exteriors) have been made in the last 5 years, and what's planned in the next 2?
- Built in 1895 — when were the roof, HVAC, electrical panel, plumbing, and water heater last replaced?
- Is there a deadline driving the sale (1031 exchange, divorce, estate, relocation)? That informs how much negotiation room exists.
- Schools are D-rated, which usually means shorter tenancies and higher turnover. Who's the typical renter profile here, and what's been the actual vacancy rate?
- What's the average days-on-market for RENTAL listings here right now (not sales)? A rising rental-DOM trend means longer vacancies and softer asking-rent achievability than the comps imply.
- What's the recent tenant-quality profile in this submarket — average credit score on applications, eviction rate, late-payment / NSF rate, and stable-employment percentage? A property-management company in the area should have these aggregated.
- How much new apartment / multifamily construction is in the pipeline within 1–3 miles? Heavy new supply (>2% of stock underway) typically softens rents 12–24 months out; light construction supports rent growth.
Investment metrics
- 1% rule
- 1.19% ✓
- Cap rate
- 9.05%
- Cash-on-cash
- 9.84%
- DSCR
- 1.44
- GRM
- 7.0
CMA / ARV
- ARV (on-the-fly)
- $433,440
- Comps found
- 8
Show comp detail 8 sales within ~0.75 mi
| Address | Dist | Beds/Ba | Sqft | Sold | Price | $/sf | Match |
|---|---|---|---|---|---|---|---|
| 16 Gough Ave | 0.37mi | 3/2.0 (-1) | 1,672 (-0%) | 12mo | $380,000 | $227 | 67 |
| 22 24 Agnes St | 0.34mi | 4/2.0 | 1,560 (-7%) | 8mo | $420,000 | $269 | 66 |
| 125 Read Ave | 0.57mi | 4/2.0 | 1,792 (+7%) | 4mo | $415,000 | $232 | 59 |
| 134 136 Andrews Ave | 0.67mi | 4/2.0 | 1,638 (-2%) | 12mo | $357,500 | $218 | 55 |
| 156 Read Ave | 0.49mi | 4/2.0 | 1,600 (-5%) | 21mo | $420,000 | $263 | 52 |
| 18 Potter Ave | 0.32mi | 4/3.0 | 1,488 (-11%) | 20mo | $425,000 | $286 | 46 |
| 38 Border St | 0.70mi | 4/2.5 | 1,722 (+2%) | 20mo | $396,000 | $230 | 44 |
| 10 Lachance St | 0.57mi | 4/2.0 | 1,456 (-13%) | 18mo | $375,000 | $258 | 36 |
Match score weights: distance 35% · size 25% · config 20% · recency 20%. Top-matched comps best support the ARV.
Projected returns pro-forma
-3.0% appreciation · 5.25% rent growth · sell at horizon
- IRR
- 1.1%
- Equity multiple
- 1.04×
- Total profit
- $3,649
- Equity at exit
- $44,731
- IRR
- 12.9%
- Equity multiple
- 2.14×
- Total profit
- $95,663
- Equity at exit
- $25,939
Cash invested: $84,000 (down + closing). Projections, not guarantees.
Landlord ↔ Tenant lean methodology
- Overall (STATE)
- 31 Tenant-Leaning
- State Rhode Island
- 31 Tenant-Leaning · D+8
- County
- — inherits STATE
- City
- — inherits STATE
ZIP-level market 02893
- Rents YoY
- 5.2%
- Active inventory
- 100
- Price-to-rent
- 14.0×
Monthly cashflow live
- Estimated rent
- $3,579 high interval (Pro) →
- Mortgage (P&I)
- −$1,573
- Tax from tax record
- −$440 /mo · $5,282/yr
- Insurance
- −$125
- HOA
- −$0
- Vacancy / Maint / Mgmt
- −$752
- Net cashflow
- $689
Break-even live
2-unit breakdown (identical units grouped — click to expand)
| Units | Beds | Baths | Est. rent |
|---|---|---|---|
| 2× units | 3 | 2 | $3,578 |
| #1 | 3 | 2 | $1,789 |
| #2 | 3 | 2 | $1,789 |
| Total (2 units) | $3,579 | ||
UW: 25.0% down · 7.5% · 30yr · 1.5% tax · 5.0% vac · 8.0% maint · 8.0% mgmt
Financing live
Cash to close
- Down payment
- $75,000
- Closing costs
- $9,000
- Reserves months
- —
- Total cash needed
- —
Loan-product check · same deal, 3 products live
Conventional
25% down · 7.5% · 30yr
- Down + closing
- —
- Monthly P&I
- —
- Monthly cashflow
- —
- DSCR
- —
- Eligible?
- —
Personal DTI + credit; lowest rate.
DSCR
20% down · 8.5% · 30yr
- Down + closing
- —
- Monthly P&I
- —
- Monthly cashflow
- —
- DSCR
- —
- Eligible?
- —
No personal income docs; deal must DSCR.
Hard money
10% down · 12.0% · 12mo
- Down + closing
- —
- Monthly P&I
- —
- Monthly cashflow
- —
- DSCR
- —
- Eligible?
- —
Short-term bridge; refi at stabilization.
Listing history 20 events
-
2026-02-16status Pending
-
2026-02-10$300,000 Active
-
2013-12-19price $174,900
-
2013-12-19price $204,999
-
2013-12-19price $239,900
-
2013-12-19price $174,900
-
2011-03-22soldstatus $163,000
-
2011-03-21soldstatus $163,000
-
2011-01-13historical
-
2011-01-12historical
-
2011-01-03$164,900
-
2011-01-03$164,900
-
2010-12-29historical
-
2010-12-29historical
-
2010-07-19$195,300
-
2010-07-18$195,300
-
2010-03-19historical
-
2009-08-12$235,000
-
2009-07-17historical
-
2008-10-14$249,900
ⓘ Source: listings_history table (triggers on properties + properties_extension) + one-shot
backfill from property_details.listing_events for pre-trigger history.
Tax reassessment forecast RI · Partial reset (capped growth)
- Current annual tax
- $5,282 · $440/mo
- Projected year-2 tax
- $5,282 · $440/mo
- Expected delta
- $0/yr ($0/mo · 0.0%)
ⓘ Screening estimate from a state-policy table — verify with the county assessor before closing.
Climate risk First Street
- Flood 1/10 Low FEMA zone X (unshaded) · 0% chance over 30 yrs
- Wildfire 1/10 Low
- Heat 5/10 Major 7 d/yr ≥95°F today · 16 d/yr by 30 yrs out
- Wind 6/10 Major 77% chance of damaging wind over 30 yrs
- Air quality 2/10 Low 2 unhealthy d/yr today · 2 by 30 yrs out
Nearby sold comps map
Loading sold comps map…
Walkable amenities ~0.75 mi
Loading nearby amenities…
Taxation est. · year 1
- Rental income
- $42,948
- − Mortgage interest
- −$16,805
- − Property taxes
- −$5,282
- − Insurance
- −$1,500
- − Repairs & maintenance
- −$3,436
- − Management
- −$3,436
- − Depreciation
- −$8,727
- Taxable income
- $3,762
- Est. tax owed @ 24.0%
- −$903
- After-tax cash flow
- $7,365/yr
For passive investors: Depreciation is non-cash, so a rental often shows a tax loss while cash-flowing — sheltering income. Rental losses are passive: they offset passive income freely, and up to $25,000/yr can offset ordinary (W-2) income if you actively participate and your MAGI is under $100k (phasing out to $0 by $150k); unused losses carry forward. On sale, claimed depreciation is recaptured at up to 25%, and gains may owe capital-gains tax (a 1031 exchange can defer both). Figures are a year-1 estimate at your 24.0% rate — not tax advice; consult a CPA.
Schools (NCES district)
- District
- West Warwick
- NCES district ID
- 4401140
- Math proficiency
- 8% ▼ -10.00%
- Reading proficiency
- 24% ▼ -3.00%
- Median HH income
- $50,176
- Composite
- 14.55/100
- National rank
- #9418
- State rank
- #30 of 39 in RI
Livability — Warwick
- Score
- 78/100
- State rank
- #6
- US rank
- #2425
Category grades
Schools grade is shown separately in the Schools card above.
Census & demographics
- County
- Kent County · 90,904 people
- City population
- 108,434
- Metro
- Providence-Warwick, RI-MA
- Population (ZIP)
- 31,173
- Household income
- $77,608
- Rent vs Own
- Severe rent burden
- 1358.0
Population outlook (Kent County) Hauer SSP2
- Today (2025)
- 160,994 people
- By 2030
- 157,428 · -2.2%
- By 2040
- 148,389 · -7.8%
- By 2050
- 137,995 · -14.3%
- By 2075
- 118,536 · -26.4%
- By 2100
- 102,266 · -36.5%
Race, ethnicity, and origin ACS 2023
- Neighborhood character
- Predominantly White (81%)
- Race & ethnicity
- White 81% Hispanic / Latino 11% Two or more races 7% Asian 2% Black 1%
- Hispanic origin (detail)
- Mexican 1% Puerto Rican 4% Dominican 3%
- Common ancestry
- Lithuanian 12% Russian 11% Romanian 5%
- Foreign-born
- 8% · Canada
- Languages at home
- 88% English-only · Spanish 7% Other Indo-European 4% Other Asian/Pacific 1%
Political lean MEDSL · Kent
- 2024 margin
- Toss-up / Even · D 49.9% · R 48.1% · Other 2.0%
- 2008→2024 swing
- -15.6pp toward R · 2008: 17.5pp · 2024: 1.9pp
- All cycles
- 2024: D+1.9 2020: D+7.6 2016: R+0.7 2012: D+18.4 2008: D+17.5
Not yet ingested
- Civics
- —
Market trends
- HPI YoY
- ▼ -358.77%
- Current HPI
- 355.5243
- Rent YoY
- ▲ 5.25%
- Metro
- Providence-Warwick, RI-MA
- State GDP YoY
- ▲ 2.25%
- F500 in state
- 10
Industry mix (Fortune 500 HQ in RI)
| Industry | F500 HQs | Revenue |
|---|---|---|
| Healthcare | 1 | $373B |
|
||
| Food Distribution | 1 | $31B |
|
||
| Aerospace / Defense | 1 | $14B |
|
||
| Financial Services | 1 | $8B |
|
||
| Consumer Goods | 1 | $4B |
|
||
Price history
+20.0% since first listed20 events — show timeline
- 2026-02-16 Pending — RIS
- 2026-02-10 Listed $300,000 RIS
- 2013-12-19 Price Changed $174,900 RIS
- 2013-12-19 Price Changed $204,999 RIS
- 2013-12-19 Price Changed $239,900 RIS
- 2013-12-19 Price Changed $174,900 RIS
- 2011-03-22 Sold (Public Records) $163,000 Public Records
- 2011-03-21 Sold (MLS) $163,000 RIS
- 2011-01-13 Listing Removed — RIS
- 2011-01-12 Listing Removed — RIS
- 2011-01-03 Listed $164,900 RIS
- 2011-01-03 Listed $164,900 RIS
- 2010-12-29 Listing Removed — RIS
- 2010-12-29 Listing Removed — RIS
- 2010-07-19 Listed $195,300 RIS
- 2010-07-18 Listed $195,300 RIS
- 2010-03-19 Listing Removed — RIS
- 2009-08-12 Listed $235,000 RIS
- 2009-07-17 Listing Removed — RIS
- 2008-10-14 Listed $249,900 RIS
Property tax history
+0.2%/yrLatest (2025): $5,282 · +3.9% YoY. Source: county tax records.
Cash-flow waterfall
monthlySold comps — $/sqft
last 12 mo · ≤1 miLoading sold comps…