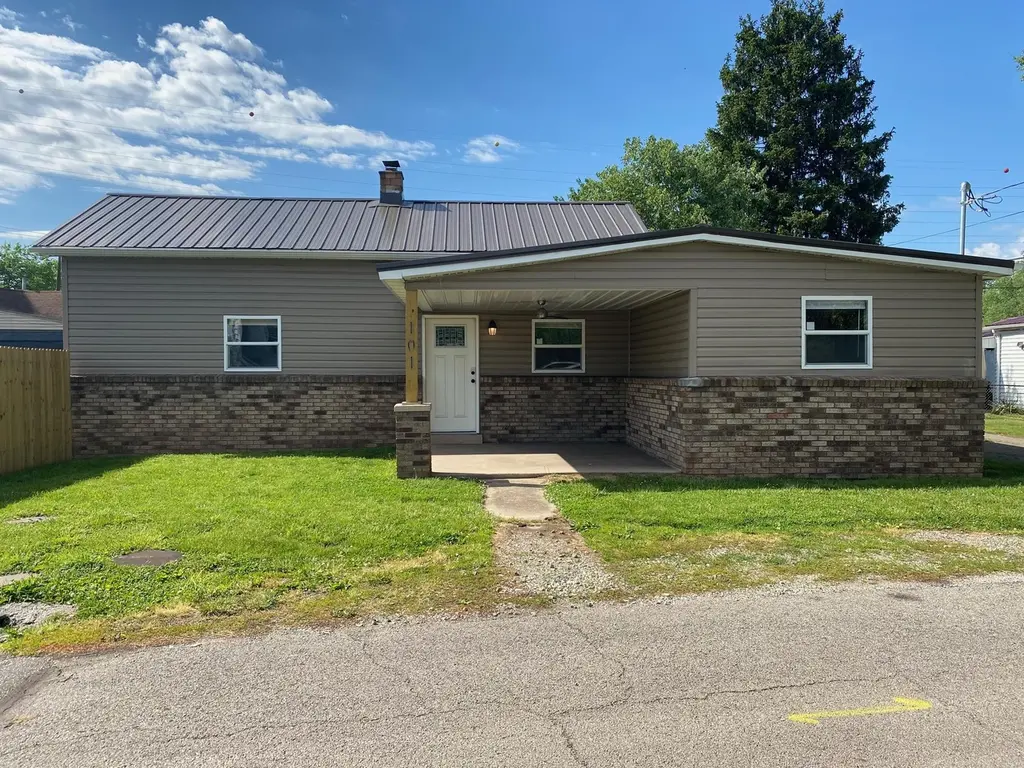
101 Stanley St · Coal Grove, OH
Flood risk No data
- FEMA flood zone
- —
- Chance of flooding over 30 yrs
- —
- Est. flood insurance / yr
- —
Fire risk No data
- Est. fire insurance / yr
- —
Heat risk No data
- Hot days now (above threshold)
- —
- Hot days in 30 yrs
- —
Wind risk No data
- Chance of severe wind over 30 yrs
- —
Air-quality risk No data
- Unhealthy air days now
- —
- Unhealthy air days in 30 yrs
- —
Risk factors via First Street. Map © Google.
Why this score? — see what drove the D grade
The composite is a weighted blend of 9 inputs, each scored 0–100. Each bar is that input's sub-score; the figure is the points it added to the 100-point composite (weight × sub-score).
- Cash flow +20.7/30.0
- DSCR +6.6/10.0
- 1% rule +4.3/10.0
- Schools +4.0/10.0
- Livability +3.3/5.0
- Rent growth +2.5/5.0
- Condition / age +2.5/5.0
- ARV discount +0.0/15.0
- Appreciation +0.0/10.0
$129,500
🖨 Deal sheet (PDF) 📄 Offer letter ✓ Due diligence
Listing remarks
Completely remodeled and move -in ready! This charming brick and vinyl ranch features an open concept layout with 2 bedrooms and 2 brand new bathrooms. Updates include all new wiring, new plumbing, new furnace, newer windows and tankless hot water heater. The stylish kitchen boasts granite countertops, stainless steel appliances and flows into the living area with luxury vinyl plank flooring throughout the house. Step outside to a new deck, large porch and fenced yard--perfect for relaxing or entertaining.
Key facts
- New furnace
- New plumbing
- New wiring
Tags
Neighborhood map
What this means for you Summary
Snapshot
- This is a 2-bed/1.0-bath single-family listed at $130k.
Deal economics
- At list price, monthly cash flow is $176 ($2k/yr) — positive.
- The deal already cash-flows at list — no discount required.
- To meet the 1% rule (rent ≥ 1% of price), the offer needs to be $120k (6.9% below list).
- Recommended offer: $120k (6.9% below list) — sets the bar for 1% rule.
Location & tenants
- Location reads 66/100 on livability (#638 in OH) — a middle-class / working-renter tenant base. Strengths: crime A+, cost of living A+, housing A+; Watch: amenities F, commute F, employment F.
- Dawson-Bryant Local (suburban): math 44% / reading 50% proficiency, ranked #485 of 656 in OH (top 74%) — families likely to look elsewhere, expect single-tenant / working-renter base with shorter leases.
- Zoned schools: Dawson-Bryant Elementary School (math 58% / reading 56%, grade C+, #729 of 1,584 statewide, top 48%, 576 students, 0% FRL); Dawson-Bryant Middle School (math 37% / reading 45%, grade F, #505 of 654 statewide, top 78%, 262 students, 0% FRL); Dawson-Bryant High School (math 27% / reading 52%, grade F, #528 of 781 statewide, top 71%, 311 students, 0% FRL) — zoned schools average 0% FRL vs 54% district-wide (54 pts lower); this property's tenant base skews higher-income than the district average.
- Market conditions: 86 active listings in the ZIP; 1 comparable units currently listed for rent nearby; 18 units permitted in Lawrence County in 2024 (0 in 5+ unit buildings).
Forward outlook
- Local home prices are declining (-3.0%/yr); year-one equity from $895 of loan paydown is wiped out by about $4k of value loss. Plan a longer hold.
- Lawrence County population projected at -22% by 2050 — secular population decline; favor cash flow + early exit over multi-decade hold.
Negotiation context
- It's been on market 28 days — a 2% lower offer ($128k) is reasonable based on typical stale-listing flexibility.
Risks & watch-outs
- Watch-outs: built in 1920 — expect roof / HVAC / electrical / plumbing capex.
Questions for the listing agent
- Built in 1920 — when were the roof, HVAC, electrical panel, plumbing, and water heater last replaced?
- Is there a deadline driving the sale (1031 exchange, divorce, estate, relocation)? That informs how much negotiation room exists.
- The area grade is low — what's the realistic commute time and amenity access for the typical tenant pool here? Any planned neighborhood developments (good or bad) we should know about?
- What's the average days-on-market for RENTAL listings here right now (not sales)? A rising rental-DOM trend means longer vacancies and softer asking-rent achievability than the comps imply.
- What's the recent tenant-quality profile in this submarket — average credit score on applications, eviction rate, late-payment / NSF rate, and stable-employment percentage? A property-management company in the area should have these aggregated.
- How much new for-sale + rental construction is in the pipeline within 1–3 miles? Heavy new supply typically softens prices + rents 12–24 months out; constrained supply supports both.
Investment metrics
- 1% rule
- 0.93% ✗
- Cap rate
- 7.93%
- Cash-on-cash
- 5.83%
- DSCR
- 1.26
- GRM
- 9.0
CMA / ARV
- ARV (median comp)
- $94,281
- List price
- $129,500
- Delta
- 37.36%
- Verdict
- OVERPRICED
- Comps
- 16 within 1.0 mi
Show comp detail 3 sales within ~0.75 mi
| Address | Dist | Beds/Ba | Sqft | Sold | Price | $/sf | Match |
|---|---|---|---|---|---|---|---|
| 805-1/2 High St | 0.40mi | 2/1.0 | 744 (-12%) | 2mo | $100,000 | $134 | 59 |
| 109 Lane Street St | 0.73mi | 2/1.0 | 840 (-1%) | 12mo | $16,800 | $20 | 55 |
| 701 Lane | 0.57mi | 2/1.0 | 768 (-9%) | 16mo | $117,500 | $153 | 44 |
Match score weights: distance 35% · size 25% · config 20% · recency 20%. Top-matched comps best support the ARV.
Projected returns pro-forma
-3.0% appreciation · 3.0% rent growth · sell at horizon
- IRR
- -7.3%
- Equity multiple
- 0.73×
- Total profit
- $-9,822
- Equity at exit
- $19,309
- IRR
- 2.2%
- Equity multiple
- 1.16×
- Total profit
- $5,668
- Equity at exit
- $11,197
Cash invested: $36,260 (down + closing). Projections, not guarantees.
Landlord ↔ Tenant lean methodology
- Overall (STATE)
- 73 Landlord-Friendly
- State Ohio
- 73 Landlord-Friendly · R+6
- County
- — inherits STATE
- City
- — inherits STATE
ZIP-level market 45638
- Home prices YoY
- -19.6%
- Active inventory
- 86
- Price-to-rent
- 9.0×
Monthly cashflow live
- Estimated rent
- $1,205 medium interval (Pro) →
- Mortgage (P&I)
- −$679
- Tax from tax record
- −$43 /mo · $513/yr
- Insurance
- −$54
- HOA
- −$0
- Vacancy / Maint / Mgmt
- −$253
- Net cashflow
- $176
Break-even live
Sensitivity live
| Price | -10% $249 | -5% $213 | +0% $176 | +5% $139 | +10% $103 |
|---|---|---|---|---|---|
| Rent | -10% $81 | -5% $129 | +0% $176 | +5% $224 | +10% $271 |
| Rate | -1.0pp $241 | -0.5pp $209 | base $176 | +0.5pp $143 | +1.0pp $108 |
UW: 25.0% down · 7.5% · 30yr · 1.5% tax · 5.0% vac · 8.0% maint · 8.0% mgmt
Financing live
Cash to close
- Down payment
- $32,375
- Closing costs
- $3,885
- Reserves months
- —
- Total cash needed
- —
Loan-product check · same deal, 3 products live
Conventional
25% down · 7.5% · 30yr
- Down + closing
- —
- Monthly P&I
- —
- Monthly cashflow
- —
- DSCR
- —
- Eligible?
- —
Personal DTI + credit; lowest rate.
DSCR
20% down · 8.5% · 30yr
- Down + closing
- —
- Monthly P&I
- —
- Monthly cashflow
- —
- DSCR
- —
- Eligible?
- —
No personal income docs; deal must DSCR.
Hard money
10% down · 12.0% · 12mo
- Down + closing
- —
- Monthly P&I
- —
- Monthly cashflow
- —
- DSCR
- —
- Eligible?
- —
Short-term bridge; refi at stabilization.
Rent comps 1 comps
| Address | Beds | Baths | Sqft | Rent | $/sqft | DOM | Units | Dist |
|---|---|---|---|---|---|---|---|---|
| 200 Providence Hill Dr Ashland, KY | 1.0–3.0 | 1.0–2.0 | 1100 | $1,205 | $1.10 | 4d | 1 | 0.73mi |
Listing history 1 events
-
2026-04-29$129,500 Active 511-char remark
ⓘ Source: listings_history table (triggers on properties + properties_extension) + one-shot
backfill from property_details.listing_events for pre-trigger history.
Tax reassessment forecast OH · Partial reset (capped growth)
- Current annual tax
- $513 · $43/mo
- Projected year-2 tax
- $1,267 · $106/mo
- Expected delta
- +$754/yr (+$63/mo · 146.9%)
ⓘ Screening estimate from a state-policy table — verify with the county assessor before closing.
Nearby sold comps map
Loading sold comps map…
Walkable amenities ~0.75 mi
Loading nearby amenities…
Taxation est. · year 1
- Rental income
- $14,460
- − Mortgage interest
- −$7,254
- − Property taxes
- −$513
- − Insurance
- −$648
- − Repairs & maintenance
- −$1,157
- − Management
- −$1,157
- − Depreciation
- −$3,767
- Taxable loss
- −$35
- Est. tax savings @ 24.0%
- +$8
- After-tax cash flow
- $2,122/yr
For passive investors: Depreciation is non-cash, so a rental often shows a tax loss while cash-flowing — sheltering income. Rental losses are passive: they offset passive income freely, and up to $25,000/yr can offset ordinary (W-2) income if you actively participate and your MAGI is under $100k (phasing out to $0 by $150k); unused losses carry forward. On sale, claimed depreciation is recaptured at up to 25%, and gains may owe capital-gains tax (a 1031 exchange can defer both). Figures are a year-1 estimate at your 24.0% rate — not tax advice; consult a CPA.
Schools (NCES district)
- District
- Dawson-Bryant Local
- NCES district ID
- 3904792
- Math proficiency
- 44% ▼ -31.00%
- Reading proficiency
- 50% ▼ -19.00%
- Median HH income
- $45,537
- Composite
- 39.85/100
- National rank
- #3870
- State rank
- #485 of 656 in OH
Livability — Coal Grove
- Score
- 66/100
- State rank
- #638
- US rank
- #11274
Category grades
Schools grade is shown separately in the Schools card above.
Census & demographics
- Census place
- Coal Grove, OH
- County
- Lawrence · 57,020 people
- Metro
- Huntington-Ashland, WV-KY-OH
- Population (ZIP)
- 19,921
- Household income
- $49,544
- Rent vs Own
- Severe rent burden
- 10.7
Population outlook (Lawrence County) Hauer SSP2
- Today (2025)
- 57,915 people
- By 2030
- 55,650 · -3.9%
- By 2040
- 50,523 · -12.8%
- By 2050
- 45,103 · -22.1%
- By 2075
- 32,441 · -44.0%
- By 2100
- 21,754 · -62.4%
Race, ethnicity, and origin ACS 2023
- Neighborhood character
- Predominantly White (95%)
- Race & ethnicity
- White 95% Two or more races 3% Black 1%
- Common ancestry
- Slovak 2% Iranian 2% Lithuanian 1%
- Foreign-born
- 0%
Political lean MEDSL · Lawrence
- 2024 margin
- Solid R (+50.5) · D 24.4% · R 74.9%
- 2008→2024 swing
- -35.2pp toward R · 2008: -15.3pp · 2024: -50.5pp
- All cycles
- 2024: R+50.5 2020: R+45.6 2016: R+43.9 2012: R+15.5 2008: R+15.3
Not yet ingested
- Civics
- —
Market trends
- HPI YoY
- ▼ -48.00%
- Current HPI
- 196.7459
- Rent YoY
- —
- Metro
- —
- State GDP YoY
- ▲ 1.98%
- F500 in state
- 48
Industry mix (Fortune 500 HQ in OH)
| Industry | F500 HQs | Revenue |
|---|---|---|
| Insurance | 3 | $145B |
|
||
| Industrial Machinery | 3 | $49B |
|
||
| Financial Services | 3 | $24B |
|
||
| Consumer Goods | 2 | $93B |
|
||
| Aerospace / Defense | 2 | $47B |
|
||
| Utilities | 2 | $33B |
|
||
Property tax history
+6.7%/yrLatest (2025): $513 · +14.2% YoY. Source: county tax records.
Cash-flow waterfall
monthlySold comps — $/sqft
last 12 mo · ≤1 miLoading sold comps…