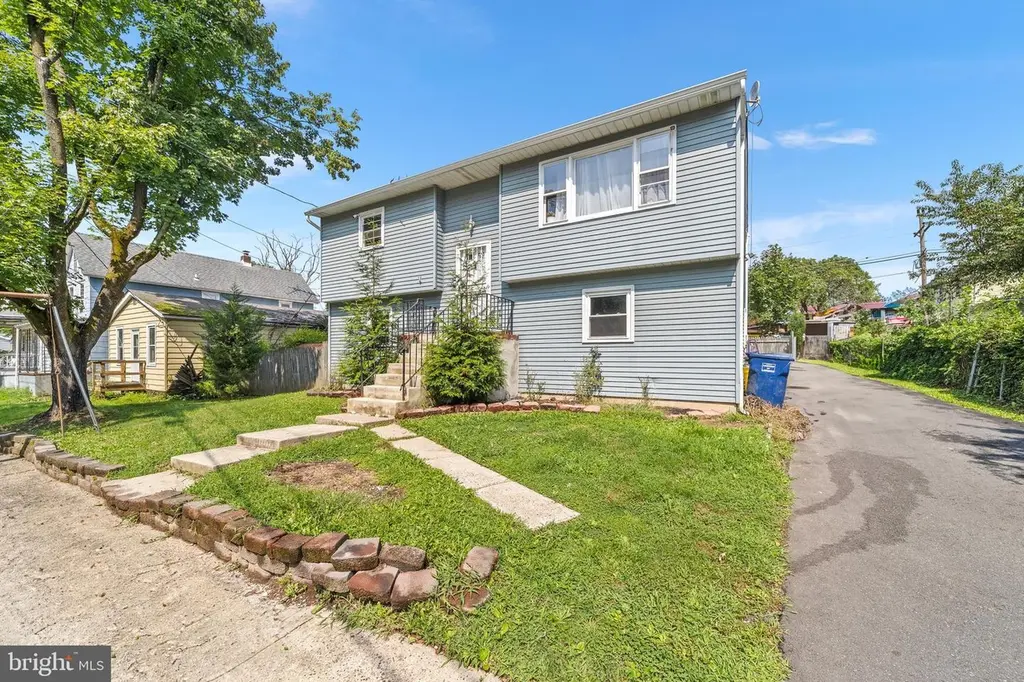
142 Lawn Park · Trenton, NJ
Flood risk 1/10 · Minimal
- FEMA flood zone
- X (unshaded)
- Chance of flooding over 30 yrs
- 0.0%
- Est. flood insurance / yr
- $507 – $1,088
Fire risk 1/10 · Minimal
- Est. fire insurance / yr
- $526 – $976
Heat risk 6/10 · Moderate
- Hot days now (above 101°F)
- 7 days/yr
- Hot days in 30 yrs
- 14 days/yr
Wind risk 6/10 · Moderate
- Chance of severe wind over 30 yrs
- 27.0%
Air-quality risk 4/10 · Minor
- Unhealthy air days now
- 6 days/yr
- Unhealthy air days in 30 yrs
- 7 days/yr
Risk factors via First Street. Map © Google.
Why this score? — see what drove the C- grade
The composite is a weighted blend of 9 inputs, each scored 0–100. Each bar is that input's sub-score; the figure is the points it added to the 100-point composite (weight × sub-score).
- Cash flow +14.9/30.0
- ARV discount +14.5/15.0
- DSCR +4.5/10.0
- 1% rule +4.1/10.0
- Livability +3.8/5.0
- Schools +3.6/10.0
- Rent growth +2.5/5.0
- Condition / age +2.5/5.0
- Appreciation +0.0/10.0
$430,000
🖨 Deal sheet 📄 Offer letter ✓ Due diligence
Listing remarks
$2k credit offered towards buyers closing costs, brand new water heater, and new updates!! Welcome to 142 Lawn Park Ave, nestled in the highly sought-after Eldridge Park section of Lawrence Township. This spacious, well-maintained home offers an ideal blend of comfort, functionality, and location. This inviting property features an open floor plan, seamlessly connecting the spacious living room with hardwood floors to a bright and airy dining area. The kitchen boasts beautiful countertops, stainless steel appliances, microwave, and ample cabinet space, perfect for both everyday cooking and entertaining. The main floor open concept area provides comfort and enjoyment with this open concept s
Key facts
- Open floor plan
- Kitchenette area
- Ample cabinet space
Tags
Property features AI
Exterior
- Parking: Driveway parking (4 spaces); Total of 4 garage/parking spaces
- Utilities: Public water; Public sewer; Natural gas for heating and hot water
- Home design: Detached property; 2 floors in unit; Property described in excellent to very good condition
- Construction: Vinyl siding; Block foundation; Asphalt roof; Above-grade and below-grade structures; Pets allowed with no pet restrictions
- Exterior features: Lot dimensions approximately 72 x 70; Not in federal flood zone; Municipal trash service
Interior
- Kitchen: Built-in microwave; Microwave; Oven/Range - Electric; Refrigerator; Stainless steel appliances; Extra refrigerator/freezer
- Bedrooms: 2 bedrooms on main level; 3 bedrooms on lower level
- Flooring: Carpet; Laminate plank; Luxury vinyl plank
- Bathrooms: 2 full bathrooms (1 on main level, 1 on lower level)
- Heating & cooling: Hot water heating (natural gas); Window air conditioning units
- Interior features: Ceiling fans; Kitchen island; Kitchenette
- Laundry & utility: Washer; Dryer; Laundry on lower floor; Exhaust fan
Neighborhood map
What this means for you Summary
Snapshot
- This is a 5-bed/2.0-bath single-family listed at $430k.
Deal economics
- At list price, monthly cash flow is $123 ($1k/yr) — positive.
- The deal already cash-flows at list — no discount required.
- To meet the 1% rule (rent ≥ 1% of price), the offer needs to be $390k (9.3% below list).
- Recommended offer: $390k (9.3% below list) — sets the bar for 1% rule.
Location & tenants
- Location reads 76/100 on livability (#133 in NJ, #3,533 nationally) — a middle-class / working-renter tenant base. Strengths: amenities A+, commute A+, health & safety A+; Watch: schools F, crime F, employment F.
- Lawrence Township Public School District (suburban): math 24% / reading 52% proficiency, ranked #217 of 472 in NJ (top 46%) — families likely to look elsewhere, expect single-tenant / working-renter base with shorter leases; only 17% free/reduced lunch — higher-income household profile.
- Market conditions: Rents soft (-0.0%/yr); 119 active listings in the ZIP; 3 comparable units currently listed for rent nearby; rentals leasing fast (median 14d on market — plan ~1-2 weeks tenant-placement turnaround); high-income renter base; 2,256 units permitted in Mercer County in 2024 (1,303 in 5+ unit buildings).
- This rent runs 37% of the median local income ($126k/yr) — at the standard rent-burdened threshold; future hikes will face affordability resistance.
Forward outlook
- Local home prices are declining (-3.0%/yr); year-one equity from $3k of loan paydown is wiped out by about $13k of value loss. Plan a longer hold.
- Mercer County population projected at +4% by 2050 — modest demand growth; plan on rents tracking national, not racing it.
Negotiation context
- It's been on market 23 days — a 2% lower offer ($424k) is reasonable based on typical stale-listing flexibility.
- 7 sale attempts since 9y ago with the ask held roughly flat each time — persistent listings suggest the price (not the market) is what's stuck; bring a comps-based counter.
- Current owner paid $195k; list at $430k implies a 121% gain — meaningful room to come down on a strong offer.
Risks & watch-outs
- Climate carrying-cost: major wind risk, 27% chance of damaging wind over 30y; extreme-heat days projected 7→14/yr by 2055 (HVAC capex compounding) — expect insurance premiums to compound above CPI over the hold.
Questions for the listing agent
- Built in 1976 — when were the roof, HVAC, electrical panel, plumbing, and water heater last replaced?
- Is there a deadline driving the sale (1031 exchange, divorce, estate, relocation)? That informs how much negotiation room exists.
- Schools are F-rated, which usually means shorter tenancies and higher turnover. Who's the typical renter profile here, and what's been the actual vacancy rate?
- Crime grade is F in this area — have there been break-ins, vandalism, or insurance claims at this property in the last 3 years? What carrier currently insures it and at what premium?
- What's the average days-on-market for RENTAL listings here right now (not sales)? A rising rental-DOM trend means longer vacancies and softer asking-rent achievability than the comps imply.
- What's the recent tenant-quality profile in this submarket — average credit score on applications, eviction rate, late-payment / NSF rate, and stable-employment percentage? A property-management company in the area should have these aggregated.
- How much new for-sale + rental construction is in the pipeline within 1–3 miles? Heavy new supply typically softens prices + rents 12–24 months out; constrained supply supports both.
Investment metrics
- 1% rule
- 0.91% ✗
- Cap rate
- 6.64%
- Cash-on-cash
- 1.22%
- DSCR
- 1.05
- GRM
- 9.2
CMA / ARV
- ARV (median comp)
- $509,425
- List price
- $430,000
- Delta
- -15.59%
- Verdict
- UNDERPRICED
- Comps
- 20 within 1.0 mi
Show comp detail 4 sales within ~0.75 mi
| Address | Dist | Beds/Ba | Sqft | Sold | Price | $/sf | Match |
|---|---|---|---|---|---|---|---|
| 235 Eldridge Ave | 0.32mi | 4/3.0 (-1) | 1,649 (-5%) | 8mo | $499,830 | $303 | 60 |
| 166 Millerick Ave | 0.55mi | 4/2.0 (-1) | 1,664 (-4%) | 18mo | $430,000 | $258 | 46 |
| 131 Drift Ave | 0.52mi | 4/2.0 (-1) | 1,941 (+11%) | 8mo | $550,000 | $283 | 45 |
| 34 Sherbrooke | 0.74mi | 4/1.5 (-1) | 1,580 (-9%) | 24mo | $395,000 | $250 | 23 |
Match score weights: distance 35% · size 25% · config 20% · recency 20%. Top-matched comps best support the ARV.
Projected returns pro-forma
-3.0% appreciation · 0.0% rent growth · sell at horizon
- IRR
- -17.8%
- Equity multiple
- 0.39×
- Total profit
- $-73,237
- Equity at exit
- $64,114
- IRR
- -17.0%
- Equity multiple
- 0.19×
- Total profit
- $-97,677
- Equity at exit
- $37,179
Cash invested: $120,400 (down + closing). Projections, not guarantees.
Landlord ↔ Tenant lean methodology
- Overall (STATE)
- 21 Tenant-Leaning
- State New Jersey
- 21 Tenant-Leaning · D+6
- County
- — inherits STATE
- City
- — inherits STATE
ZIP-level market 08648
- Rents YoY
- -0.0%
- Active inventory
- 119
- Price-to-rent
- 9.2×
Monthly cashflow live
- Estimated rent
- $3,901 medium interval (Pro) →
- Mortgage (P&I)
- −$2,255
- Tax from tax record
- −$525 /mo · $6,302/yr
- Insurance
- −$179
- HOA
- −$0
- Vacancy / Maint / Mgmt
- −$819
- Net cashflow
- $123
Break-even live
UW: 25.0% down · 7.5% · 30yr · 1.5% tax · 5.0% vac · 8.0% maint · 8.0% mgmt
Financing live
Cash to close
- Down payment
- $107,500
- Closing costs
- $12,900
- Reserves months
- —
- Total cash needed
- —
Loan-product check · same deal, 3 products live
Conventional
25% down · 7.5% · 30yr
- Down + closing
- —
- Monthly P&I
- —
- Monthly cashflow
- —
- DSCR
- —
- Eligible?
- —
Personal DTI + credit; lowest rate.
DSCR
20% down · 8.5% · 30yr
- Down + closing
- —
- Monthly P&I
- —
- Monthly cashflow
- —
- DSCR
- —
- Eligible?
- —
No personal income docs; deal must DSCR.
Hard money
10% down · 12.0% · 12mo
- Down + closing
- —
- Monthly P&I
- —
- Monthly cashflow
- —
- DSCR
- —
- Eligible?
- —
Short-term bridge; refi at stabilization.
Rent comps 3 comps
| Address | Beds | Baths | Sqft | Rent | $/sqft | DOM | Units | Dist |
|---|---|---|---|---|---|---|---|---|
| 383 Johnson Ave Lawrenceville, NJ | 4.0 | 2.0 | 1605 | $3,200 | $1.99 | 13d | 1 | 0.81mi |
| 11 Whitemarsh Dr Lawrence Township, NJ | 4.0 | 2.5 | 2062 | $4,300 | $2.09 | 13d | 1 | 1.07mi |
| 117 Browning Ave Ewing, NJ | 5.0 | 2.0 | 1584 | $3,500 | $2.21 | 21d | 1 | 1.39mi |
Listing history 26 events
-
2026-05-06$430,000 Active 1282-char remark
-
2026-04-28historical
-
2026-04-25price $430,000
-
2026-03-27price $439,900
-
2026-03-13$449,000 Active
-
2025-12-05historical
-
2025-10-23price $459,900
-
2025-09-30price $479,900
-
2025-09-15$489,900 Active
-
2025-09-14historical
-
2024-11-05historical
-
2024-10-02price $490,000
-
2024-09-18$519,900 Active
-
2024-09-17historical
-
2024-08-26price $539,900
-
2024-08-14$574,999 Active
-
2024-08-14historical
-
2018-06-27price $219,900
-
2018-01-30soldstatus $195,000
-
2018-01-26soldstatus $195,000 Closed
-
2018-01-26soldstatus $195,000 Sold
-
2017-12-20historical Contingent - Other
-
2017-10-30price $219,900
-
2017-09-08$224,900 Active No-Show
-
2017-07-13$224,900 Active
-
1999-01-15soldstatus $128,000
ⓘ Source: listings_history table (triggers on properties + properties_extension) + one-shot
backfill from property_details.listing_events for pre-trigger history.
Tax reassessment forecast NJ · Partial reset (capped growth)
- Current annual tax
- $6,302 · $525/mo
- Projected year-2 tax
- $8,504 · $709/mo
- Expected delta
- +$2,203/yr (+$184/mo · 35.0%)
ⓘ Screening estimate from a state-policy table — verify with the county assessor before closing.
Climate risk First Street
- Flood 1/10 Low FEMA zone X (unshaded) · 0% chance over 30 yrs
- Wildfire 1/10 Low
- Heat 6/10 Major 7 d/yr ≥101°F today · 14 d/yr by 30 yrs out
- Wind 6/10 Major 27% chance of damaging wind over 30 yrs
- Air quality 4/10 Moderate 6 unhealthy d/yr today · 7 by 30 yrs out
Nearby sold comps map
Loading sold comps map…
Walkable amenities ~0.75 mi
Loading nearby amenities…
Taxation est. · year 1
- Rental income
- $46,817
- − Mortgage interest
- −$24,087
- − Property taxes
- −$6,302
- − Insurance
- −$2,150
- − Repairs & maintenance
- −$3,745
- − Management
- −$3,745
- − Depreciation
- −$12,509
- Taxable loss
- −$5,721
- Est. tax savings @ 24.0%
- +$1,373
- After-tax cash flow
- $2,847/yr
For passive investors: Depreciation is non-cash, so a rental often shows a tax loss while cash-flowing — sheltering income. Rental losses are passive: they offset passive income freely, and up to $25,000/yr can offset ordinary (W-2) income if you actively participate and your MAGI is under $100k (phasing out to $0 by $150k); unused losses carry forward. On sale, claimed depreciation is recaptured at up to 25%, and gains may owe capital-gains tax (a 1031 exchange can defer both). Figures are a year-1 estimate at your 24.0% rate — not tax advice; consult a CPA.
Schools (NCES district)
- District
- Lawrence Township Public School District
- NCES district ID
- 3408400
- Math proficiency
- 24% ▼ -20.00%
- Reading proficiency
- 52% ▼ -7.00%
- Median HH income
- $89,210
- Composite
- 36.47/100
- National rank
- #4661
- State rank
- #217 of 472 in NJ
Livability — Trenton
- Score
- 76/100
- State rank
- #133
- US rank
- #3533
Category grades
Schools grade is shown separately in the Schools card above.
Census & demographics
- County
- Mercer County · 327,655 people
- City population
- 177,819
- Metro
- Trenton-Princeton, NJ
- Population (ZIP)
- 31,323
- Household income
- $125,514
- Rent vs Own
- Severe rent burden
- 724.0
Population outlook (Mercer County) Hauer SSP2
- Today (2025)
- 381,395 people
- By 2030
- 384,640 · +0.9%
- By 2040
- 391,431 · +2.6%
- By 2050
- 397,845 · +4.3%
- By 2075
- 417,281 · +9.4%
- By 2100
- 420,327 · +10.2%
Race, ethnicity, and origin ACS 2023
- Neighborhood character
- Diverse neighborhood (Simpson 0.63)
- Race & ethnicity
- White 56% Hispanic / Latino 16% Asian 14% Black 12% Two or more races 9%
- Hispanic origin (detail)
- Mexican 2% Puerto Rican 1% Dominican 1%
- Common ancestry
- Romanian 10% Scotch-Irish 2% Italian 1%
- Foreign-born
- 26% · Canada, China, South Korea
- Languages at home
- 66% English-only · Spanish 12% Other Indo-European 6% Russian/Polish/Slavic 6%
Political lean MEDSL · Mercer
- 2024 margin
- Solid D (+33.9) · D 65.9% · R 32.0% · Other 2.1%
- 2008→2024 swing
- -2.2pp toward R · 2008: 36.1pp · 2024: 33.9pp
- All cycles
- 2024: D+33.9 2020: D+40.0 2016: D+36.2 2012: D+36.8 2008: D+36.1
Not yet ingested
- Civics
- —
Market trends
- HPI YoY
- ▼ -323.66%
- Current HPI
- 260.9615
- Rent YoY
- ▬ -0.01%
- Metro
- Trenton-Princeton, NJ
- State GDP YoY
- ▲ 2.05%
- F500 in state
- 34
Industry mix (Fortune 500 HQ in NJ)
| Industry | F500 HQs | Revenue |
|---|---|---|
| Consumer Goods | 3 | $31B |
|
||
| Pharmaceuticals | 2 | $153B |
|
||
| Technology | 2 | $21B |
|
||
| Insurance | 2 | $20B |
|
||
| Healthcare | 2 | $19B |
|
||
| Financial Services | 1 | $70B |
|
||
Price history
+235.9% since first listed27 events — show timeline
- 2026-05-29 Listing Removed — BRIGHT MLS
- 2026-05-06 Listed $430,000 BRIGHT MLS
- 2026-04-28 Listing Removed — BRIGHT MLS
- 2026-04-25 Price Changed $430,000 BRIGHT MLS
- 2026-03-27 Price Changed $439,900 BRIGHT MLS
- 2026-03-13 Listed $449,000 BRIGHT MLS
- 2025-12-05 Listing Removed — BRIGHT MLS
- 2025-10-23 Price Changed $459,900 BRIGHT MLS
- 2025-09-30 Price Changed $479,900 BRIGHT MLS
- 2025-09-15 Listed $489,900 BRIGHT MLS
- 2025-09-14 Coming Soon — BRIGHT MLS
- 2024-11-05 Listing Removed — BRIGHT MLS
- 2024-10-02 Price Changed $490,000 BRIGHT MLS
- 2024-09-18 Listed $519,900 BRIGHT MLS
- 2024-09-17 Listing Removed — BRIGHT MLS
- 2024-08-26 Price Changed $539,900 BRIGHT MLS
- 2024-08-14 Listed $574,999 BRIGHT MLS
- 2024-08-14 Coming Soon — BRIGHT MLS
- 2018-06-27 Price Changed $219,900 BRIGHT MLS
- 2018-01-30 Sold (Public Records) $195,000 Public Records
- 2018-01-26 Sold (MLS) $195,000 TREND
- 2018-01-26 Sold (MLS) $195,000 BRIGHT MLS
- 2017-12-20 Contingent — TREND
- 2017-10-30 Price Changed $219,900 TREND
- 2017-09-08 Listed $224,900 TREND
- 2017-07-13 Listed $224,900 BRIGHT MLS
- 1999-01-15 Sold (Public Records) $128,000 Public Records
Property tax history
+2.3%/yrLatest (2025): $6,302 · +2.2% YoY. Source: county tax records.
Cash-flow waterfall
monthlySold comps — $/sqft
last 12 mo · ≤1 miLoading sold comps…