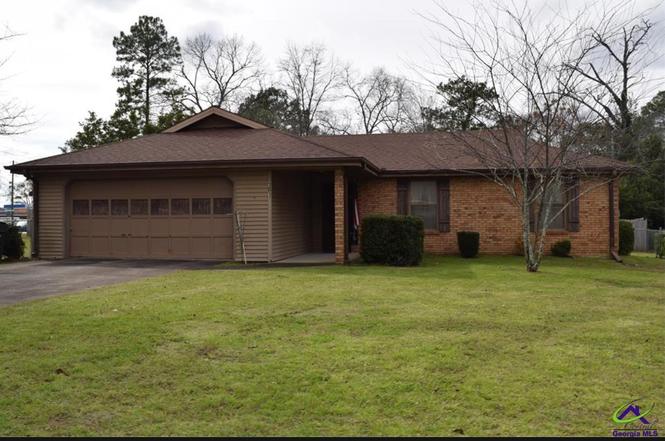
101 Buckskin Dr · Warner Robins, GA
Flood risk 1/10 · Minimal
- FEMA flood zone
- X (unshaded)
- Chance of flooding over 30 yrs
- 0.0%
- Est. flood insurance / yr
- $507 – $1,088
Fire risk 4/10 · Minor
- Est. fire insurance / yr
- $963 – $1,789
Heat risk 7/10 · Major
- Hot days now (above 108°F)
- 7 days/yr
- Hot days in 30 yrs
- 18 days/yr
Wind risk 8/10 · Major
- Chance of severe wind over 30 yrs
- 80.0%
Air-quality risk 3/10 · Minor
- Unhealthy air days now
- 2 days/yr
- Unhealthy air days in 30 yrs
- 3 days/yr
Risk factors via First Street. Map © Google.
Why this score? — see what drove the C+ grade
The composite is a weighted blend of 9 inputs, each scored 0–100. Each bar is that input's sub-score; the figure is the points it added to the 100-point composite (weight × sub-score).
- Cash flow +21.9/30.0
- ARV discount +15.0/15.0
- DSCR +7.0/10.0
- 1% rule +5.1/10.0
- Schools +3.9/10.0
- Livability +3.2/5.0
- Rent growth +2.9/5.0
- Condition / age +2.5/5.0
- Appreciation +0.0/10.0
$160,000
🖨 Deal sheet 📄 Offer letter ✓ Due diligence
Listing remarks
3 bedroom, 2 bathroom home ready for your personal touch! This property offers a great opportunity to update and make it truly your own. Inside, you’ll find a separate dining room perfect for family meals, gatherings, or entertaining. Step outside to enjoy the enclosed porch, a great space to relax with your morning coffee or unwind in the evenings. The floating deck provides the perfect spot for grilling, outdoor dining, and enjoying time with friends and family. With plenty of potential and space to make it your own, this home is the perfect canvas to bring your ideas, style, and personality to life.
Key facts
- Floating deck
- Separate dining room
- Enclosed porch
Tags
Neighborhood map
What this means for you Summary
Snapshot
- This is a 3-bed/2.0-bath single-family listed at $160k.
Deal economics
- At list price, monthly cash flow is $251 ($3k/yr) — positive.
- The deal already cash-flows at list — no discount required.
- Meets the 1% rule at list price ($2k rent vs $160k).
- Cap rate 8.2% vs local median 4.9% in Warner Robins — top-decile yield for the area; either an underpriced asset or a hidden risk that comps aren't pricing in. Stress-test before assuming the spread holds.
Location & tenants
- Location reads 65/100 on livability (#227 in GA) — a middle-class / working-renter tenant base. Strengths: cost of living A+, housing A+, health & safety A+; Watch: employment D+, crime F, amenities F.
- Houston County (urban): math 43% / reading 46% proficiency, ranked #23 of 174 in GA (top 13%) — families likely to look elsewhere, expect single-tenant / working-renter base with shorter leases.
- Zoned schools: Shirley Hills Elementary School (math 44% / reading 52%, grade D, #289 of 1,228 statewide, top 24%, 545 students, 84% FRL); Huntington Middle School (math 23% / reading 32%, grade F, #268 of 470 statewide, top 57%, 827 students, 84% FRL); Warner Robins High School (math 7% / reading 21%, grade F, #322 of 424 statewide, top 76%, 1,816 students, 84% FRL) — zoned schools average 84% FRL vs 46% district-wide (38 pts higher); higher-poverty schools than district average — tighter screening recommended.
- Zoned-school proficiency averages 30% at this address vs 44% district-wide (-15 pts) — the specific schools serving this property underperform the Houston County average; the district grade overstates school quality for this exact location.
- Market conditions: Rents rising (+1.7%/yr); 286 active listings in the ZIP; 30 comparable units currently listed for rent nearby; rentals at typical pace (median 21d on market — plan ~3-4 weeks tenant-placement turnaround); solid renter incomes; 1,545 units permitted in Houston County in 2024 (336 in 5+ unit buildings).
Forward outlook
- Local home prices are declining (-3.0%/yr); year-one equity from $1k of loan paydown is wiped out by about $5k of value loss. Plan a longer hold.
- Houston County population projected at +22% by 2050 — long-run rental-demand tailwind backs the buy-and-hold thesis.
Negotiation context
- Only 11 days on market — expect competitive offers; lowballing is unlikely to land.
- 2 sale attempts with the ask held roughly flat each time — persistent listings suggest the price (not the market) is what's stuck; bring a comps-based counter.
- Current owner paid $77k; list at $160k implies a 108% gain — meaningful room to come down on a strong offer.
Risks & watch-outs
- Climate carrying-cost: severe wind risk, 80% chance of damaging wind over 30y; extreme-heat days projected 7→18/yr by 2055 (HVAC capex compounding) — expect insurance premiums to compound above CPI over the hold.
Questions for the listing agent
- Is there a deadline driving the sale (1031 exchange, divorce, estate, relocation)? That informs how much negotiation room exists.
- Schools are D-rated, which usually means shorter tenancies and higher turnover. Who's the typical renter profile here, and what's been the actual vacancy rate?
- Crime grade is F in this area — have there been break-ins, vandalism, or insurance claims at this property in the last 3 years? What carrier currently insures it and at what premium?
- What's the average days-on-market for RENTAL listings here right now (not sales)? A rising rental-DOM trend means longer vacancies and softer asking-rent achievability than the comps imply.
- What's the recent tenant-quality profile in this submarket — average credit score on applications, eviction rate, late-payment / NSF rate, and stable-employment percentage? A property-management company in the area should have these aggregated.
- How much new for-sale + rental construction is in the pipeline within 1–3 miles? Heavy new supply typically softens prices + rents 12–24 months out; constrained supply supports both.
Investment metrics
- 1% rule
- 1.01% ✓
- Cap rate
- 8.17%
- Cash-on-cash
- 6.72%
- DSCR
- 1.30
- GRM
- 8.2
CMA / ARV
- ARV (on-the-fly)
- $228,780
- Comps found
- 12
Show comp detail 12 sales within ~0.75 mi
| Address | Dist | Beds/Ba | Sqft | Sold | Price | $/sf | Match |
|---|---|---|---|---|---|---|---|
| 111 Turtle Creek Dr | 0.44mi | 3/2.0 | 1,542 (+4%) | 2mo | $230,000 | $149 | 70 |
| 212 Wynfield Ln | 0.42mi | 3/2.0 | 1,396 (-5%) | 2mo | $215,000 | $154 | 70 |
| 111 Chadwyck Ln | 0.18mi | 3/2.0 | 1,259 (-15%) | 1mo | $180,000 | $143 | 66 |
| 220 Gray Fox Xing | 0.66mi | 3/2.0 | 1,548 (+5%) | 0mo | $239,900 | $155 | 61 |
| 121 Chadwyck Cir | 0.32mi | 3/2.0 | 1,264 (-14%) | 4mo | $195,000 | $154 | 57 |
| 202 Eric Ct | 0.62mi | 3/2.0 | 1,600 (+8%) | 1mo | $291,900 | $182 | 56 |
| 117 Fieldwalk Chase | 0.70mi | 3/2.0 | 1,560 (+6%) | 3mo | $170,000 | $109 | 56 |
| 407 Gray Fox Xing | 0.71mi | 3/2.0 | 1,571 (+6%) | 2mo | $237,500 | $151 | 54 |
| 200 Eric Ct | 0.64mi | 3/2.0 | 1,611 (+9%) | 4mo | $291,869 | $181 | 52 |
| 522 Grand Ave | 0.69mi | 3/2.0 | 1,356 (-8%) | 3mo | $219,900 | $162 | 52 |
| 208 Eric Ct | 0.67mi | 3/2.0 | 1,611 (+9%) | 3mo | $291,869 | $181 | 52 |
| 103 Meadow Ct | 0.71mi | 3/2.0 | 1,338 (-9%) | 4mo | $210,000 | $157 | 48 |
Match score weights: distance 35% · size 25% · config 20% · recency 20%. Top-matched comps best support the ARV.
Projected returns pro-forma
-3.0% appreciation · 1.67% rent growth · sell at horizon
- IRR
- -7.4%
- Equity multiple
- 0.73×
- Total profit
- $-12,119
- Equity at exit
- $23,857
- IRR
- 0.5%
- Equity multiple
- 1.03×
- Total profit
- $1,377
- Equity at exit
- $13,834
Cash invested: $44,800 (down + closing). Projections, not guarantees.
Landlord ↔ Tenant lean methodology
- Overall (STATE)
- 90 Strongly Landlord-Friendly
- State Georgia
- 90 Strongly Landlord-Friendly · R+3
- County
- — inherits STATE
- City
- — inherits STATE
ZIP-level market 31088
- Rents YoY
- 1.7%
- Active inventory
- 286
- Price-to-rent
- 8.2×
Monthly cashflow live
- Estimated rent
- $1,618 high interval (Pro) →
- Mortgage (P&I)
- −$839
- Tax from tax record
- −$122 /mo · $1,459/yr
- Insurance
- −$67
- HOA
- −$0
- Vacancy / Maint / Mgmt
- −$340
- Net cashflow
- $251
Break-even live
UW: 25.0% down · 7.5% · 30yr · 1.5% tax · 5.0% vac · 8.0% maint · 8.0% mgmt
Financing live
Cash to close
- Down payment
- $40,000
- Closing costs
- $4,800
- Reserves months
- —
- Total cash needed
- —
Loan-product check · same deal, 3 products live
Conventional
25% down · 7.5% · 30yr
- Down + closing
- —
- Monthly P&I
- —
- Monthly cashflow
- —
- DSCR
- —
- Eligible?
- —
Personal DTI + credit; lowest rate.
DSCR
20% down · 8.5% · 30yr
- Down + closing
- —
- Monthly P&I
- —
- Monthly cashflow
- —
- DSCR
- —
- Eligible?
- —
No personal income docs; deal must DSCR.
Hard money
10% down · 12.0% · 12mo
- Down + closing
- —
- Monthly P&I
- —
- Monthly cashflow
- —
- DSCR
- —
- Eligible?
- —
Short-term bridge; refi at stabilization.
Rent comps 30 comps
| Address | Beds | Baths | Sqft | Rent | $/sqft | DOM | Units | Dist |
|---|---|---|---|---|---|---|---|---|
| 615 Cedarwood Dr Unit 611 Bonaire, GA | 3.0 | 1.0 | 902 | $1,095 | $1.21 | 21d | 1 | 0.26mi |
| 614 Cedarwood Dr Bonaire, GA | 3.0 | 1.0 | 902 | $925 | $1.03 | 21d | 1 | 0.28mi |
| 120 Chadwyck Cir Bonaire, GA | 3.0 | 2.0 | 1266 | $1,650 | $1.30 | 21d | 1 | 0.29mi |
| 627 Maplewood Dr Bonaire, GA | 3.0 | 2.0 | 1080 | $975 | $0.90 | 21d | 1 | 0.30mi |
| 642 Maplewood Dr Bonaire, GA | 3.0 | 2.0 | 1100 | $1,400 | $1.27 | 43d | 1 | 0.33mi |
| 100 Strawbridge Ln Bonaire, GA | 3.0 | 2.0 | 1248 | $1,600 | $1.28 | 21d | 1 | 0.41mi |
| 100 Strawbridge Ln Bonaire, GA | 3.0 | 2.0 | 1248 | $1,600 | $1.28 | 43d | 1 | 0.41mi |
| 210 Strawbridge Ln Bonaire, GA | 3.0 | 2.0 | 1214 | $1,600 | $1.32 | 21d | 1 | 0.49mi |
| 113 Gray Fox Xing Bonaire, GA | 4.0 | 2.0 | 1717 | $2,200 | $1.28 | 21d | 1 | 0.77mi |
| 109 Leisure Pointe Cv Warner Robins, GA | 4.0 | 2.5 | 1682 | $1,925 | $1.14 | 43d | 1 | 0.78mi |
| 106 Leisure Pointe Cv Warner Robins, GA | 4.0 | 2.5 | 1682 | $1,950 | $1.16 | 13d | 1 | 0.79mi |
| 106 Leisure Pointe Cv Warner Robins, GA | 4.0 | 2.5 | 1682 | $2,000 | $1.19 | 43d | 1 | 0.79mi |
| 108 Crossfield Dr Warner Robins, GA | 3.0 | 2.0 | 1548 | $1,795 | $1.16 | 21d | 1 | 0.87mi |
| 102 Duxbury Ct Bonaire, GA | 3.0 | 2.0 | 1725 | $1,975 | $1.14 | 21d | 1 | 0.88mi |
| 203 Bryson Way Warner Robins, GA | 3.0 | 2.0 | 1858 | $1,850 | $1.00 | 43d | 1 | 0.94mi |
| 101 Webster Way Warner Robins, GA | 3.0 | 2.0 | 1320 | $1,650 | $1.25 | 43d | 1 | 1.02mi |
| 116 Webster Way Warner Robins, GA | 2.0 | 2.0 | 1320 | $1,650 | $1.25 | 43d | 1 | 1.05mi |
| 91 Bass Rd Warner Robins, GA | 1.0–3.0 | 1.0–2.5 | 1008 | $2,199 | $2.18 | 13d | 11 | 1.05mi |
| 800 Leisure Lake Dr Warner Robins, GA | 1.0–2.0 | 1.0–2.0 | 950 | $1,365 | $1.44 | 13d | 34 | 1.07mi |
| 104 Melissa Ln Warner Robins, GA | 3.0 | 2.0 | 1372 | $1,675 | $1.22 | 44d | 1 | 1.09mi |
| 251 Randy Cir Warner Robins, GA | 3.0 | 2.0 | 1025 | $1,275 | $1.24 | 21d | 1 | 1.12mi |
| 132 Cathy Ct Warner Robins, GA | 3.0 | 1.5 | 1428 | $1,450 | $1.02 | 21d | 1 | 1.25mi |
| 132 Cathy Ct Warner Robins, GA | 3.0 | 2.0 | 1428 | $1,450 | $1.02 | 13d | 1 | 1.25mi |
| 1010 S Houston Lake Rd Warner Robins, GA | 1.0–3.0 | 1.0–2.0 | 1088 | $1,572 | $1.44 | 13d | 23 | 1.30mi |
| 406 Haverhill Cir Warner Robins, GA | 3.0 | 2.0 | 1279 | $1,550 | $1.21 | 43d | 1 | 1.30mi |
| 121 Highland Dr Warner Robins, GA | 3.0 | 2.0 | 1712 | $1,795 | $1.05 | 21d | 1 | 1.31mi |
| 121 Highland Dr Warner Robins, GA | 3.0 | 2.0 | 1712 | $1,795 | $1.05 | 43d | 1 | 1.31mi |
| 115 Cheryl Blvd Warner Robins, GA | 3.0 | 2.0 | 1328 | $1,500 | $1.13 | 13d | 1 | 1.40mi |
| 115 Cheryl Blvd Warner Robins, GA | 3.0 | 2.0 | 1328 | $1,500 | $1.13 | 21d | 1 | 1.40mi |
| 218 Tallulah Trl Warner Robins, GA | 2.0 | 2.0 | 1050 | $1,200 | $1.14 | 43d | 1 | 1.46mi |
Listing history 5 events
-
2026-04-23status Pending
-
2026-04-15status Active
-
2026-03-12status Pending
-
2026-03-09$160,000 Active
-
2001-01-30soldstatus $77,000
ⓘ Source: listings_history table (triggers on properties + properties_extension) + one-shot
backfill from property_details.listing_events for pre-trigger history.
Tax reassessment forecast GA · Resets to sale price
- Current annual tax
- $1,459 · $122/mo
- Projected year-2 tax
- $1,472 · $123/mo
- Expected delta
- +$13/yr (+$1/mo · 0.9%)
ⓘ Screening estimate from a state-policy table — verify with the county assessor before closing.
Climate risk First Street
- Flood 1/10 Low FEMA zone X (unshaded) · 0% chance over 30 yrs
- Wildfire 4/10 Moderate
- Heat 7/10 Severe 7 d/yr ≥108°F today · 18 d/yr by 30 yrs out
- Wind 8/10 Severe 80% chance of damaging wind over 30 yrs
- Air quality 3/10 Moderate 2 unhealthy d/yr today · 3 by 30 yrs out
Nearby sold comps map
Loading sold comps map…
Walkable amenities ~0.75 mi
Loading nearby amenities…
Taxation est. · year 1
- Rental income
- $19,413
- − Mortgage interest
- −$8,962
- − Property taxes
- −$1,459
- − Insurance
- −$800
- − Repairs & maintenance
- −$1,553
- − Management
- −$1,553
- − Depreciation
- −$4,655
- Taxable income
- $431
- Est. tax owed @ 24.0%
- −$103
- After-tax cash flow
- $2,905/yr
For passive investors: Depreciation is non-cash, so a rental often shows a tax loss while cash-flowing — sheltering income. Rental losses are passive: they offset passive income freely, and up to $25,000/yr can offset ordinary (W-2) income if you actively participate and your MAGI is under $100k (phasing out to $0 by $150k); unused losses carry forward. On sale, claimed depreciation is recaptured at up to 25%, and gains may owe capital-gains tax (a 1031 exchange can defer both). Figures are a year-1 estimate at your 24.0% rate — not tax advice; consult a CPA.
Schools (NCES district)
- District
- Houston County
- NCES district ID
- 1302880
- Math proficiency
- 43% ▼ -7.00%
- Reading proficiency
- 46% ▼ -2.00%
- Median HH income
- $54,823
- Composite
- 38.68/100
- National rank
- #4144
- State rank
- #23 of 174 in GA
Livability — Warner Robins
- Score
- 65/100
- State rank
- #227
- US rank
- #13290
Category grades
Schools grade is shown separately in the Schools card above.
Census & demographics
- Census place
- Warner Robins, GA
- County
- Houston County · 157,321 people
- City population
- 92,102
- Metro
- Warner Robins, GA
- Population (ZIP)
- 58,585
- Household income
- $83,082
- Rent vs Own
- Severe rent burden
- 1668.0
Population outlook (Houston County) Hauer SSP2
- Today (2025)
- 169,502 people
- By 2030
- 178,486 · +5.3%
- By 2040
- 194,642 · +14.8%
- By 2050
- 207,119 · +22.2%
- By 2075
- 231,480 · +36.6%
- By 2100
- 235,034 · +38.7%
Race, ethnicity, and origin ACS 2023
- Neighborhood character
- Diverse neighborhood (Simpson 0.63)
- Race & ethnicity
- White 51% Black 32% Two or more races 9% Hispanic / Latino 7% Asian 4%
- Hispanic origin (detail)
- Mexican 4%
- Common ancestry
- Romanian 2% Slovak 2% Lithuanian 2%
- Foreign-born
- 9% · Canada, Vietnam, Jamaica
- Languages at home
- 90% English-only · Spanish 5% Other Asian/Pacific 2% Vietnamese 2%
Political lean MEDSL · Houston
- 2024 margin
- R (+11.3) · D 44.0% · R 55.3%
- 2008→2024 swing
- +8.9pp toward D · 2008: -20.2pp · 2024: -11.3pp
- All cycles
- 2024: R+11.3 2020: R+12.4 2016: R+21.6 2012: R+20.7 2008: R+20.2
Not yet ingested
- Civics
- —
Market trends
- HPI YoY
- ▼ -135.75%
- Current HPI
- 219.8261
- Rent YoY
- ▲ 1.67%
- Metro
- Warner Robins, GA
- State GDP YoY
- ▲ 2.66%
- F500 in state
- 28
Industry mix (Fortune 500 HQ in GA)
| Industry | F500 HQs | Revenue |
|---|---|---|
| Paper / Packaging | 2 | $29B |
|
||
| Retail | 1 | $160B |
|
||
| Transportation / Logistics | 1 | $91B |
|
||
| Airlines | 1 | $62B |
|
||
| Consumer Goods | 1 | $47B |
|
||
| Utilities | 1 | $25B |
|
||
Price history
+107.8% since first listed5 events — show timeline
- 2026-04-23 Pending — CGMLS
- 2026-04-15 Relisted — CGMLS
- 2026-03-12 Pending — CGMLS
- 2026-03-09 Listed $160,000 CGMLS
- 2001-01-30 Sold (Public Records) $77,000 Public Records
Property tax history
+4.6%/yrLatest (2025): $1,459 · +9.0% YoY. Source: county tax records.
Cash-flow waterfall
monthlySold comps — $/sqft
last 12 mo · ≤1 miLoading sold comps…