15530 S Rolling Ridge Dr · Cordes Lakes, AZ
Flood risk 1/10 · Minimal
- FEMA flood zone
- X (unshaded)
- Chance of flooding over 30 yrs
- 0.0%
- Est. flood insurance / yr
- $507 – $1,088
Fire risk 6/10 · Moderate
- Est. fire insurance / yr
- $610 – $1,132
Heat risk 6/10 · Moderate
- Hot days now (above 102°F)
- 6 days/yr
- Hot days in 30 yrs
- 14 days/yr
Wind risk 1/10 · Minimal
- Chance of severe wind over 30 yrs
- —
Air-quality risk 2/10 · Minimal
- Unhealthy air days now
- 1 days/yr
- Unhealthy air days in 30 yrs
- 1 days/yr
Risk factors via First Street. Map © Google.
Why this score? — see what drove the A- grade
The composite is a weighted blend of 9 inputs, each scored 0–100. Each bar is that input's sub-score; the figure is the points it added to the 100-point composite (weight × sub-score).
- Cash flow +29.9/30.0
- ARV discount +15.0/15.0
- DSCR +10.0/10.0
- Appreciation +10.0/10.0
- 1% rule +7.2/10.0
- Livability +3.0/5.0
- Rent growth +2.5/5.0
- Condition / age +2.5/5.0
- Schools +2.0/10.0
$165,000
🖨 Deal sheet 📄 Offer letter ✓ Due diligence
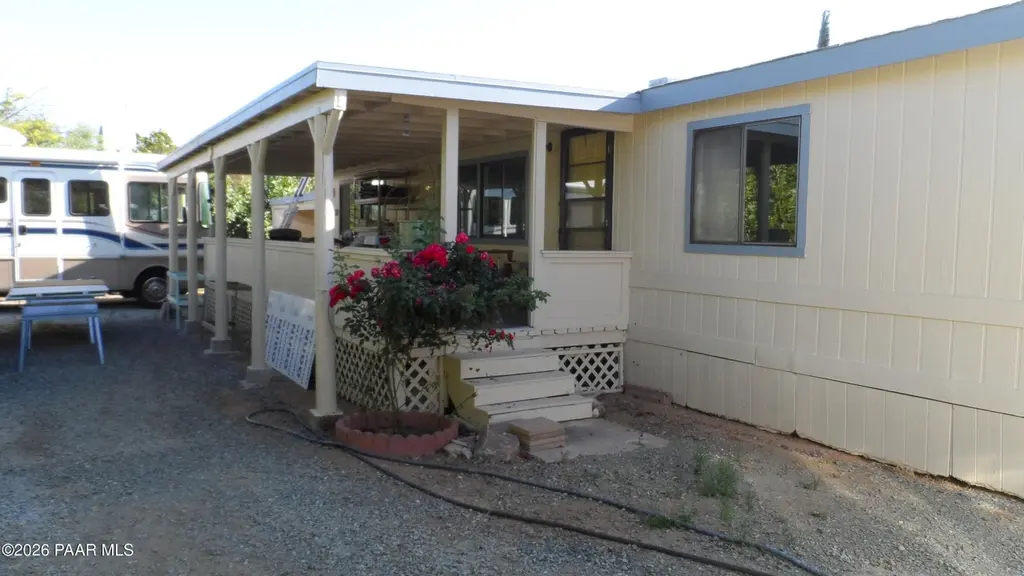
Listing remarks
This home is across the street from state land, is very quiet and has plenty of room with many trees. Split floorplan with a large primary bedroom, bedrooms 2 and 3 have walk in closets , skylight in the kitchen and living room, all rooms have large windows. 2 driveways and 2 carports along with very large front and rear covered porches. 3 good sized storage buildings. Interior and exterior has fresh paint with 3 coats of top quality Behr paint and the roofs have 3 coats of 15 year acrylic roof coating. Plumbing has been replaced with PEX recently, complete newer propane furnace and central air conditioning systems that work very well. New Kohler toilets, bath fans and lights in both bathro
Key facts
- Large windows
- 2 carports
- Split floorplan
Tags
Property features AI
Finance
- Other: Zoning: R1-10; Lot size source: county records; Subdivision: Cordes Lakes
- HOA & community: Not a senior community
Exterior
- Parking: Total 2 parking spaces; Attached 2-car carport; RV parking available (off-street)
- Utilities: 220-volt electric; Propane service; Private water source; Septic (conventional); Phone available; Underground utilities
- Home design: Residential manufactured home (double wide); Single-story
- Construction: Frame construction; Other roof type; Piers foundation; Two buildings on property
- Exterior features: Covered patio/porch; Gravel driveway; Shed(s); Workshop; Corner, level lot; County-maintained road frontage; Asphalt/paved road surface
Interior
- Kitchen: Dishwasher; Gas range; Refrigerator
- Flooring: Wood flooring; Other flooring
- Bathrooms: 1 full bathroom; 1 three-quarter bathroom
- Heating & cooling: Central air conditioning; Forced-air heating (gas/propane)
- Interior features: Soaking tub; Laminate counters; Open living/dining area; High ceilings with vaulted sections; Walk-in closets; Washer/dryer connection; Laundry room; Storage
- Laundry & utility: Washer and dryer hookup; 29-gallon propane water heater
Neighborhood map
What this means for you Summary
Snapshot
- This is a 3-bed/2.0-bath manufactured listed at $165k.
Deal economics
- At list price, monthly cash flow is $612 ($7k/yr) — positive.
- The deal already cash-flows at list — no discount required.
- Meets the 1% rule at list price ($2k rent vs $165k).
- Recommended offer: $163k (1.5% below list) — sets the bar for market timing.
- Cap rate 10.7% vs local median 5.1% in Cordes Lakes — top-decile yield for the area; either an underpriced asset or a hidden risk that comps aren't pricing in. Stress-test before assuming the spread holds.
Location & tenants
- Location reads 60/100 on livability (#181 in AZ) — a middle-class / working-renter tenant base. Strengths: cost of living A+, housing A+, crime A-; Watch: schools F, amenities F, commute F.
- Mayer Unified School District (4473) (rural): math 23% / reading 26% proficiency, ranked #165 of 249 in AZ (top 66%) — low school quality limits family demand, transient renter base, plan for 1-2y turnover; 80% free/reduced lunch — lower-income household profile, screen leases tightly.
- Market conditions: 242 active listings in the ZIP; 2,062 units permitted in Yavapai County in 2024 (98 in 5+ unit buildings).
Forward outlook
- In year one you build about $18k of equity ($1k loan paydown + $16k appreciation (10.0% local appreciation)).
- Yavapai County population projected at +10% by 2050 — modest demand growth; plan on rents tracking national, not racing it.
- At projected returns (10.0% appreciation + 3.0% rent growth), your $46k cash investment doubles in ~2 years — after that, you're playing with house money.
- By year 3, paydown + projected appreciation supports a ~$45k cash-out refi (75% LTV) — recoverable capital for the next deal without selling this one.
Negotiation context
- It's been on market 17 days — a 2% lower offer ($163k) is reasonable based on typical stale-listing flexibility.
- Current owner paid $70k; list at $165k implies a 136% gain — meaningful room to come down on a strong offer.
Risks & watch-outs
- Climate carrying-cost: major wildfire risk; extreme-heat days projected 6→14/yr by 2055 (HVAC capex compounding) — expect insurance premiums to compound above CPI over the hold.
Questions for the listing agent
- Is there a deadline driving the sale (1031 exchange, divorce, estate, relocation)? That informs how much negotiation room exists.
- Schools are F-rated, which usually means shorter tenancies and higher turnover. Who's the typical renter profile here, and what's been the actual vacancy rate?
- What's the average days-on-market for RENTAL listings here right now (not sales)? A rising rental-DOM trend means longer vacancies and softer asking-rent achievability than the comps imply.
- What's the recent tenant-quality profile in this submarket — average credit score on applications, eviction rate, late-payment / NSF rate, and stable-employment percentage? A property-management company in the area should have these aggregated.
- How much new for-sale + rental construction is in the pipeline within 1–3 miles? Heavy new supply typically softens prices + rents 12–24 months out; constrained supply supports both.
Investment metrics
- 1% rule
- 1.22% ✓
- Cap rate
- 10.74%
- Cash-on-cash
- 15.90%
- DSCR
- 1.71
- GRM
- 6.9
CMA / ARV
- ARV (on-the-fly)
- $239,232
- Comps found
- 12
Show comp detail 12 sales within ~0.75 mi
| Address | Dist | Beds/Ba | Sqft | Sold | Price | $/sf | Match |
|---|---|---|---|---|---|---|---|
| 20629 E Prickly Pear Dr | 0.36mi | 3/2.0 | 1,407 (+5%) | 7mo | $199,900 | $142 | 70 |
| 20415 E Sierra Dr E #8 | 0.53mi | 3/2.0 | 1,380 (+3%) | 4mo | $289,000 | $209 | 68 |
| 20605 E Conestoga Dr | 0.40mi | 3/2.0 | 1,420 (+6%) | 6mo | $260,000 | $183 | 67 |
| 20935 E Bright Sun (1.03 Acres) Way | 0.04mi | 3/2.0 | 1,173 (-13%) | 16mo | $306,000 | $261 | 64 |
| 20809 E Antelope Rd | 0.74mi | 3/2.0 | 1,350 (+0%) | 3mo | $239,900 | $178 | 62 |
| 20576 E Quail Run Dr | 0.56mi | 3/2.0 | 1,380 (+3%) | 16mo | $230,500 | $167 | 56 |
| 20720 E Larry Lane Ln | 0.39mi | 3/2.0 | 1,526 (+14%) | 6mo | $210,000 | $138 | 54 |
| 20518 E Sierra Dr | 0.47mi | 3/2.0 | 1,210 (-10%) | 14mo | $224,900 | $186 | 50 |
| 20542 E Stagecoach Trl | 0.48mi | 3/2.0 | 1,248 (-7%) | 18mo | $220,000 | $176 | 50 |
| 20721 E Mingus Dr | 0.45mi | 3/2.0 | 1,152 (-14%) | 7mo | $190,000 | $165 | 49 |
| 20850 E Cedar Dr | 0.69mi | 2/2.0 (-1) | 1,184 (-12%) | 3mo | $74,000 | $63 | 41 |
| 20225 E Conestoga Dr | 0.70mi | 3/2.0 | 1,173 (-13%) | 16mo | $239,000 | $204 | 33 |
Match score weights: distance 35% · size 25% · config 20% · recency 20%. Top-matched comps best support the ARV.
Projected returns pro-forma
10.0% appreciation · 3.0% rent growth · sell at horizon
- IRR
- 36.0%
- Equity multiple
- 3.79×
- Total profit
- $128,767
- Equity at exit
- $148,645
- IRR
- 31.0%
- Equity multiple
- 8.54×
- Total profit
- $348,402
- Equity at exit
- $320,559
Cash invested: $46,200 (down + closing). Projections, not guarantees.
Landlord ↔ Tenant lean methodology
- Overall (STATE)
- 87 Strongly Landlord-Friendly
- State Arizona
- 87 Strongly Landlord-Friendly · R+3
- County
- — inherits STATE
- City
- — inherits STATE
ZIP-level market 86333
- Home prices YoY
- 17.3%
- Active inventory
- 242
- Price-to-rent
- 6.9×
Monthly cashflow live
- Estimated rent
- $2,006 medium interval (Pro) →
- Mortgage (P&I)
- −$865
- Tax from tax record
- −$38 /mo · $460/yr
- Insurance
- −$69
- HOA
- −$0
- Vacancy / Maint / Mgmt
- −$421
- Net cashflow
- $612
Break-even live
UW: 25.0% down · 7.5% · 30yr · 1.5% tax · 5.0% vac · 8.0% maint · 8.0% mgmt
Financing live
Cash to close
- Down payment
- $41,250
- Closing costs
- $4,950
- Reserves months
- —
- Total cash needed
- —
Loan-product check · same deal, 3 products live
Conventional
25% down · 7.5% · 30yr
- Down + closing
- —
- Monthly P&I
- —
- Monthly cashflow
- —
- DSCR
- —
- Eligible?
- —
Personal DTI + credit; lowest rate.
DSCR
20% down · 8.5% · 30yr
- Down + closing
- —
- Monthly P&I
- —
- Monthly cashflow
- —
- DSCR
- —
- Eligible?
- —
No personal income docs; deal must DSCR.
Hard money
10% down · 12.0% · 12mo
- Down + closing
- —
- Monthly P&I
- —
- Monthly cashflow
- —
- DSCR
- —
- Eligible?
- —
Short-term bridge; refi at stabilization.
Listing history 13 events
-
2026-06-18days on market $165,000 Active 17 DOM
-
2026-06-17days on market $165,000 Active 16 DOM
-
2026-06-16days on market $165,000 Active 15 DOM
-
2026-06-15pricedays on market $165,000 Active 14 DOM
-
2026-06-14days on market $175,000 Active 12 DOM
-
2026-06-13days on market $175,000 Active 11 DOM
-
2026-06-10days on market $175,000 Active 9 DOM
-
2026-06-09days on market $175,000 Active 8 DOM
-
2026-06-08days on market $175,000 Active 7 DOM
-
2026-06-07days on market $175,000 Active 6 DOM
-
2026-06-03days on market $175,000 Active 2 DOM
-
2026-06-02remarks 699-char remark
-
2026-06-02$175,000 Active 1 DOM
ⓘ Source: listings_history table (triggers on properties + properties_extension) + one-shot
backfill from property_details.listing_events for pre-trigger history.
Tax reassessment forecast AZ · Resets to sale price
- Current annual tax
- $460 · $38/mo
- Projected year-2 tax
- $1,089 · $91/mo
- Expected delta
- +$629/yr (+$52/mo · 136.6%)
ⓘ Screening estimate from a state-policy table — verify with the county assessor before closing.
Climate risk First Street
- Flood 1/10 Low FEMA zone X (unshaded) · 0% chance over 30 yrs
- Wildfire 6/10 Major
- Heat 6/10 Major 6 d/yr ≥102°F today · 14 d/yr by 30 yrs out
- Wind 1/10 Low
- Air quality 2/10 Low 1 unhealthy d/yr today · 1 by 30 yrs out
Nearby sold comps map
Loading sold comps map…
Walkable amenities ~0.75 mi
Loading nearby amenities…
Taxation est. · year 1
- Rental income
- $24,066
- − Mortgage interest
- −$9,243
- − Property taxes
- −$460
- − Insurance
- −$825
- − Repairs & maintenance
- −$1,925
- − Management
- −$1,925
- − Depreciation
- −$4,800
- Taxable income
- $4,888
- Est. tax owed @ 24.0%
- −$1,173
- After-tax cash flow
- $6,171/yr
For passive investors: Depreciation is non-cash, so a rental often shows a tax loss while cash-flowing — sheltering income. Rental losses are passive: they offset passive income freely, and up to $25,000/yr can offset ordinary (W-2) income if you actively participate and your MAGI is under $100k (phasing out to $0 by $150k); unused losses carry forward. On sale, claimed depreciation is recaptured at up to 25%, and gains may owe capital-gains tax (a 1031 exchange can defer both). Figures are a year-1 estimate at your 24.0% rate — not tax advice; consult a CPA.
Schools (NCES district)
- District
- Mayer Unified School District (4473)
- NCES district ID
- 0404820
- Math proficiency
- 23% ▼ -11.00%
- Reading proficiency
- 26% ▼ -13.00%
- Median HH income
- $35,108
- Composite
- 20.22/100
- National rank
- #8627
- State rank
- #165 of 249 in AZ
Livability — Cordes Lakes
- Score
- 60/100
- State rank
- #181
- US rank
- #19144
Category grades
Schools grade is shown separately in the Schools card above.
Census & demographics
- Census place
- Cordes Lakes, AZ
- Population (ZIP)
- 6,425
Population outlook (Yavapai County) Hauer SSP2
- Today (2025)
- 241,389 people
- By 2030
- 249,523 · +3.4%
- By 2040
- 259,966 · +7.7%
- By 2050
- 264,736 · +9.7%
- By 2075
- 269,334 · +11.6%
- By 2100
- 256,505 · +6.3%
Race, ethnicity, and origin ACS 2023
- Neighborhood character
- Predominantly White (77%)
- Race & ethnicity
- White 77% Two or more races 15% Hispanic / Latino 14%
- Hispanic origin (detail)
- Mexican 11% Puerto Rican 1%
- Common ancestry
- Lithuanian 6% Iranian 3% Romanian 3%
- Foreign-born
- 5% · Canada
- Languages at home
- 93% English-only · Spanish 6% Russian/Polish/Slavic 1%
Political lean MEDSL · Yavapai
- 2024 margin
- Solid R (+33.9) · D 32.6% · R 66.5%
- 2008→2024 swing
- -9.5pp toward R · 2008: -24.4pp · 2024: -33.9pp
- All cycles
- 2024: R+33.9 2020: R+29.3 2016: R+31.4 2012: R+30.7 2008: R+24.4
Not yet ingested
- Civics
- —
Market trends
- HPI YoY
- ▲ 55.51%
- Current HPI
- 376.0374
- Rent YoY
- —
- Metro
- —
- State GDP YoY
- ▲ 4.54%
- F500 in state
- 20
Industry mix (Fortune 500 HQ in AZ)
| Industry | F500 HQs | Revenue |
|---|---|---|
| Technology | 2 | $13B |
|
||
| Mining / Metals | 1 | $23B |
|
||
| Environmental Services | 1 | $16B |
|
||
| Metals / Steel | 1 | $14B |
|
||
| Technology Distribution | 1 | $9B |
|
||
| Homebuilding | 1 | $8B |
|
||
Price history
+157.4% since first listed3 events — show timeline
- 2026-06-01 Listed $175,000 PAARMLS as Distributed by MLS Grid
- 2025-05-08 Sold (Public Records) $70,000 Public Records
- 1996-04-05 Sold (Public Records) $68,000 Public Records
Property tax history
+2.0%/yrLatest (2025): $460 · +6.6% YoY. Source: county tax records.
Cash-flow waterfall
monthlySold comps — $/sqft
last 12 mo · ≤1 miLoading sold comps…